 FEXLINK Research Institute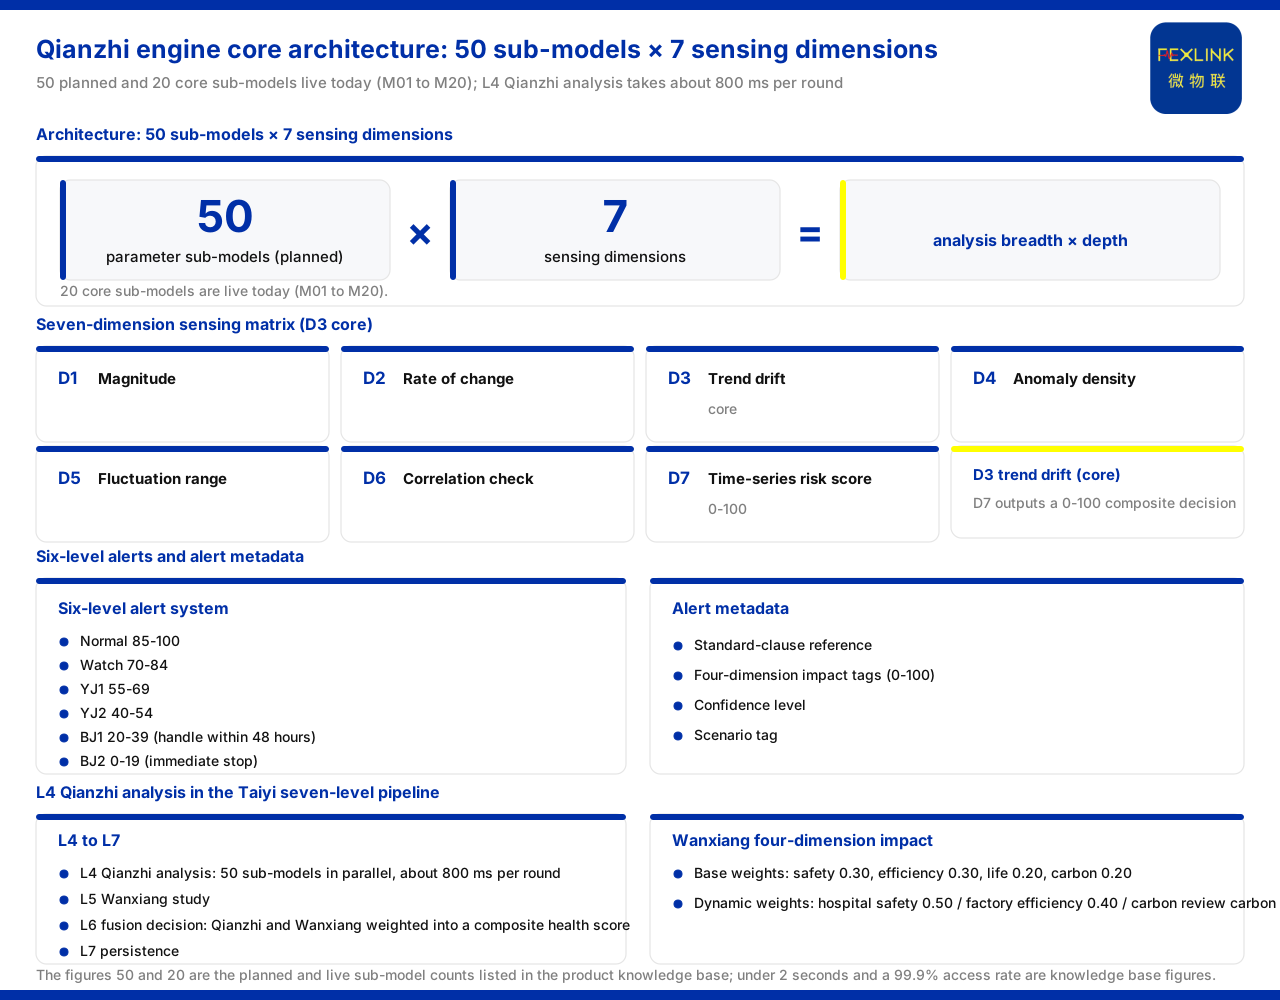
Direct answer
The core architecture of the Qianzhi engine (large model) is given by the product knowledge base as "50 parameter sub-models (currently 20 core M01 to M20) times 7-dimensional perception." That is, the width of analysis is planned to be borne by 50 sub-models, currently delivered as 20 core sub-models, and the depth of analysis is provided by the 7-dimensional perception matrix, namely D1 amplitude, D2 rate of change, D3 trend drift (core), D4 anomaly density, D5 fluctuation amplitude, D6 association verification and D7 time-series risk score (0 to 100 composite decision). In the seven-level pipeline of the Taiyi intelligent control hub system, L4 Qianzhi analysis runs 50 sub-models in parallel at about 800 milliseconds per round; L5 is Wanxiang study, L6 is fusion decision (Qianzhi and Wanxiang weighted to form a composite health score), and L7 is persistence; the end-to-end latency of the whole pipeline is less than 2 seconds and the data access success rate is 99.9%. This article restates only the items listed by the product knowledge base and infers no unlisted sub-model or weight detail.
1. 50 sub-models times 7-dimensional perception
The product knowledge base writes the Qianzhi engine's core architecture as a product of two numbers: 50 parameter sub-models and 7-dimensional perception. This means the architecture is not an extension along a single dimension but a combination of the "parameter direction" and the "perception direction." The parameter sub-models answer "which quantities to look at," and the perception dimensions answer "from which angles to look at each quantity." A distinction must be drawn between the planned number and the current number. The knowledge base records that the 50 parameter sub-models are the planning specification, with 20 core sub-models (M01 to M20) currently delivered. Recording the two numbers together shows that the knowledge base clearly distinguishes "planned" from "current." This article cites strictly to that specification, does not equate 50 with fully delivered, and infers neither the names nor the schedule of the remaining sub-models.
2. The 7-dimensional perception matrix
The product knowledge base records that the 7-dimensional perception matrix has seven dimensions: D1 amplitude, D2 rate of change, D3 trend drift, D4 anomaly density, D5 fluctuation amplitude, D6 association verification and D7 time-series risk score. The seven are not repeats of one kind of judgement but observations of the same data from different angles. D1 amplitude concerns the size of the instantaneous quantity; D2 rate of change concerns how fast it changes; D3 trend drift concerns the slow directional movement of the mean; D4 anomaly density concerns how densely anomalies appear within a period; D5 fluctuation amplitude concerns the rise and fall around the mean; D6 association verification concerns whether several related quantities can mutually corroborate; and D7 time-series risk score aggregates the foregoing into a composite decision value of 0 to 100. Placing the seven together shows the design intent: to see "what it is now," "where it is heading," "whether it appears densely" and "whether other quantities corroborate it," and finally to give a comparable composite score.
3. D3 trend drift marked as core
In the 7-dimensional perception matrix, the product knowledge base marks D3 trend drift as the core dimension, which deserves separate explanation. Amplitude and rate of change reflect the present and near term, whereas trend drift reflects direction on a longer time scale. Before a device goes out of limit, it often first shows a slow mean shift; looking only at instantaneous values, this process is not noticed. Setting trend drift as core moves the focus of early warning forward: rather than alarming after the limit is exceeded, it begins accumulating judgement evidence while the data is still in the normal range. D7 time-series risk score, as the composite decision value, also needs the input of trend information. D3 and D7 therefore cooperate in function: D3 provides the core evidence of "whether it is drifting," and D7 outputs a composite conclusion of 0 to 100. This article cites only the dimension definitions and core marking listed by the knowledge base and does not unfold the decision algorithm of trend drift.
4. 6-level alarm and alarm metadata
The conclusions of perception and scoring are output through the alarm system. The product knowledge base records that the Qianzhi engine uses a 6-level alarm system: normal (85 to 100 points), Watch (70 to 84 points), YJ1 (55 to 69 points), YJ2 (40 to 54 points), BJ1 (20 to 39 points, handled within 48 hours), BJ2 (0 to 19 points, immediate shutdown). From normal to immediate shutdown, handling urgency rises level by level as the score falls. The knowledge base also records that each alarm carries a standard clause reference, four-dimensional impact tags (safety, efficiency, lifetime and carbon, each scored 0 to 100), confidence and a scenario tag. The four metadata have distinct roles: the standard clause reference states the interpretive basis, the four-dimensional impact tags state where the alarm has impact, confidence states the certainty of the conclusion, and the scenario tag states under what operating condition the alarm occurred. Outputting these metadata together with the alarm level gives the alarm interpretability, not just a score or a sound. This article cites only the level ranges and metadata categories listed by the knowledge base.
5. Wanxiang four-dimensional impact assessment and dynamic weights
After Qianzhi analysis, the study stage also gives judgement at the impact level. The product knowledge base records that the Wanxiang engine's four-dimensional impact assessment covers safety, efficiency, lifetime and carbon, with base weights of safety 0.30, efficiency 0.30, lifetime 0.20 and carbon 0.20, the four summing to 1. The weights are not fixed: the assessment supports industry dynamic weights, with a safety weight of 0.50 in hospital scenarios, an efficiency weight of 0.40 in factory scenarios and a carbon weight of 0.35 under carbon assessment. The same event may therefore rank impact differently across industries—hospitals value safety more, factories efficiency, and users under carbon assessment carbon. Dynamic weights tie the assessment conclusion to the scenario. This article cites only the base weights and dynamic weight values listed by the knowledge base and derives no scoring result from them.
6. Qianzhi analysis in the Taiyi seven-level pipeline
The product knowledge base records that the seven-level pipeline of the Taiyi intelligent control hub system is L1 access, L2 cleaning, L3 standard verification (safety red-line pre-position), L4 Qianzhi analysis, L5 Wanxiang study, L6 fusion decision and L7 persistence. L4 Qianzhi analysis runs 50 sub-models in parallel at about 800 milliseconds per round; L5 Wanxiang study takes the analysis result and studies it; L6 fusion decision weights the results of Qianzhi and Wanxiang to form a composite health score; and L7 completes persistence. On performance, the knowledge base records that the whole pipeline's end-to-end latency is less than 2 seconds and the data access success rate is 99.9%. Placing L4's single-round time and the end-to-end latency together shows the significance of the parallel architecture: only by running 50 sub-models in parallel can the analysis complete in a short time and feed into the subsequent stages. These values are listed by the product knowledge base; this article does not infer any site's actual latency or success rate.
Scope and limitations
First, this article restates only what the product knowledge base lists, with the factual boundary limited to the Qianzhi engine's core architecture of 50 parameter sub-models with 20 currently delivered core sub-models (M01 to M20) times 7-dimensional perception, the 7-dimensional perception matrix D1 to D7 definitions and the D3 core marking, D7's 0 to 100 composite decision specification, the 6-level alarm system and the standard clause reference and four-dimensional impact tags with confidence and scenario tag carried by alarms, the Wanxiang engine's four-dimensional impact assessment base weights and industry dynamic weights, and the L4 50-sub-model parallelism and about 800 milliseconds with L5, L6 and L7 and end-to-end under 2 seconds and 99.9% access success rate in the Taiyi intelligent control hub system's seven-level pipeline.
Second, this article does not unfold unlisted sub-model names, the specific algorithm of the perception dimensions, the calculation of L6 weighted fusion or the internal details of the four-dimensional scoring specification.
Third, the 50 parameter sub-models are the planning specification listed by the product knowledge base, currently delivered as 20 core sub-models; this article does not equate the planned number with the delivered number, nor infer a subsequent schedule.
Fourth, the end-to-end under 2 seconds, L4's single-round about 800 milliseconds, the 99.9% access success rate, and the four-dimensional impact assessment and alarm score ranges are product knowledge base specifications; this article does not extend them to a guarantee for any scenario.
Fifth, this article constitutes no commitment to the deployment effect, health-score or early-warning accuracy of a specific project; actual capability is subject to the latest product material and project solution.