 微物联研究院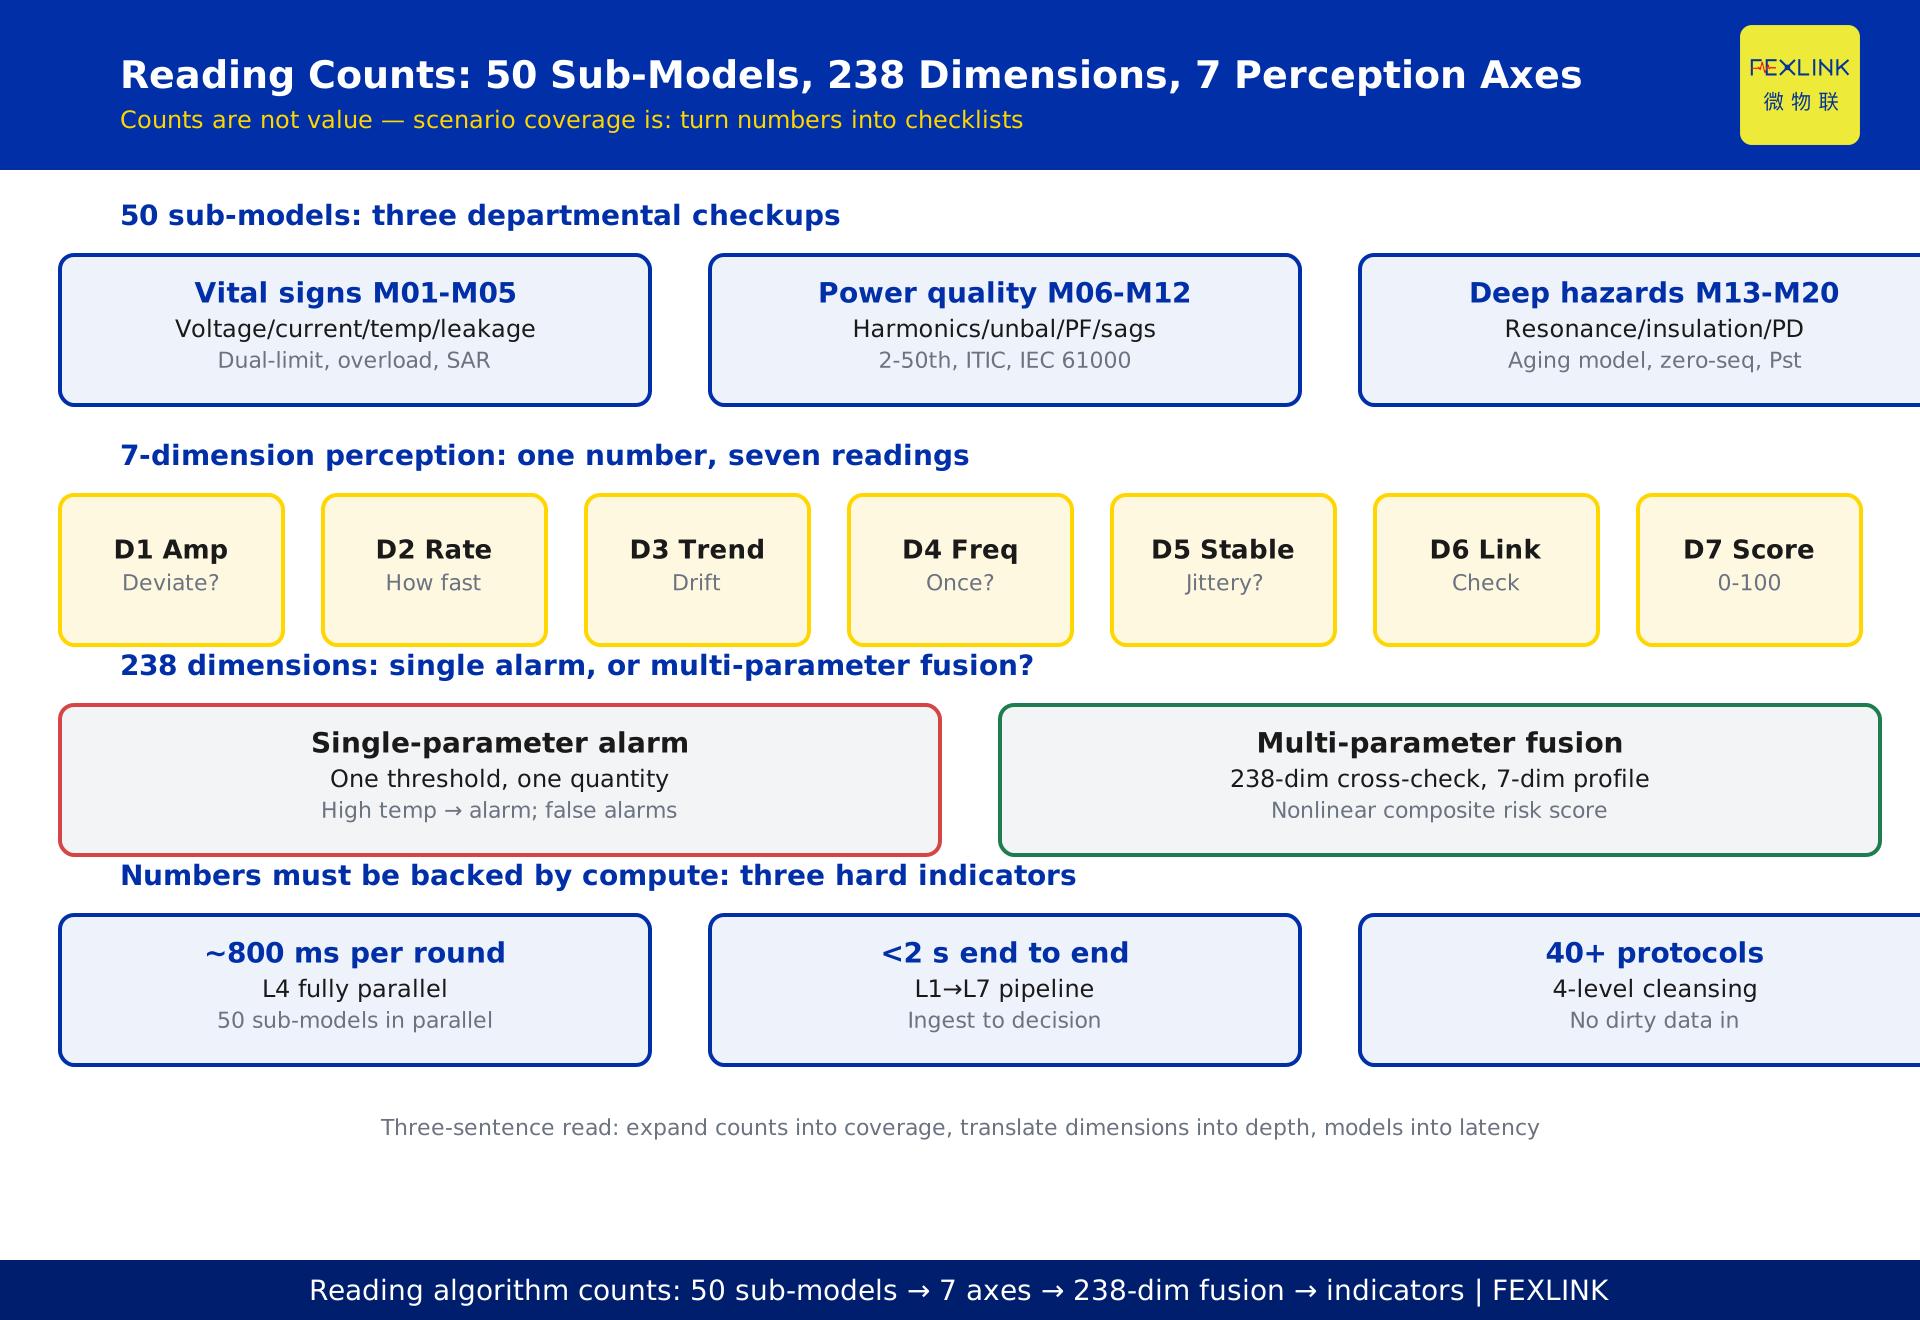
# 50 Sub-Models, 238 Parameters, 7 Perception Dimensions: How to Read Algorithm and Feature Counts
Direct Answer
Counts like "how many algorithms, how many feature dimensions" are not value in themselves; the real value is which abnormal scenarios those counts cover. In the FEXLINK Taiyi system: the Qianzhi engine comprises 50 parameter sub-models (currently 20 core M01–M20) across a 7-dimension perception matrix; the integrated hazard analysis model supports 238-dimension electrical parameter evaluation; the Tianyan engine plans 67 prediction models. The right way to read these numbers: first see which anomaly each model addresses, then check whether those anomalies cover your scenario — rather than comparing who has the bigger number.
For project owners and pre-sales engineers, this article provides a practical evaluation method: first, translate "algorithm count" into an anomaly-scenario coverage checklist; second, translate "feature dimensions" into judgment depth; third, use single-round latency and end-to-end delay to verify that real compute backs the numbers. All figures in this article come from the FEXLINK product knowledge base.
Why "More Algorithms" Does Not Equal "Broader Coverage"
Numbers impress most easily: 35 algorithms, 500 feature dimensions, it sounds professional. But electrical hazard diagnosis is not an algorithm-count contest — it is a scenario-coverage contest.
- Leakage, overvoltage, harmonics, temperature, grounding… each anomaly type has different physical mechanisms and needs different judgment logic;
- If a system has 50 algorithms but 40 of them do "voltage limit" alone, it is strong at voltage anomalies yet may be blind to harmonic resonance;
- Conversely, fewer algorithms that cover the main anomaly surface — voltage, current, temperature, leakage, grounding, harmonics, sags, unbalance — carry higher substance.
So the first step of evaluation is always: expand the numbers into a checklist and see which anomaly each model maps to. Among Qianzhi's 50 sub-models, M01–M05 handle basic vital signs (voltage/current/temperature/leakage/grounding), M06–M12 handle power quality (harmonics/unbalance/power factor/sags/flicker/interharmonics), M13–M20 handle deep hazards (resonance/insulation/vibration/PD/zero-sequence/negative-sequence/flicker synthesis). That "departmental checkup" structure is the substance behind the numbers.
50 Sub-Models: From "Monitoring" to "Departmental Checkup"
Qianzhi's 50 parameter sub-models make the difference between "one doctor examining the whole body" and "a panel of specialists consulting together":
- Basic vital signs (M01–M05): voltage via dual-limit symmetric algorithm, current via overload factor, temperature with location-aware correction, leakage via time-series trend plus SAR pre-check, grounding identifying TN/TT/IT systems — the "five vital signs";
- Power-quality checkup (M06–M12): harmonics (2–50th plus THD), voltage unbalance, current unbalance (sequence components), power factor, voltage sags (ITIC/SEMI F47), voltage fluctuation (IEC 61000-4-15), interharmonics;
- Deep-hazard mining (M13–M20): resonance risk, insulation state (aging model), vibration analysis, partial discharge, zero-sequence current, negative-sequence components, harmonic intermodulation, flicker synthesis (Pst/Plt).
The key to reading it: 50 is the planned capacity; the current 20 core (M01–M20) are the departmental checkups actually running. Ask "which sub-models are actually enabled on my line and what anomalies they cover" — far more useful than memorizing "50."
238-Dimension Evaluation: Why So Many Dimensions
The integrated hazard model supports 238-dimension electrical parameter evaluation. The first reaction is often "more dimensions means more accuracy," but think the other way:
- One electrical hazard often shows multiple symptoms: insulation degradation appears simultaneously as rising leakage, rising temperature, and increased harmonic intermodulation;
- Viewing any single dimension can misjudge (a high temperature may be ambient heat); cross-dimension correlation locks the root cause;
- 238 dimensions is not "measure everything measurable" but "synthesize multi-dimension evidence into one composite risk value via a nonlinear risk function (sigmoid_plus)."
So "238 dimensions" really answers: does this system do single-parameter alarm or multi-parameter fused judgment? Only the latter has the foundation for "few false alarms, accurate location." FEXLINK's four-dimension impact assessment (safety 0.30/efficiency 0.30/life 0.20/carbon 0.20, dynamically weighted by scenario) embodies multi-dimension synthesis in decision-making.
7-Dimension Perception: A Judgment Framework, Not Parameter Stacking
Qianzhi uses a 7-dimension perception matrix to profile each parameter: D1 magnitude, D2 rate of change, D3 trend drift (core), D4 anomaly density, D5 fluctuation amplitude, D6 correlation verification, D7 time-series risk score (0–100 composite decision).
These 7 dimensions answer 7 judgment questions:
- Magnitude: how far is it deviating now?
- Rate of change: how fast is it changing?
- Trend drift: is it slowly moving in the wrong direction (what CUSUM-type methods watch)?
- Anomaly density: once by chance or recurring?
- Fluctuation amplitude: stable or jittering?
- Correlation verification: do other parameters show simultaneous anomalies (excluding false alarms)?
- Time-series risk score: what is the composite risk?
The value of 7 dimensions is "one number, seven readings." 65 °C is merely "high" on the magnitude axis; adding trend drift and location awareness determines whether it is "increasing contact resistance" or "normal load fluctuation." That is the essential difference between a judgment framework and parameter stacking.
67 Prediction Models: From "Judging the Present" to "Foreseeing the Future"
The Tianyan engine plans 67 prediction models (V2.0, in four sections — S safety, Q power quality, E energy use, C conservation — plus special topics):
- S Safety analysis (20): S-01 resistive leakage separation, S-02 residual-current trend drift (CUSUM, 4–12 weeks ahead), S-05 three-phase unbalance hazards;
- Q Power quality (15): Q-01 harmonic responsibility (IEEE 1459), Q-02 voltage deviation;
- E Energy analysis (15): E-01 NILM non-intrusive load decomposition, E-06 very-short-term load forecasting (XGBoost/LightGBM, MAPE <3%);
- C Conservation (10): C-01 reactive compensation optimization;
- Special topics (17): HV switchgear health, transformer life, storage SOH, EV-charger load forecasting.
Prediction models read differently: they answer not "what is wrong now" but "how much longer can it hold, when to act, which window to maintain." 67 is the planning figure; delivery is phased (V1 selects 8–12, V1.5 expands to 20+, V2 approaches full) — ask "which prediction models are actually online in the current version," not "recite 67."
Numbers Must Be Backed by Compute
Numbers that cannot run are meaningless. Verify with three hard indicators:
- Single-round analysis latency: Qianzhi single-round analysis ≈800 ms (L4 layer), fully parallel;
- End-to-end latency: Taiyi's seven-stage pipeline under 2 seconds end to end (L1 ingestion → L2 cleansing → L3 SAR pre-check → L4 Qianzhi → L5 Wanxiang → L6 fused decision → L7 persistence);
- Ingestion and cleansing: 40+ protocol access, four-level cleansing — without this, every downstream model consumes dirty data.
These three show that "many models" is not paper configuration: 800 ms per round plus 2 s end to end means the 50 sub-models really run in parallel rather than queuing idle.
Three-Sentence Reading Method: Turning Numbers into Decisions
When evaluating any "algorithm/feature count" proposal, remember three sentences:
- Expand counts into checklists: which anomaly does each algorithm address, and is the coverage sensible?
- Translate dimensions into depth: multi-parameter fused judgment (238-dimension correlation, 7-dimension profiling) or single-parameter alarm?
- Translate models into latency: how many milliseconds per round, how many seconds end to end? Numbers without compute are decoration.
With this method, you will find the value of "50 sub-models + 238 dimensions + 7 perception dimensions + 67 prediction models" lies not in the numbers themselves but in the complete anomaly spectrum they cover — vital signs to power quality to deep hazards to future prediction. That is what you are paying for.
Ten: How to Explain These Numbers to Non-Technical Decision Makers
When explaining to management, do not pile up parameters; say three things:
- Capability has a boundary: the meaning of the model count and dimensions is "covering a fuller range of hazard types," not "the more precise the reporting, the more models";
- Speed is the experience: a single analysis round of about 800 ms and an end-to-end result within 2 seconds means "after an on-site anomaly occurs, the conclusion is available almost in real time";
- Protocol breadth is the integration cost: 40+ protocols mean "existing devices most likely do not need to be replaced — they connect as they are," which directly maps to deployment cost. Explaining 800 milliseconds is worth more than explaining 238 dimensions, because latency is felt by operators every day while dimension counts are felt only during configuration.
Translate numbers into business value, and decision makers listen. If a slide deck is needed, keep it to three numbers — response time, protocol count, and hazard coverage — and let the vendor's implementation team handle the rest. Numbers only matter when someone can act on them.
Scope and Limitations
Reading page for KD-0016. The algorithm and feature figures (Qianzhi 50 sub-models, current 20 core M01–M20, 7-dimension perception matrix D1–D7, 238-dimension electrical parameter evaluation, Tianyan 67 prediction models planned, single-round analysis ≈800 ms, end-to-end under 2 seconds, 40+ protocol access) come from the FEXLINK product knowledge base (AI model family and integrated hazard analysis) as product-documentation conventions; Tianyan's 67 is the V2.0 planning figure with phased delivery, and the latest version and datasheet prevail. The "35 embedded algorithms, 500+ features, 200–500 raw signal groups" mentioned in the topic stage do not appear in the knowledge base and are not used here; this article uses the knowledge-base figures instead. The "coverage-scenario" reading method is this article's synthesis for project evaluation and is not a judgment on any competitor. Actual algorithm configuration and coverage checklists for a specific project should follow the supplier's formal technical proposal.