 微物联研究院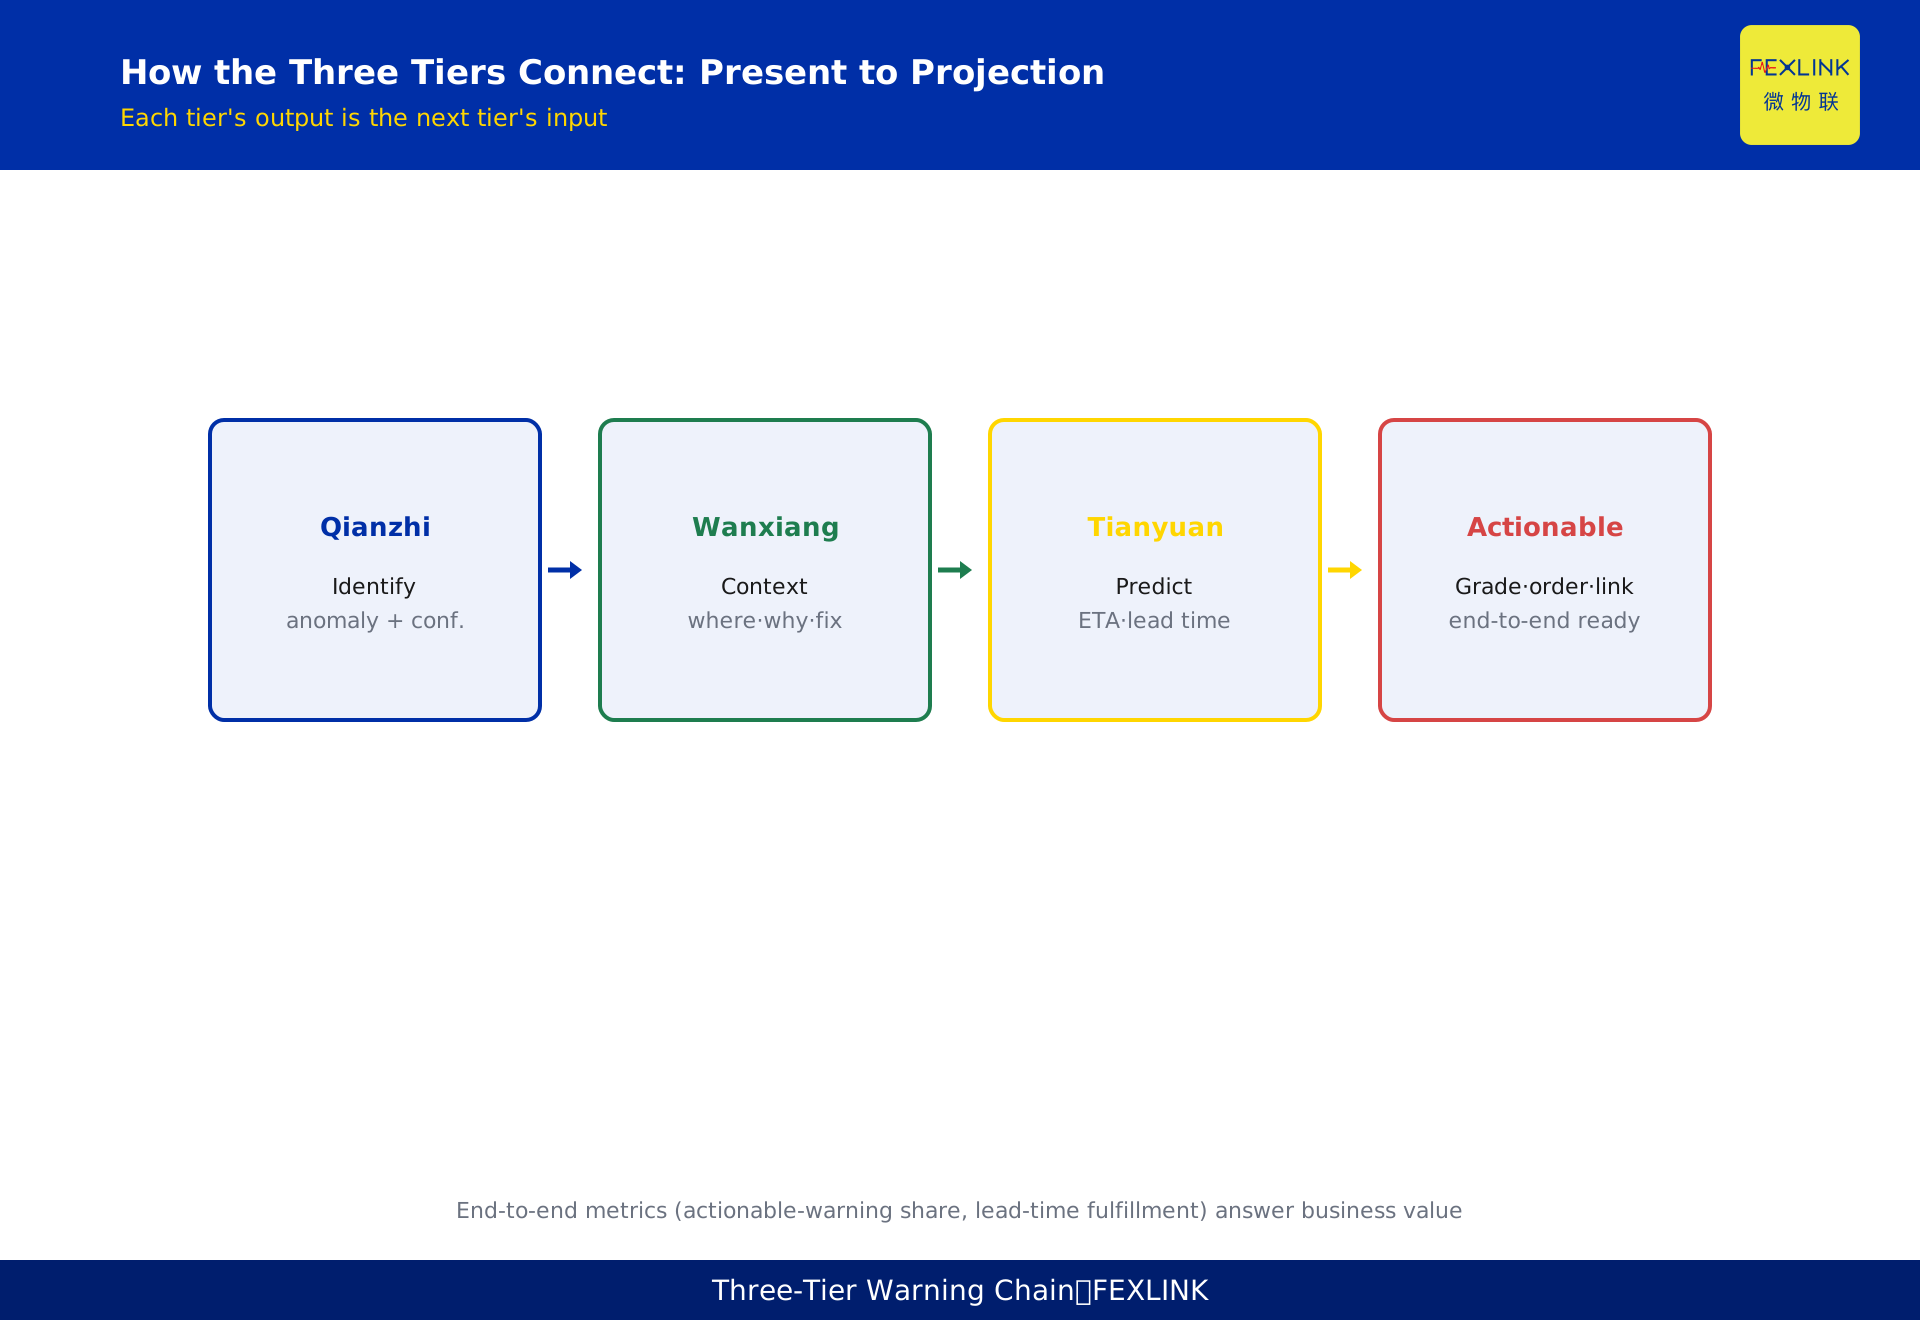
Direct Answer
Building an AI-based electrical hazard early-warning system does not mean deploying "one big AI model" that ingests data and emits alarms. The problem must be split across three cooperating engine tiers: the Qianzhi engine identifies (what parameter is abnormal), the Wanxiang engine contextualizes (why and where the abnormality exists), and the Tianyuan engine predicts (when a problem will occur in the future). The three tiers progress from identify → contextualize → predict, each tier's output feeding the next as input, forming a complete warning chain from current state to future projection. No single model can serve all three tiers well, because their inputs, logic, and outputs are fundamentally different. The build order matters as well: first identification, then contextualization, then prediction, validating each tier before layering the next.
1. Why "One AI" Fails at Electrical Hazard Warning
When companies talk about "adopting AI early warning," they usually assume a single model: data goes in, alarms come out. But electrical hazard warning contains at least three fundamentally different problems:
- "What parameter is abnormal?" — voltage fluctuation, current harmonics, leakage-current rise, temperature climb: this is a parameter-level *identification* problem, answering "this signal has deviated from normal patterns";
- "Why and where is it abnormal?" — the same elevated temperature has completely different causes, locations, and responses depending on whether it is a busbar connection point heating up or a circuit overload: this is a scenario-level *contextualization* problem requiring equipment registry, operating conditions, and related parameters;
- "When will a problem occur?" — extrapolating the current trend, will this circuit exceed its limit in nine days? This is a time-dimension *prediction* problem requiring historical data accumulation and trend modeling.
When all three problems are compressed into one model, the typical result is that the model works passably at identification, is unreliable at contextualization (it does not know where the equipment is or what conditions it runs under), and cannot predict at all (it has no dedicated temporal-extrapolation structure). Each problem has its own inputs, features, and outputs; forcing them together makes every tier shallow. This is precisely why the FEXLINK AI architecture uses the three-tier Qianzhi–Wanxiang–Tianyuan split.
A concrete example shows the three-tier difference: a temperature series on one outgoing circuit keeps climbing. The identification tier only needs to answer "the temperature deviates from this device's normal baseline" — it does not need to know where the circuit is or what load it carries. The contextualization tier must then consult the registry and answer "this is the busbar connection point on outgoing circuit 3 of distribution room 2, suspected increased contact resistance; leakage current on the same panel is normal and load is stable" — location, cause, and corroborating evidence, none dispensable. The prediction tier goes one step further: "at the current climb rate of 0.8 °C/day, the limit will be exceeded in about nine days; schedule an infrared re-check within three days." The same temperature signal, three different questions answered by three tiers; missing any tier breaks the decision chain.
2. The Three Tiers at a Glance: Inputs, Capabilities, and Outputs
The division of labor across the three tiers can be summarized as identify–contextualize–predict:
- Qianzhi (identification): input is a cleaned multi-parameter time series; capability is 50 sub-models detecting parameter-level anomalies — voltage fluctuation beyond limits, harmonic overage, sustained leakage-current rise, abnormal temperature rise rate; output is an anomaly determination with confidence for "parameter X is abnormal";
- Wanxiang (contextualization): input is Qianzhi's anomaly output plus the equipment registry, location, scenario, and related parameters; capability is 18 scenario-rule levels plus 49 correlation rules judging why and where the abnormality is — distinguishing connection-point heating from circuit overload, single-phase fluctuation from system resonance; output is an assessment conclusion with location, cause, and recommendation;
- Tianyuan (prediction): input is clean historical data and assessment conclusions; capability is 67 prediction models performing trend extrapolation and remaining-life estimation; output is "when a problem will occur" with lead time.
The relationship between tiers is progressive: Qianzhi says "temperature is climbing," Wanxiang adds "it is busbar connection-point heating; recommend an early temperature check," and Tianyuan projects "at the current trend, the limit is exceeded in about nine days; schedule maintenance within three days." No single tier is complete on its own; connected, they form the full warning chain.
3. The Identification Tier: Qianzhi — First Answer "What Is Abnormal"
Identification is the entry point of the entire warning chain and must be fast and accurate, because every upper tier depends on its output. Qianzhi's identification capability is built on per-parameter feature models: for each parameter type — voltage, current, temperature, leakage current — it establishes a statistical baseline of normal patterns and uses sub-models to detect deviations.
Key design points for the identification tier:
- One model per parameter, not one model for all parameters: the features of voltage fluctuation and the trends of leakage current are completely different; modeling them separately lets each specialize. This is the structural logic behind Qianzhi's 50 sub-models;
- Baseline first: identification models must first ingest normal data from the device's early operation (typically seven or more days) to establish a personalized baseline, rather than applying industry averages — the same device model under different load levels has completely different normal fluctuation ranges;
- Output confidence: identification does not just say "normal/abnormal"; it outputs anomaly confidence for the upper tiers to combine with context, and as input to alarm grading;
- Anti-false-alarm design: a single instantaneous parameter overshoot does not trigger an alarm immediately; it is validated with persistence and repetition checks over a short window to separate spike-type fluctuations from genuine degradation — this is why multi-dimensional judgment beats single-threshold single-parameter rules (see KD-0025).
In engineering practice, several quantities make the identification tier measurable: the baseline window usually takes seven or more days of normal data after commissioning, modeled separately for working days and rest days so that "weekend low load" is not misjudged as an anomaly; the sliding-window step is typically minute-level sampling with minute-level sliding, balancing response speed and computation cost; and features include not just mean and extremes but second-order characteristics such as rate of change and fluctuation variance — a normal temperature mean with a sudden variance spike is itself a degradation signal worth attention. These details determine robustness in the field: for the same "temperature elevated" determination, a crudely modeled system false-alarms frequently in high-load-variation environments, while a carefully modeled system separates "normal fluctuation" from "real climb."
4. The Contextualization Tier: Wanxiang — Answer "Why and Where"
Identification tells you something is abnormal, but "abnormal" is not "actionable." The value of the contextualization tier is interpreting parameter-level anomalies within the device and scenario context.
Wanxiang's contextualization logic has two kinds of rules:
- Scenario rules: organized by object type, installation location, and operating conditions — the same "temperature high" signal means different things at a main busbar, a cable joint, or a transformer winding; the same "harmonic overage" signal has different causes on a circuit with a VFD versus a pure lighting circuit;
- Correlation rules: viewing multiple parameters together — voltage fluctuation accompanied by harmonic rise points to harmonic-source load; leakage-current rise accompanied by temperature climb points to insulation degradation; any single parameter can mislead, and correlation reveals the true cause.
The contextualization output must be actionable: not just "busbar temperature is high," but "suspected increased contact resistance at the connection point; recommend infrared thermometry re-check and maintenance within two hours" — a conclusion with location, cause, and action. This tier directly determines whether operators trust and adopt the warning: if the AI only says "temperature abnormal" without saying where and why, operators will eventually treat it as crying wolf.
The data foundation of contextualization is the equipment registry and scenario model: which circuits have VFDs, which cabinets dissipate heat poorly, which measurement points sit in high-load zones. An incomplete registry makes contextualization a castle in the air — which is exactly why this tier follows identification and requires on-site information governance.
A complete contextualization output sample makes "actionable" concrete: in an industrial park, power-busbar temperature runs high. Wanxiang consults the registry and concludes "suspected increased contact resistance at busbar connection point 3; the same circuit's three-phase currents are balanced and load at 72% is within the normal range, ruling out overload; leakage current is normal, ruling out insulation degradation," with the recommendation "schedule an infrared thermometry re-check of the connection point; if the temperature difference exceeds 5 °C, plan a power-off maintenance." Location, cause, corroboration, and action — four elements complete. Operators can dispatch a work order directly instead of consulting registries and guessing causes themselves. This is the essential difference between the contextualization tier and an ordinary "parameter anomaly alarm": the latter tells you it is broken; the former tells you what broke, why, and what to do.
5. The Prediction Tier: Tianyuan — Answer "When a Problem Will Occur"
The prediction tier upgrades the warning from "a problem now" to "a problem coming," and is the key to proactive prevention. Tianyuan's prediction models do two kinds of work:
- Trend extrapolation: fitting change rates on historical time series and projecting the time to exceed limits — "temperature climbs 0.8 °C/day and will exceed the limit in about nine days";
- Remaining-life estimation: modeling degradation curves of critical equipment to estimate remaining usable time and provide maintenance windows — "at the current degradation rate, this breaker's operating mechanism has about six months of life left."
Two preconditions for the prediction tier:
- Historical data accumulation: trend extrapolation needs a sufficiently long, clean historical series — generally at least 90 days of continuous data, with stability improving as data lengthens; when data is insufficient, a conservative model with a shorter lead time beats an overconfident promise;
- Continuous calibration: predictions must be back-tested against what actually happened — the model says the limit is exceeded in nine days; is it actually exceeded nine days later? Periodic recalibration keeps extrapolation accuracy stable.
Two technical routes are worth understanding: statistical extrapolation (e.g., CUSUM cumulative-sum detection and linear or piecewise trend fitting) excels at slow-climbing degradation — temperature and leakage current have small, stable change rates, where statistical extrapolation performs well on lead time; time-series models (e.g., autoregressive structures over periodic load) excel at periodic-plus-trend patterns — production load has daily and weekly periodicity, and only after stripping periodicity can the trend be extrapolated without being misled by normal fluctuation. Both routes depend on "clean history": gaps, jumps, and unit errors in the data enter the extrapolation directly. This is why the prediction tier demands the highest data quality of the three — prediction errors come from the past, and dirty past data makes future predictions untrustworthy.
6. How the Three Tiers Connect: the Full Warning Chain
The three tiers are not three independent alarm sources but a pipeline: identification output → contextualization input; contextualization output → prediction input. A typical warning chain:
- Qianzhi detects a sustained microamp-level leakage rise on the leakage-current series (identification);
- Wanxiang combines object location and related parameters to conclude "suspected cable insulation degradation on outgoing circuit 3 of distribution room 2" (contextualization);
- Tianyuan extrapolates over 90 days of history and projects "the limit will be exceeded in about 14 days; arrange insulation testing within one week" (prediction).
The chain also has an engineering meaning: each tier's output provides verification feedback to the tier before it. Whether the "14-day limit breach" actually happens lets you back-check whether identification and contextualization were right; contextualization's cause judgment can guide identification to adjust that scenario's baseline. The three tiers calibrate each other, and the warning chain becomes more accurate over time — this is the essential difference between a "system" and "three isolated models."
7. Mapping the Three Tiers to Alarm Grades
The warning chain ultimately lands in alarm grading, with each tier contributing grading evidence:
- Ignore (green): identification detects instantaneous spike-type fluctuation; contextualization and prediction both find no risk — logged as a record, no interruption;
- Watch (yellow): identification shows persistent anomaly; contextualization gives a possible cause with medium confidence — placed on an observation list with a deadline for re-check;
- Handle (orange): contextualization confirms cause and location; prediction projects limit breach within 3–7 days — scheduled into maintenance planning with a named owner;
- Act now (red): multi-parameter joint anomaly with steep trend; prediction lead time under 24 hours — dispatch immediately, and trigger local protective action when appropriate.
Grading translates the AI's "judgment" into the operator's "action level": not all anomalies are equally important, and not every alarm should wake someone at night. Grading draws simultaneously on identification (anomaly confidence), contextualization (cause clarity), and prediction (time urgency) — no tier is dispensable.
8. Build Order and Cadence
The three tiers must be built in order, and the order cannot be skipped:
- Build identification first: connect the clean data stream, establish baselines, and pass detection-rate and false-alarm-rate acceptance — typically visible results in 2–4 weeks;
- Then build contextualization: organize the equipment registry and scenario rules, connecting identification output to scenario context — requires on-site information governance, 4–8 weeks;
- Build prediction last: start trend extrapolation after accumulating 90+ days of history, calibrating progressively — stable operation after about three months.
Each step builds on the previous tier's data and rules: without identification's anomaly determinations, contextualization has no input; without contextualization's location and cause, prediction extrapolation loses much of its meaning. Building in this order puts every tier "on a validated foundation"; conversely, buying a prediction model first means discovering there is no clean identification output to feed it and no scenario information to use — the model merely spins idle.
In FEXLINK deployments, the carrier is the Taiyi smart-control hub (hosting the scheduling and actuation of the three-tier engines) together with the electrical hazard detection and early-warning system (the user-facing warning presentation and work-order loop). The key point: engines are capability; the system is engineering — no matter how strong the models, data, registry, rules, and processes must organize them into a chain to produce sustained warning value.
9. How to Validate the System: Tier-Specific Metrics
Once the three tiers are built, validation should not ask only "is it accurate"; each tier has its own metric because each answers a different question:
- Identification: detection rate and false-alarm rate — replay known fault samples and measure anomaly detection rate (target 95% or higher) and false-alarm rate (down to an operator-acceptable level). Validate the false-alarm rate in real load-fluctuation scenarios, not on ideal datasets, or the system will be embarrassed by normal fluctuations after go-live;
- Contextualization: cause-hit rate and conclusion usability — on confirmed-fault samples, measure whether location is correct, cause judgment hits, and recommended actions are executable. This tier should not pursue "list every possibility" but "every statement holds up" — better fewer and accurate than many and wrong;
- Prediction: lead-time fulfillment rate — when the model says "limit breached in nine days," record the actual breach time and measure how often predicted lead times are fulfilled. Lead-time fulfillment directly determines operator trust in prediction and is the core metric of this tier.
The three metrics are independent yet interlocking: a high identification false-alarm rate drags down contextualization's cause-hit rate; unusable contextualization conclusions diminish the meaning of prediction extrapolation. Validation should therefore be "tier by tier, viewed as a chain" — each tier passes its own test, then the end-to-end chain effect is measured. End-to-end metrics (such as the share of actionable warnings and lead-time fulfillment) are the final answer to business value.
10. Common Pitfalls and How to Avoid Them
- Pitfall 1: treating the three tiers as three vendors. If the engines come from three suppliers with inconsistent data conventions, connecting them becomes splicing and the warning chain breaks everywhere. The system must ensure all three tiers share one data convention and rule language;
- Pitfall 2: skipping identification and going straight to prediction. A prediction model over dirty data without baselines only outputs "refined errors"; solving identification first gives prediction reliable input;
- Pitfall 3: writing contextualization rules once and never updating them. Site conditions change — new VFDs, load adjustments, equipment aging — and scenario rules must track the registry; put rule maintenance into the operations workflow instead of one-time configuration;
- Pitfall 4: warnings not landing in actions. No matter how accurate the three tiers are, if warnings do not enter work orders, maintenance, and review loops, value stops at "a nice dashboard." The loop is the last mile of a warning system (see KD-0030).
Scope and Limitations
The three-tier Qianzhi–Wanxiang–Tianyuan collaboration framework described on this page is a framework for designing AI-based electrical hazard early-warning systems, for planning and selection reference, and does not constitute a project implementation plan. The capability descriptions (Qianzhi's 50 sub-models, Wanxiang's 18 scenario-rule levels plus 49 correlation rules, Tianyuan's 67 prediction models) come from the FEXLINK product knowledge base as product-documentation conventions. Figures such as "95% detection rate," "90 days of data," "0.8 °C/day," and "14-day limit breach" are methodological illustrations; actual metrics depend on data quality, site conditions, and historical accumulation and must be determined by project measurement. Example scenarios (an industrial park, a factory, an airport) are anonymized illustrations and do not refer to any specific customer. Actual implementation should be determined by qualified professional teams through on-site assessment.