 FEXLINK Research Institute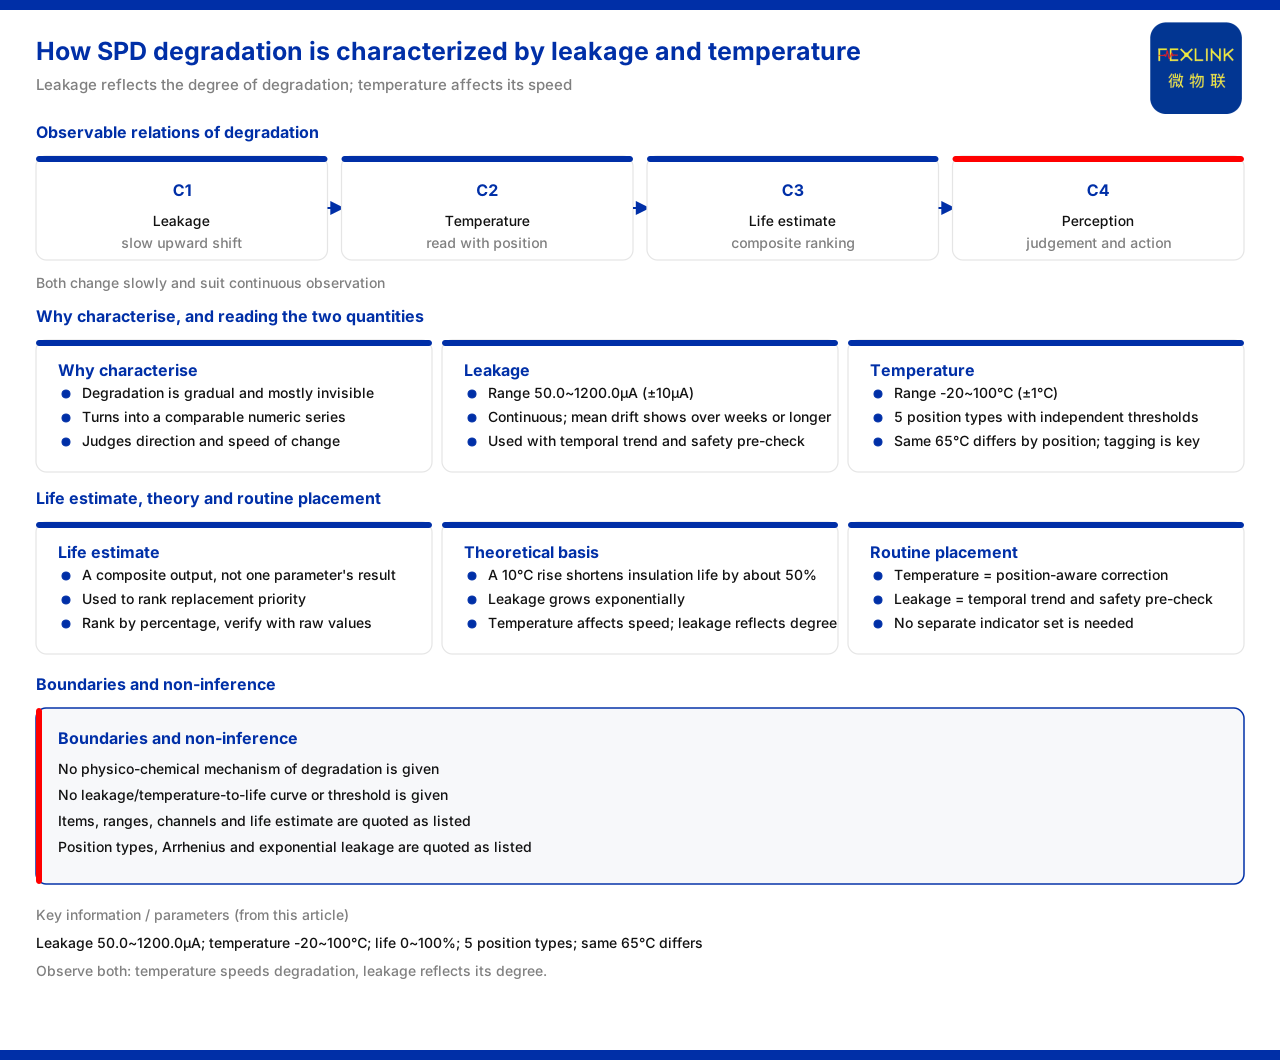
Direct Answer
The degradation process of an SPD can be characterised by two state quantities, leakage current and temperature. The product knowledge base records that the surge protective device monitor monitors leakage current 50.0 to 1200.0μA (±10μA) and temperature -20 to 100°C (±1°C), and provides a life estimate of 0 to 100%; the all-parameter lightning-protection monitoring terminal contains 1 or 3 leakage-current channels, 2 temperature channels and 1 life estimate. Leakage current reflects the degree of leakage of the component under continuous voltage, and temperature reflects the heating state of the component and its connections; both change slowly with degradation and are therefore suitable as a continuous observation window. It should be noted that the product knowledge base gives no explanation of the physical and chemical mechanism of SPD degradation and no conversion curve from leakage current or temperature to life, so this article only explains the observable relations and does not infer a specific mechanism or conversion.
1. Why Degradation Needs to Be Characterised
An SPD does not "perform" in the normal state; its degradation is gradual and most of the time has no visible sign. Without observable state quantities, operation and maintenance can only rely on periodic testing or after-the-fact discovery, neither of which can answer "which stage of degradation it is currently in". To characterise is to turn this slow change into a comparable series of values, so that operations can judge the direction and speed of the change. Leakage current and temperature were chosen as the main objects of observation because they are directly related to the internal state of the component and the state of the connections, and can be collected continuously. Without these two quantities, degradation can only be described qualitatively and cannot enter trend judgement and disposal arrangements.
2. Leakage Current Rises Slowly with Degradation
The leakage-current range given by the product knowledge base is 50.0 to 1200.0μA, with an error range of ±10μA. Leakage current comes from the leakage of the protective component under continuous operating voltage, and as the component ages the leakage level usually moves up slowly. The value of taking leakage current as a long-term observation object is that its change is continuous: no difference may be visible in a short period, but over a window of weeks or longer the drift of the mean can emerge. In its state-monitoring and prediction capability, the product knowledge base combines the time-series trend of leakage with a safety front-end, showing that leakage current both takes part in trend judgement and is given priority attention when it touches the bottom line. The observability of leakage current gives "which step degradation has reached" a recordable scale.
3. Temperature Must Be Interpreted with Position
Temperature is the second key quantity, with a range of -20 to 100°C and an error range of ±1°C. Unlike leakage current, temperature cannot be read from its value alone. The product knowledge base records that location-aware perception maintains independent thresholds and risk models for five electrical topology position types; the same 65°C carries different risk levels at different positions such as a transformer winding, a main busbar, an outgoing terminal and a cable sheath. This design shows that temperature must be interpreted together with the installation position: at a well-cooled part it may be normal, while at a connection it may indicate poor contact. The effectiveness of temperature characterisation therefore depends not only on sensor accuracy but also on whether the point tagging is correct. If the position is wrong, even an accurate reading yields a wrong conclusion. This also explains a common phenomenon: the same temperature rise is ignored in one project but triggers an alarm in another, and the difference is often not the device but whether the point has been correctly assigned to its position type.
4. The Life Estimate Combines Several Quantities into One Indicator
The product knowledge base provides a life estimate of 0 to 100% for the surge protective device monitor, and the all-parameter lightning-protection monitoring terminal also contains a life estimate. The role of this indicator is to combine scattered signals such as leakage current and temperature into a percentage convenient for ranking, used to judge replacement priority. Its advantage is being intuitive, but when using it one should be clear that it is a composite output, not a direct result of a single parameter. The product knowledge base does not explain the weights making up the percentage, nor give a method for deriving it from leakage current or temperature. The life estimate should therefore be observed together with the raw quantities: the percentage is used for ranking, and leakage current and temperature are used to confirm whether the change is real and which point drives it.
5. Understanding the Relation from the Theoretical Basis
The reason leakage current and temperature can characterise degradation has a citable theoretical basis. The product knowledge base records that the theoretical basis of its prediction capability includes the Arrhenius equation, that is, a 10°C temperature rise shortens insulation life by about 50%, as well as the exponential growth pattern of leakage. These two respectively show that a temperature rise accelerates insulation ageing, and that leakage rises exponentially with degradation. Put together, they explain why temperature and leakage current should be observed at the same time: temperature affects the speed of degradation, and leakage current reflects the degree of degradation. Precisely because the relation is non-linear, early changes are very small, but once the acceleration stage is entered the values change quickly, which further shows that continuous observation is more valuable than a single measurement.
6. They Sit Within Parameter-Level Perception
Leakage current and temperature are not special quantities set for the SPD alone but routine items within the parameter-level perception system. The product knowledge base records that the temperature item among the basic vital signs uses position-aware correction, and the leakage item uses a time-series trend with a safety front-end. This shows that the two quantities already have a clear position in routine perception: temperature focuses on "where and how hot", while leakage focuses on "how it changes over time and whether it touches the bottom line". Understanding the SPD's leakage current and temperature within this framework shows that they serve both normal trend observation and limit interception. This also means that characterising degradation does not require building a separate set of indicators; it is enough to continue interpreting the existing perception items in the context of the SPD. Characterising degradation is precisely the combination of these two uses. In other words, leakage current and temperature are not indicators temporarily added for life judgement but two items that should already be watched continuously in routine perception, only given a clearer reading in the context of SPD degradation.
Scope of Application and Limitations
First, this article only explains how leakage current and temperature are used to characterise SPD degradation; the factual boundary is the product knowledge base, and no standard clauses, parameters, certifications or cases not listed there are introduced.
Second, the product knowledge base gives no explanation of the physical and chemical mechanism of SPD degradation, and no conversion curve or threshold from leakage current or temperature to life; this article only explains the observable relations and does not infer a mechanism or conversion relation.
Third, the monitored parameters, ranges, channel counts and life-estimate basis of the surge protective device monitor and the all-parameter lightning-protection monitoring terminal are cited from the source.
Fourth, the five position types of location-aware perception and the statement that the same temperature carries different risk at different positions, as well as the Arrhenius equation and the exponential leakage-growth pattern, are cited from the source.
Fifth, the degradation decision thresholds, observation periods and replacement arrangements of a specific project must be verified against site data quality and point tagging; this article provides no modelling, parameter setting or life calculation.