 FEXLINK Research Institute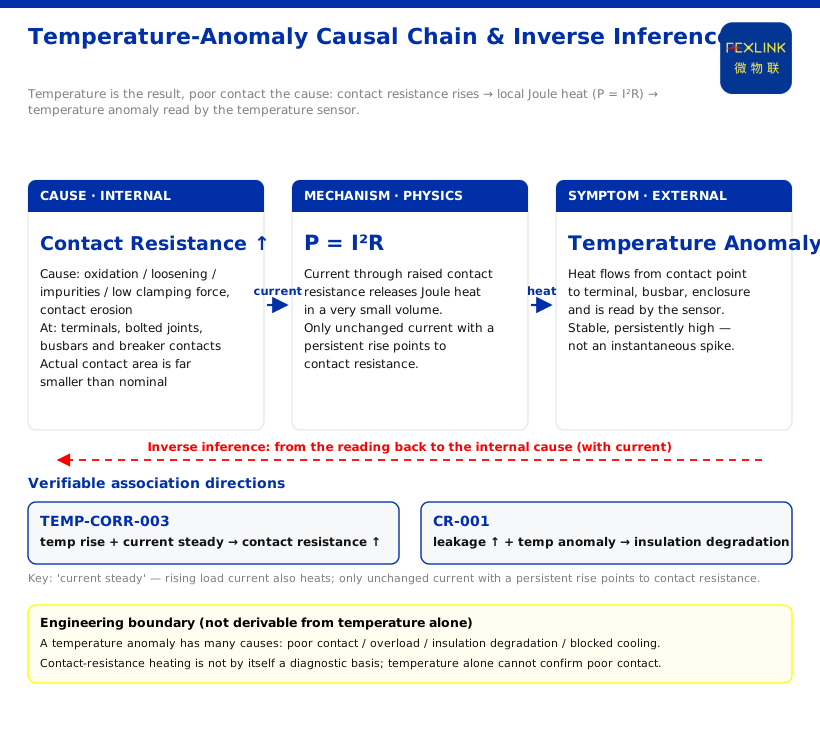
A temperature reading flagged as an "anomaly" is often not a problem with the temperature itself but a sign that current has met an unwanted resistance at a connection point. Once contact resistance rises through oxidation, loosening, insufficient pressure or contact erosion, the Joule heat (P = I²R) produced as current passes is released in a very small volume, then conducts along the conductor and into the air until a temperature sensor on a terminal, busbar or enclosure reads it. A temperature anomaly is therefore often the visible symptom of poor contact, not a separate fault class beside it. This article answers that causal chain: why the reading is the result and poor contact the cause, how to read it out with verifiable quantities, and what must not be inferred. What the knowledge base does give are the Wanxiang engine's association rules and product parameters.
1. First Clarify "Who Is Heating": Temperature Is the Result, Contact Resistance the Cause
An ideal conductor has very low resistance and heats little. The real risk concentrates at connection points: terminals, bolted compression joints, busbar overlap faces and circuit-breaker contacts. Their actual contact area is far smaller than nominal; once oxidation, impurities, insufficient clamping force or erosion appear, contact resistance rises. The same current meeting a larger resistance produces more heat at that point. This is why temperature is seen first — heat is the most direct physical output of poor contact.
The knowledge base's Wanxiang engine writes this as a checkable rule: within the TEMP-CORR series, the rule states "temperature rise + unchanged current → increased contact resistance". The key is "unchanged current": a rising load current also heats conductors, which is not anomalous; only when current has not risen yet temperature keeps climbing is contact resistance the more likely internal cause. Judging by temperature alone misleads; the rule only matters when temperature is read with current.
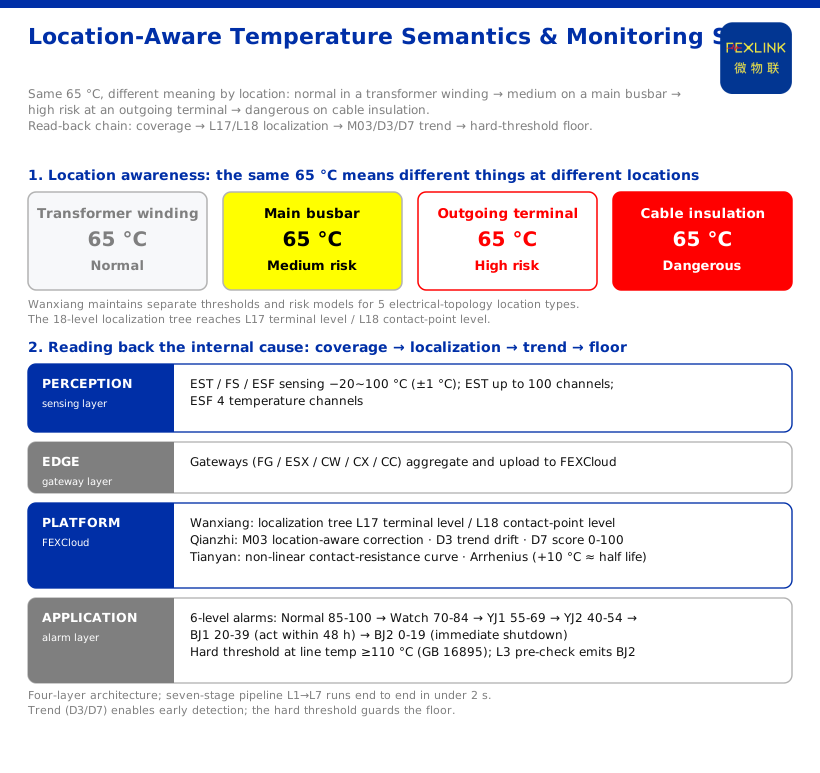
Location also determines meaning. Wanxiang's Location-Aware capability gives an intuitive contrast: the same 65 °C is normal in a transformer winding, medium risk on a main busbar, high risk at an outgoing terminal and dangerous on cable insulation. The same number is an alarm at a contact point but may be normal operation inside a winding. A temperature anomaly is thus not an absolute-value judgement but a combined one: which location, on what trend, with what current.
2. The Temperature Signature of Poor Contact: Why It Looks Like a Temperature Problem but Is Not One
Heat from poor contact is a local source. It diffuses from the contact point into the conductors on both sides and into the environment, producing a stable, sustainably elevated rise rather than an instantaneous spike — more a slowly climbing or persistently high curve than a step. That is why it is easily mistaken for ambient heat or "summer has arrived."
Treating it as purely thermal misses the other half. First, a temperature anomaly can also indicate insulation degradation, overload or blocked heat dissipation; it is not exclusive to poor contact. Second, the high temperature at the contact itself accelerates ageing of nearby insulation. The knowledge base's CR series gives one cross-direction: the CR-series rule, "leakage ↑ + temperature anomaly → combined insulation degradation". A temperature anomaly often appears with other quantities, so the system should perform correlation validation rather than alarm on each over-limit number. D6 correlation validation is one dimension of the Qianzhi engine's seven-dimensional perception matrix.
3. Reading the "Visible Symptom" Back to the "Internal Cause": Verifiable Quantities and Products
Since temperature is the visible symptom, reading it out means inferring the internal cause. The knowledge base provides verifiable measurement capability.
Temperature range and accuracy: the EST multi-channel temperature controller's wired NTC and wireless active sensing are both -20~100 °C (±1 °C), with wireless LoRa, up to 100 channels, a configurable 1-min sampling period and a working distance of no more than 300 m; the FS surge protective device monitor offers a -20~100 °C (±1 °C) channel; the ESF electrical-fire controller's NTC sensing is -20~100 °C (±1 °C) with a 1 m external lead. These ranges cover the common working band of contacts inside distribution cabinets, and ±1 °C is enough to separate normal fluctuation from persistent drift.
Poor-contact points are distributed across busbars, terminals and contacts, and one cabinet may hold several suspects. The EST's up to 100 wireless channels are made for exactly this dispersed placement; the ESF's built-in four channels suit combining a few critical contacts with residual-current monitoring in one device.
Locating the point: Wanxiang's 18-level scenario localization tree reaches L17 terminal level and L18 contact-point level. This matters — only when an anomaly attaches to a specific terminal does it move from "somewhere is hot" to "which contact loosened."
Location-aware correction: among Qianzhi's 20 core sub-models, temperature sub-model M03 carries "location-aware correction," while D3 trend drift and D7 time-series risk score (0-100) turn a single-point reading into a direction.
4. From Single-Point Thresholds to Trend: Why Early Detection Depends on Trend, Not Threshold
Contact resistance does not grow linearly. The knowledge base records that one theoretical basis of the Tianyan engine is the non-linear contact-resistance growth curve, alongside the Arrhenius equation (a +10 °C rise roughly halves insulation life) and an exponential leakage-growth pattern. By the time temperature approaches the hard threshold, the curve has often passed its steepest segment.
The hard threshold is guarded by red lines. The triggers at a line temperature ≥110 °C (per GB 16895), a floor that cannot be bypassed. But a floor acts only near danger; seeing a contact worsen earlier depends on D3 trend drift. The six-level alarm scheme (Normal 85-100 → Watch 70-84 → YJ1 55-69 → YJ2 40-54 → BJ1 20-39, act within 48 h → BJ2 0-19, immediate shutdown) separates urgency by time scale: the earlier the band, the more time to tighten or replace the contact before protection operates.
One amplifying effect: the Arrhenius relation says insulation life roughly halves for every ~10 °C rise. High temperature at a contact threatens not only the contact but also nearby insulation, turning a temperature anomaly from a single-point signal into a lifetime issue.
5. After Reading It: Engineering Meaning and Boundaries
Data must keep flowing upward for trend to hold. The knowledge base defines a four-layer architecture — perception, edge, platform, application; the Taiyi intelligent-control hub's seven-stage pipeline runs end to end in under 2 seconds, with L3 pre-checking red lines and emitting the highest-level alarm directly on trigger. Collection, uplink, comparison and alarm form the engineering base that translates a temperature symptom into a poor-contact judgement.
Boundaries must be clear. First, a temperature anomaly can have many causes — poor contact, overload, insulation degradation or blocked heat dissipation — and this article does not claim poor contact can be determined from temperature alone; current, leakage and visual inspection must still be combined. Third, the 238-dimension integrated model and the quantitative value indicators (such as an 80% alarm-compression ratio) are internal records and vendor self-reports; they are background only, not assertions of deterministic capability or effect. Fourth, this article does not cover the single-quantity topics of voltage, current, leakage or arc, nor does it provide sampling frequency, offline caching, work-order grading or evidence-retention implementations; only the GB 16895 number listed in the knowledge base is cited, without inferring clause content.
Conclusion
A temperature anomaly is often the visible symptom of poor contact because heat is the most direct output of contact resistance: unchanged current with sustained temperature rise points to rising connection resistance; location decides whether the same temperature is dangerous; and the downstream effect is amplified by the Arrhenius relation. To read it out, use EST/FS/ESF's -20~100 °C (±1 °C) channels and multi-channel placement, Wanxiang's L17-L18 localization to drop the anomaly onto a specific contact, Qianzhi's D3 trend drift and D7 score to move from thresholds to trend, and the four-layer architecture and seven-stage pipeline to turn data into action. Other electrical-quantity topics are left to the adjacent articles.