 FEXLINK Research Institute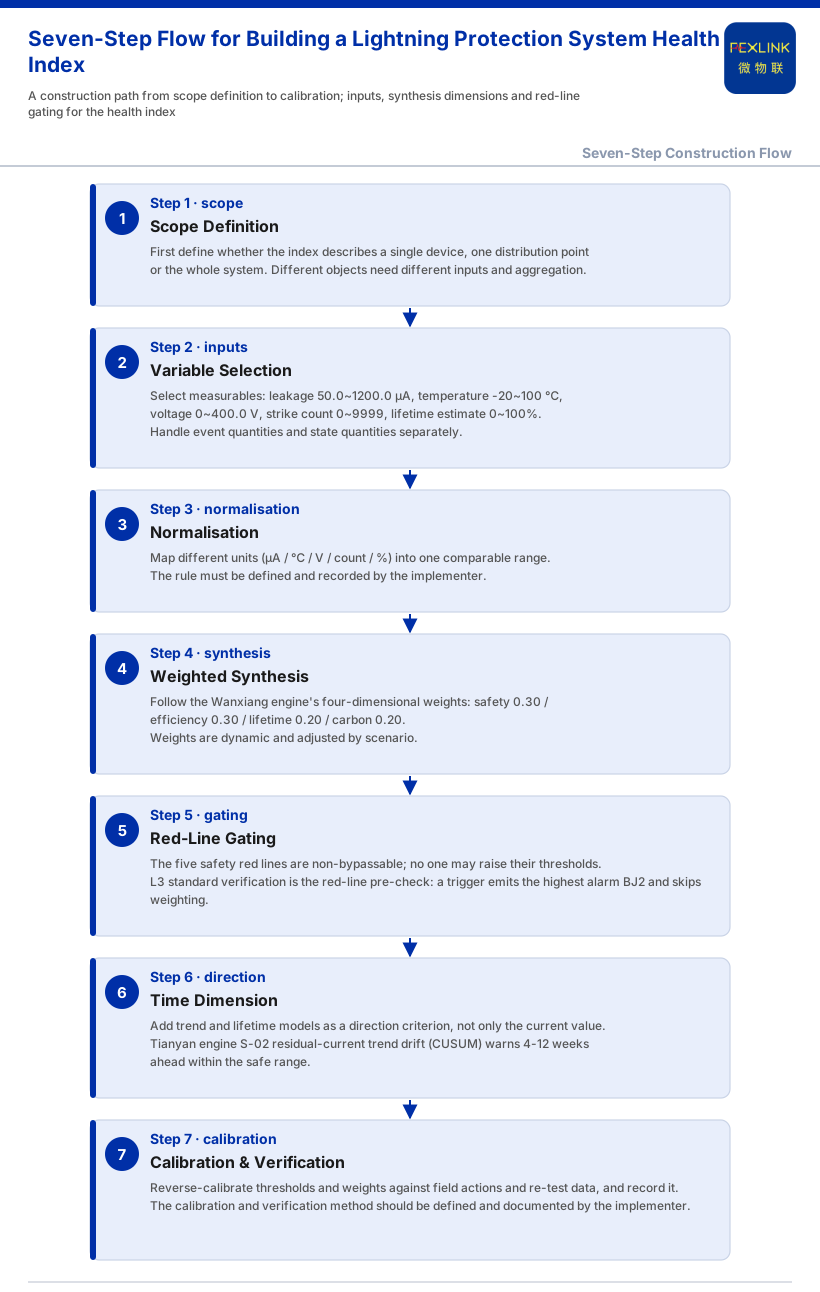
A health index for a lightning protection system combines scattered state quantities into one explainable, comparable, continuously updated composite metric, answering "is this lightning protection asset still sound, and how far is it from failure". It means solving three things: which measurable quantities to use as inputs, how to combine different units, and how to handle the safety baseline. The knowledge base offers verifiable anchors: the FS surge protective device monitor (e.g. model FS-33211-R) supplies leakage current, temperature, voltage, strike count and lifetime estimate; the L6 fusion decision of the Taiyi intelligent-control hub's seven-stage pipeline yields a "Qianzhi x Wanxiang weighted composite health degree"; and the Tianyan engine supplies trend and lifetime models.
1. What the Health Index Must Answer
First separate event from state. Strike count answers "how many events occurred", not "how much protection remains". A device can just have been struck without protection failing, or see no strikes for long while leakage rises toward degradation. The index must answer the latter — current level and future direction of state — resting on continuously collected state quantities, not a one-off conclusion.
2. Inputs: Measurable State Quantities First
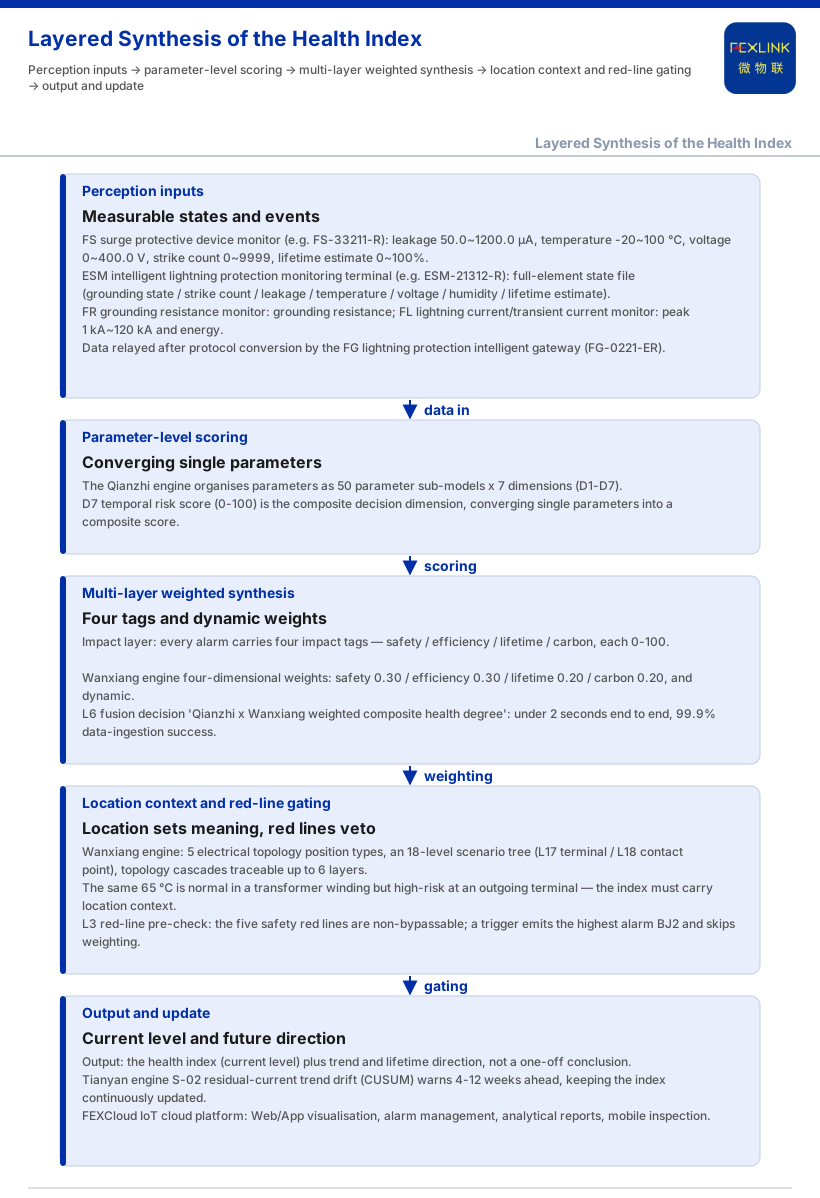
An index cannot be built from nothing; its inputs must be measurable and traceable. The knowledge base gives the FS surge protective device monitor's monitored elements: remote signalling, breaker state, grounding state, strike count, leakage current, temperature, voltage and lifetime estimate; key parameters are leakage 50.0~1200.0 μA (±10 μA), voltage 0~400.0 V (±0.1 V), temperature -20~100 ℃ (±1 ℃), strike count 0~9999 (minimum trigger 0.1 kA) and lifetime estimate 0~100%. Leakage and temperature characterise SPD degradation, and the lifetime estimate is itself a 0~100% state output.
The full-element ESM intelligent lightning protection monitoring terminal (SPD monitor, e.g. ESM-21312-R) adds grounding state, strike count, leakage, temperature, voltage, humidity and lifetime estimate, building a state file per device. The FR grounding resistance monitor supplies grounding resistance, and the FL lightning current/transient current monitor supplies peak (high range 1 kA~120 kA, plus a 0.1 kA~1 kA low-range version) and energy, relayed after protocol conversion by the FG lightning protection intelligent gateway. These form the input set.
3. Synthesis Dimensions: From Single Parameter to Weighted Composite
Synthesis follows, and the knowledge base offers ideas at two layers. At the parameter layer, the Qianzhi engine organises parameters as "50 parameter sub-models x 7 dimensions", in which D7 is the temporal risk score (0-100) composite decision dimension that converges single parameters into a composite score. At the impact layer, every alarm carries four-dimensional impact tags — safety, efficiency, lifetime and carbon, each 0-100 — dimensions that can enter synthesis.
Weighting is anchored: the Wanxiang engine's four-dimensional impact weights are safety 0.30, efficiency 0.30, lifetime 0.20 and carbon 0.20, and they are dynamic — safety rises to 0.50 in hospital scenarios, efficiency to 0.40 in factories and carbon to 0.35 under carbon assessment. The index should thus adjust with scenario, not one fixed weighting: one score means different "health" in a data centre than an ordinary workshop.
Location also matters: the Wanxiang engine's location awareness gives the example that the same 65 ℃ is normal in a transformer winding but high-risk at an outgoing terminal; it keeps separate thresholds for five electrical topology position types and locates down to L17 terminal level / L18 contact point level with an 18-level scenario tree, topology cascades traceable up to 6 layers. To be decision-usable, an index must carry location context, or the "average" masks the most dangerous point.
The most direct expression is: at L6 of the Taiyi hub's seven-stage pipeline, Qianzhi and Wanxiang are weighted into a "composite health degree", the pipeline under 2 seconds with data-ingestion success 99.9% — the mechanism closest to "health index".
4. Red-Line Gating: The Safety Baseline Must Not Be Averaged Away
The easiest failure mode is an average hiding the baseline: one device's leakage far exceeds limits while other parameters are normal, and simple weighting still returns a "pass". The knowledge base keeps the safety baseline out of the average — the five red lines are non-bypassable and no one may raise their thresholds: residual current ≥300 mA (GB 13955), abnormal open circuit of grounding resistance (GB 50057), three-phase voltage unbalance >15% (GB/T 15543), line temperature ≥110°C (GB 16895) and insulation resistance <0.5 MΩ (GB/T 16895).
Process-wise the red lines precede model computation: L3 standard verification is the red-line pre-check, and a trigger emits the highest-level alarm (BJ2) and skips all weighted computation. The red line is thus a veto gate, not a bonus item; when it triggers, the index should fail outright or be set to worst, not averaged away.
5. The Time Dimension: Trend and Lifetime
Looking only at the present makes the index a "check-up snapshot"; its real question, "how much longer can it last", needs a time dimension. The Tianyan engine is the anchor, answering "how long this device can last, when it will fail and which window to service it", on grounds including the Arrhenius equation (a +10°C rise shortens insulation life by about 50%), exponential leakage growth and the non-linear growth of contact resistance.
Its signature model S-02, residual-current trend drift (CUSUM), detects a weak mean drift while leakage is still within the safe range (for example 18 mA) and warns 4-12 weeks ahead. Tianyan V2.0 plans 61-67 models across four boards — safety, power quality, energy use and energy saving — with 17 special topics including high-voltage switchgear health, transformer lifetime, UPS assessment, energy-storage SOH and data-centre supply reliability. The time component can thus be updated by trend models, not only manual re-testing.
6. A Seven-Step Construction Method
Step one, define scope: a single device, one distribution point or the whole system.
Step two, select variables from measurable state quantities — leakage, temperature, voltage, strike count and lifetime estimate — handling events and states separately.
Step three, normalise different units (μA, ℃, V, count, %) into one comparable range; the rule is not given by the knowledge base and must be defined and recorded by the implementer.
Step four, weighted synthesis on the four-dimensional and dynamic weighting ideas, adjusted by scenario.
Step five, red-line gating, overlaying above the composite result; a trigger vetoes rather than being averaged away.
Step six, introduce the time dimension via trend and lifetime models (such as Tianyan S-02), not only the current value.
Step seven, calibrate and verify against field actions and re-test data.
7. Boundaries: What This Article Does Not Claim
Second, the knowledge base gives no formula, weights, normalisation, graded thresholds, calibration method or system-level aggregation rule, and this article invents none.
Third, the quantitative indicators in (alarm compression 80%, root-cause accuracy 85%+, scenario precision L17-L18, MTTR reduced 60%, fault location days to 2 hours, etc.) are vendor self-reports, and are not accuracy or effect promises for the index.
Fourth, other articles' landing points are not repeated: how alarm grading and ticket closure work, why they decide whether a system is truly useful, and what Qianzhi's 50 sub-models x 7 dimensions are.
Conclusion
Building the index comes down to "measurable state quantities as inputs, weighted dimensions as synthesis, safety red lines as gates, time trends as direction". Inputs come from devices such as the FS surge protective device monitor and the ESM intelligent lightning protection monitoring terminal; synthesis references L6's "Qianzhi x Wanxiang weighted composite health degree" and the four-dimensional dynamic weights; the safety baseline is vetoed by the five red lines; and the time dimension is supported by Tianyan's trend and lifetime models. Normalisation, weight calibration and calibration rules are not given by the knowledge base and belong to the implementer to define and document.