 FEXLINK Research Institute
Direct Answer
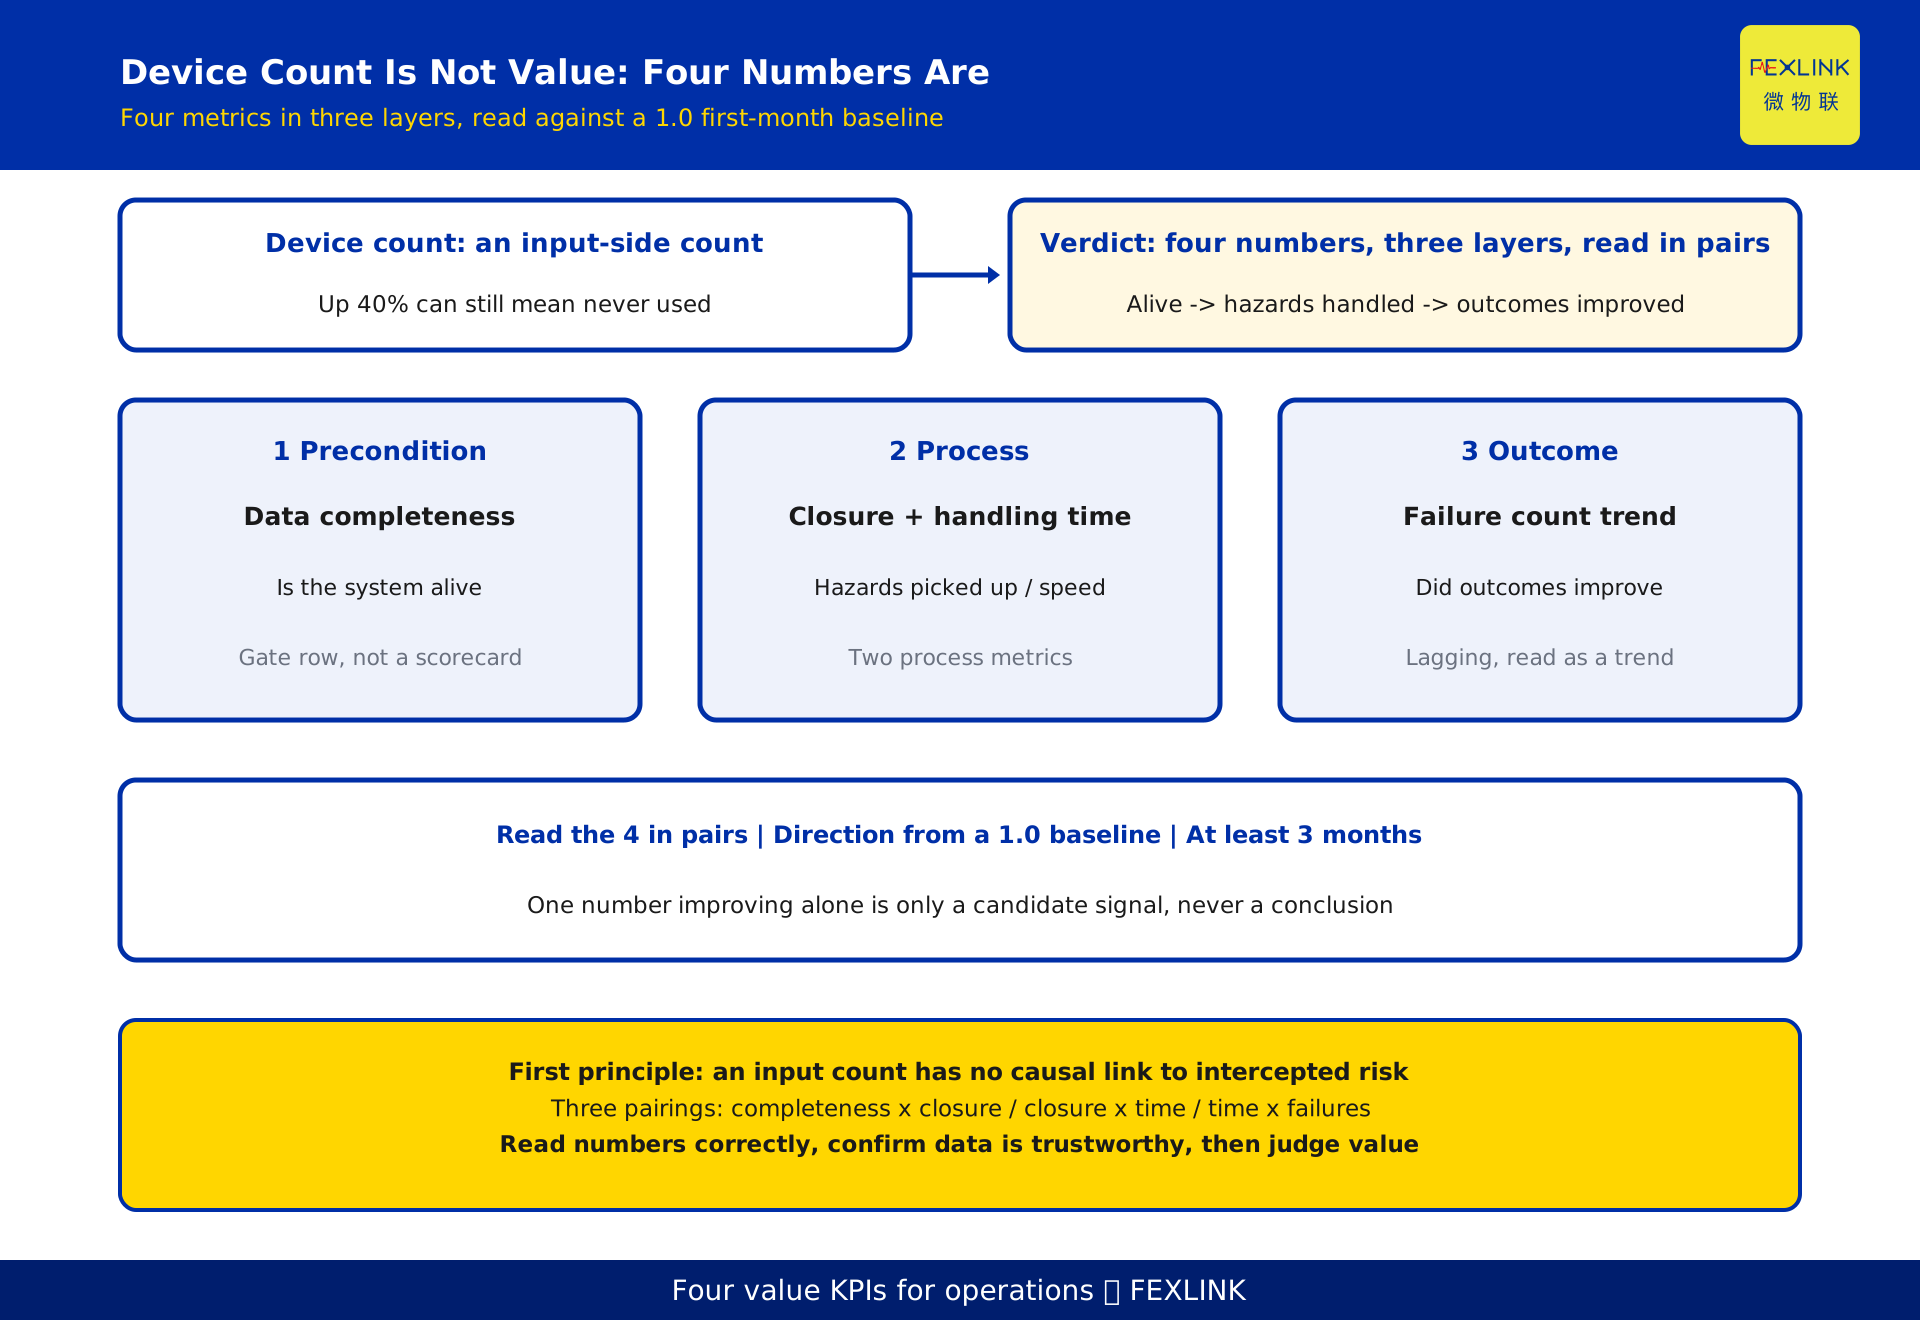
Signing the acceptance certificate is not the same as creating value. To decide whether a monitoring project is truly being used, management needs only four numbers: data completeness tells you the system is alive, alarm closure rate tells you hazards are being handled, mean handling time tells you how fast the response is, and the trend in unplanned outages and failures tells you whether outcomes improved. How many devices were connected or how many points were installed describes input scale, not output. The four numbers must be read in pairs and judged by direction against the first full operating month; improvement in any single one proves nothing. This article is about a management-level value KPI set and a monthly board, not about how to read the technical numbers on an operations report.
1. Why Device Count Is Not Value
The line most often seen in a project report is "this period we connected more devices and added more points". That is an input-side count with no causal link to intercepted risk. Growth may simply mean more hardware on the platform while alarms go unclaimed and hazards stay put.
Three illusions are common. Coverage as effect: devices are installed but thresholds and dispatch rules were never set, so alarms are pushed and nobody acts; the system only moved field signals onto a screen. Online as usable: the gateway is online and data flows, but point mapping is wrong or multipliers were not synchronised, so unusable readings still count as "having data". Activity as outcome: many alarms were handled, yet the same failures recur next month, so handling never reached the root cause.
The starting question is not "how much more" but "is there a complete chain from data to handling to outcome"; the four numbers are its observation points.
2. Four Numbers in Three Layers
The four metrics are not four parallel percentages. They form three layers from foundation to outcome.
| Layer | Metric | Question answered | Group |
|---|---|---|---|
| Layer 1 | Data completeness | Is the system alive and is data usable | Precondition |
| Layer 2 | Alarm closure rate | Are hazards being handled | Process |
| Layer 2 | Mean handling time | Is the response fast | Process |
| Layer 3 | Unplanned outage / failure trend | Did outcomes improve | Outcome |
Layer 1 is the gate: without complete data the other three lose their statistical basis. Layer 2 measures whether the organisation uses the system, Layer 3 whether that use bought a result. Miss one layer and the board proves busyness, never value. "Just look at device count" is not even Layer 1, only an input count.
3. The First Two: Data Completeness and Alarm Closure Rate
Data completeness answers "of the points that should be collected, how many actually arrived". It is a gate metric, not a scorecard: once stable it should stop being reported as continuous improvement, and when it drops, the Layer 2 and Layer 3 numbers must be questioned first. Its definition, resolution and latency reading belong to technical report interpretation; this article treats it only as the board's precondition row.
Alarm closure rate answers "of the alarms triggered, how many were genuinely resolved". The denominator is most easily massaged: delivered alarms count a successful push as closure, while triggered alarms is the correct basis. The numerator needs a boundary too: only alarms with a handling record and receipt, reviewed before closure, count; auto-recovery and one-click dismissal do not. A low rate is usually not a platform defect but unresolved ownership, missing dispatch rules and unfilled receipts.
Together they give the first test: data is usable and hazards are genuinely being picked up.
4. The Last Two: Handling Time and Failure Trend
Mean handling time answers "how long elapsed from alarm trigger to ticket closure". Fix the clock's start and end points and include cross-shift and weekend samples, otherwise short office-hour tickets flatter the average. The distribution is long-tailed, so a median plus long-tail share is steadier than a mean alone; very long tickets belong in a separate list.
The trend in unplanned outages and failures answers "did outcomes improve". It is the only outcome metric and a lagging one: actions show up first in closure rate and handling time, only later in failure counts. Read it as a continuous trend, never a single-month rise or fall. Freeze the counting basis too: what counts as unplanned, what as a failure, and whether counting is per area or per circuit. Changing it mid-stream destroys comparability.
These two separate "used often" from "used to good effect": faster handling means the process improved; fewer failures means risk was actually pushed down.
5. Pair Process Metrics With Outcome Metrics
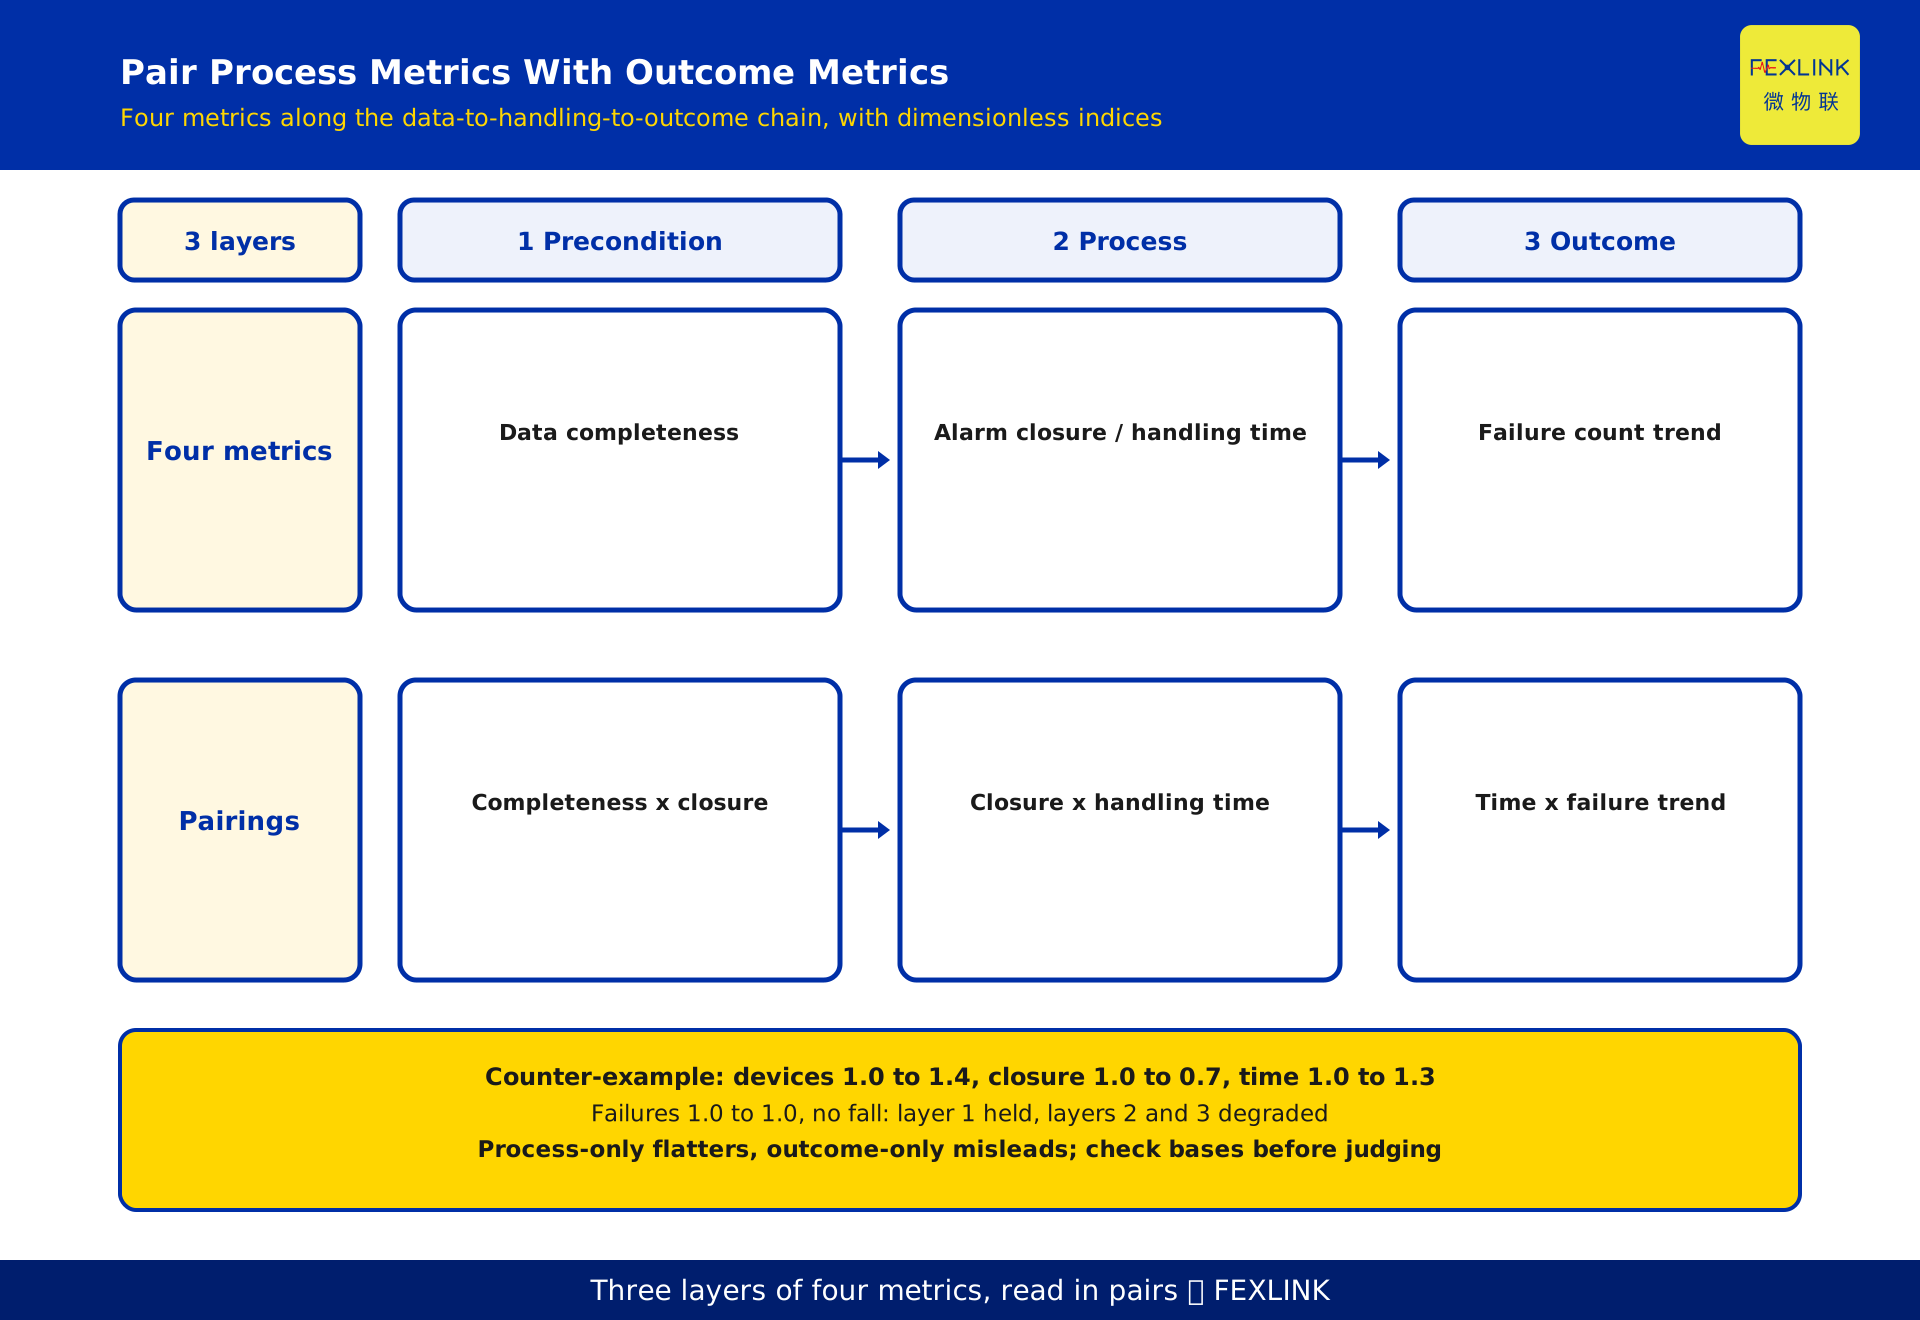
Process-only reading flatters: high closure with no fall in failures can mean loose thresholds and a large volume of low-value events, or difficult tickets parked and excluded from the denominator. Outcome-only reading misleads: fewer failures may come from degraded collection causing missed alarms, or from an already low production load.
The board needs at least three pairings: completeness with closure rate, to confirm usable data and hazards picked up; closure rate with handling time, to confirm no pile-up after pickup; handling time with failure trend, to confirm improvement points to an outcome. On any divergence, check the basis before drawing a conclusion, not before assigning blame.
That yields the one question management should always ask: did this number improve because another one got worse.
6. Health Criteria: Direction Against the First-Month Baseline
Set no universal external threshold. Point scale, equipment age, load profile and risk baseline differ widely; a common percentage only produces polished data. Use the project itself as reference: take the first full operating month as the baseline, record all four metrics as 1.0, then read month-by-month direction over three consecutive months.
Three disciplines matter more than the values. Freeze the denominator basis, log changes and mark the break point, or the trend is not comparable. Read direction, not single points: attribute one-month swings to maintenance, shutdowns or seasonal load first. Compare against your own baseline, not a peer average; benchmarking is for finding questions, not conclusions.
Calling the system "truly in use" is thus a combined condition: stable completeness, non-declining closure rate, handling time falling or flat, and a downward failure trend, all moving the same way for at least three months. Any single improvement is only a candidate signal.
7. A Counter-Example: More Devices, No Real Use
A de-identified illustration using dimensionless indices. Record the four metrics and device count as 1.0 in the first full month; three months later a project reports the following.
| Observed item | Baseline | After 3 months | Direction |
|---|---|---|---|
| Connected devices | 1.0 | 1.4 | Up |
| Data completeness | 1.0 | 1.0 | Flat |
| Alarm closure rate | 1.0 | 0.7 | Down |
| Mean handling time | 1.0 | 1.3 | Longer |
| Failure count trend | 1.0 | 1.0 | Not down |
By the input view the project "expanded by 40% with stable data" and looks reportable. By the four-metric view it reverses: falling closure means fewer hazards picked up, longer handling means tickets piling up, unchanged failures means no improvement, and device growth diluted per-person capacity. Layer 1 held while Layers 2 and 3 degraded together - "rolled out but never used".
Three root causes come first: expansion added no dispatch owners or receipt rules; relaxed thresholds surged alarm volume without more capacity; new points had not passed point-list verification and generated invalid tickets. All quantities are constructed illustrations.
8. Designing a Monthly Operations Board
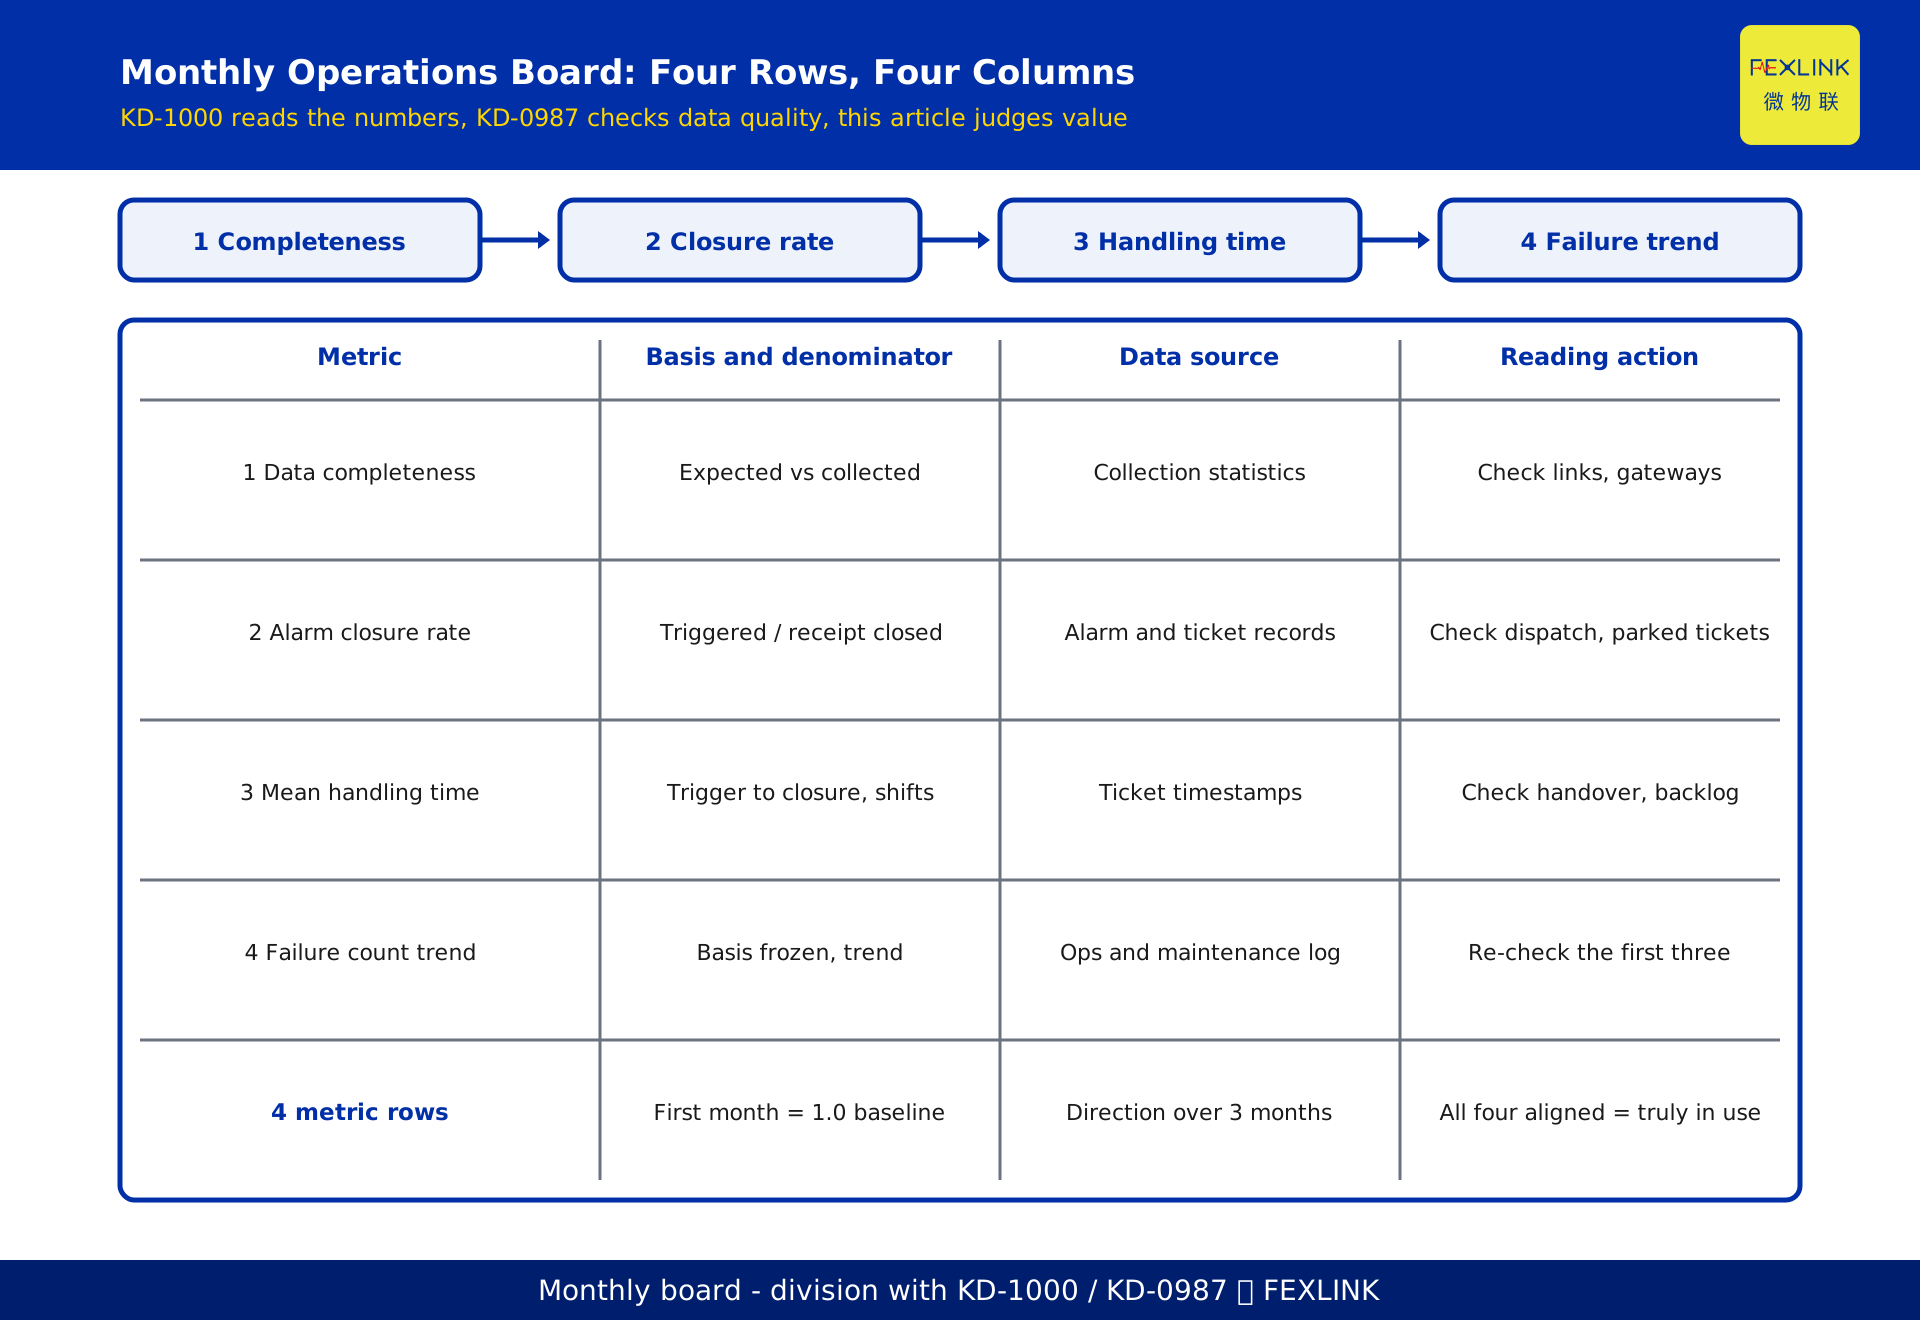
The board has four rows, one per metric, and four fixed columns: metric, basis and denominator, data source, reading action.
| Metric | Basis and denominator | Source | Reading action |
|---|---|---|---|
| Data completeness | Points collected over points expected; denominator frozen | Platform collection statistics | On a drop, check links and gateways first; pause reading the other three rows |
| Alarm closure rate | Triggered alarms as denominator; tickets with handling receipt and reviewed closure as numerator | Alarm and ticket records | On a drop, check dispatch owners, receipt rules and parked tickets |
| Mean handling time | Trigger to closure, including cross-shift and weekend; report median and long-tail share | Ticket timestamps | If longer, check shift handover and backlog; list extreme tickets |
| Failure count trend | Unplanned outages and failures, counting basis frozen, read as a trend | Operations and maintenance log | If not falling, re-check the first three bases and threshold settings |
Three disciplines: every row must trace to raw records, no conclusion-only aggregates; mark known events on abnormal months so a swing is not later called an achievement; the board is a questioning tool, not an appraisal tool, so check bases before reviewing responsibility. Once a month is enough; higher frequency turns noise into signal.
9. Division of Labour With KD-1000 and KD-0987
All three discuss operational numbers from different angles. KD-1000 is a reading guide: what completeness, collection resolution and reporting latency mean, where their health lines sit, and what a drop means; it answers "how do I read this number". KD-0987 is a technical data-quality self-check, answering "is the data trustworthy". This article stands at management level: which few numbers to track, how to combine them into a value judgement, how to land the board.
The boundary is therefore fixed at two points. This article does not repeat completeness bands or resolution and latency reading, and cites completeness only as the gate row; nor does it expand the data-quality self-check method, which belongs to KD-0987. The increment here is the outcome-side set of alarm closure rate, mean handling time and failure count trend, plus the combined criterion of pairing process with outcome. Read together, the order is: read the numbers correctly, confirm the data is trustworthy, then talk about value.
Frequently Asked Questions (FAQ)
Q: Besides the four numbers, should we add online rate and device count?
A: Put them in an appendix, not on the main board. Online rate and device count are input or technical state quantities with no direct causal link to value. Keep only the four rows that form the data-to-handling-to-outcome chain; other metrics are for drilling down when investigating anomalies.
Q: The project just went live and has no three-month trend yet. What then?
A: Set the first full operating month as baseline 1.0 and accumulate monthly; until three months are complete, report direction only, not conclusions. Use that period to verify that denominator bases and the collection chain are stable - an unfrozen basis means no trend at all.
Q: Closure rate is high but failures are not falling. Does that mean thresholds were loosened?
A: Not necessarily. Rule out three basis problems first: whether delivered rather than triggered alarms were used as the denominator, whether long-parked tickets were excluded, and whether the failure counting basis changed midway. If the bases are sound, check thresholds and alarm grading, and only then assess whether the governance actions reached root causes.
Q: Can these four numbers be used directly for departmental appraisal?
A: Not directly. They are a questioning tool for locating which link in the chain failed; bind them tightly to appraisal and the denominator and closure criteria are the first things to be polished. Appraisal should combine review conclusions and remediation records, not four numbers alone.
Q: Unplanned outages are already rare. Is a trend still readable?
A: For low-count projects, use a longer observation window together with handling records for similar events, so random variation is not read as improvement. If the count stays at zero for a long period, the metric has too little discrimination: demote it to a gate item and put the reading weight back on closure rate and handling time.
Scope and Limitations
This article applies to live electrical-safety, energy and smart-monitoring projects that already have alarm and ticket records, and helps management and operators design a monthly board and judge whether the system creates value. For pilot projects without a stable handling process, keep only the two rows for data completeness and alarm closure rate. It does not apply to a supplier's internal project organisation, nor is it a template for tender documents or contract clauses.
Limitations to note: the metric definitions, grouping, normalised-index example and board skeleton are generic illustrations representing no enterprise's appraisal criteria, staffing or compliance targets. All indices are relative quantities with no product model, parameter, price or point scale; no standard number or clause is cited, and no effect-type commitment such as energy-saving rate, accident-reduction rate or payback period is given. The layering analogy refers only to the general architecture of a digital electrical supervision system, not a selection, procurement or compliance commitment. Actual bases should be frozen by the project owner against the contract, operating procedures and local requirements.
Frequently Asked Questions
Which Few Numbers Should Management Track to Know the Monitoring System Is Truly Working?
Signing the acceptance certificate is not the same as creating value