 FEXLINK Research Institute
1. Direct Answer: Three Numbers, One Formula
A business case for the boss is not a second telling of the technical highlights. It translates "one less outage" into three numbers a decision maker can judge on the spot: what it costs, what comes back each year, and how long payback takes. There is one working formula: convert safety value into expected annual benefit with "loss per unplanned outage x annual probability x reduction rate", add the quantifiable saving in inspection labour, then rank options by payback and risk exposure rather than by technical sophistication.
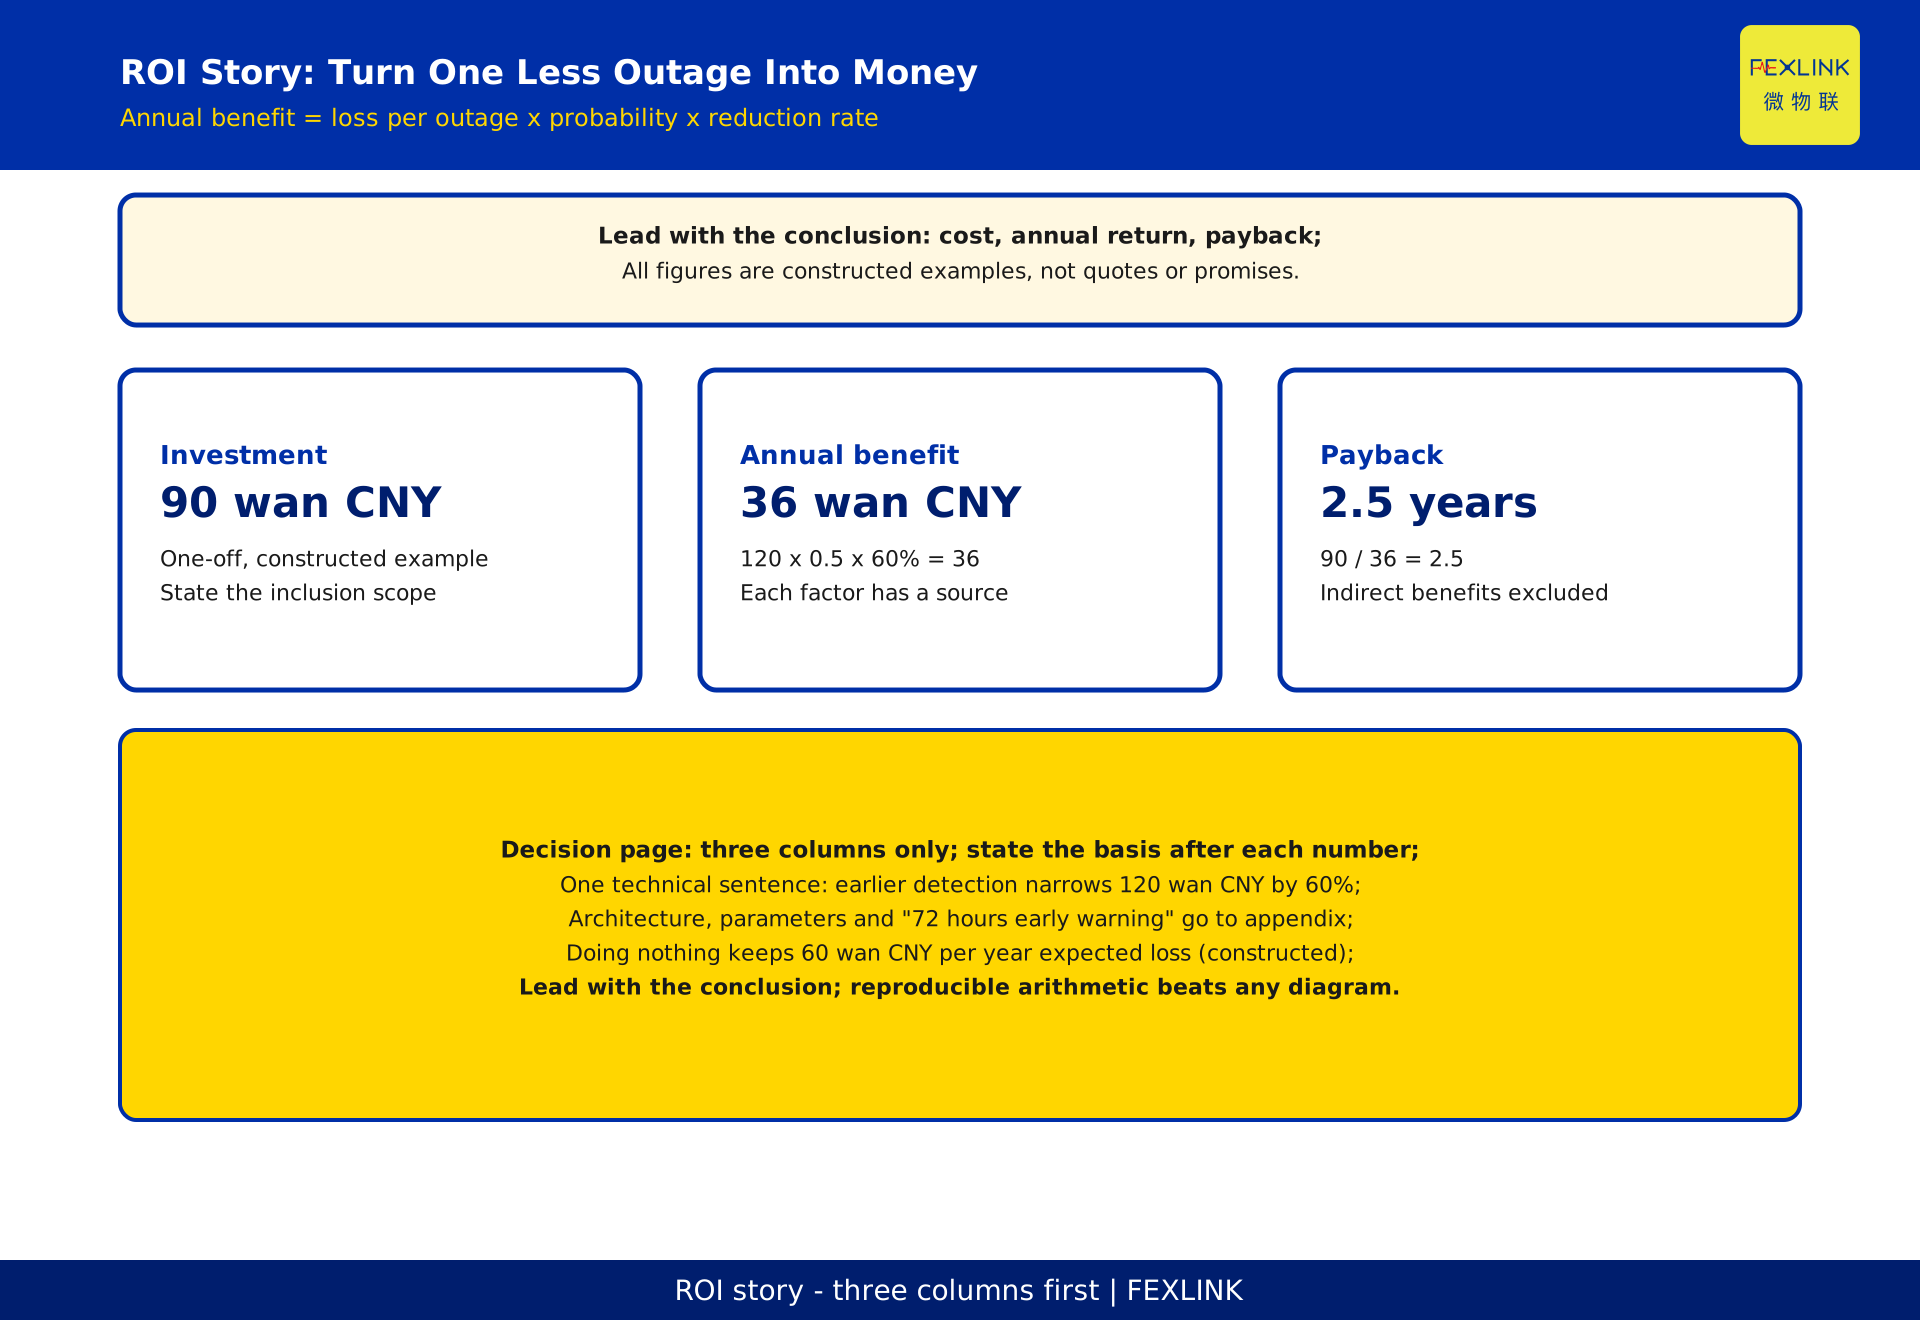
Every figure below is an illustrative constructed example. It represents no real customer and constitutes neither a quote nor a commitment. Amounts are in wan CNY, a unit of ten thousand yuan. Suppose one unplanned outage costs 120 wan CNY, annual probability is 0.5 events, and the improvement reduces that loss by 60%. Expected annual benefit is 120 x 0.5 x 60% = 36 wan CNY. With a one-off investment of 90 wan CNY, payback is 90 / 36 = 2.5 years. The decision page needs only three columns: investment 90 wan CNY / annual benefit 36 wan CNY / payback 2.5 years. Technical detail gets one sentence: "Earlier detection narrows the 120 wan CNY exposure by 60%".
What the boss decides is whether it is worth it, where the money comes from, and what happens if nothing is done. Lead with the conclusion, keep the arithmetic reproducible, and state the basis for every figure; that beats any architecture diagram. A claim such as "72 hours early warning" may appear in an appendix as a capability description, but it cannot be converted into money and must never be treated as an acceptance commitment. Putting it on page one is the most common reason such a presentation fails.
2. Why Technical Highlights Fail to Move the Signatory
Technical talk answers how the system works: sampling, models, alert chains, lead time. Decision talk answers whether the spend is worth it: losses avoided, cost removed, payback, and the risk of doing nothing. The mismatch is not a speaking problem. It is a missing unit conversion.
The approver does not deny that early warning has value. They deny that "has value" fits a budget line. A budget has no row for warning accuracy, only rows for losses, expenses, labour, depreciation and cash flow. When a presales engineer says "we can warn 72 hours ahead", the unspoken question is how much compensation those 72 hours avoid, how many lines stay up, and whether two more people are needed to act.
3. Step One: What One Unplanned Outage Actually Costs
Monetisation starts not with equipment but with what a single stop actually cost. Three categories let each be tied to a specific record instead of being waved away as "significant impact".
| Loss category | Typical components | Verifiable record | Common mistake |
|---|---|---|---|
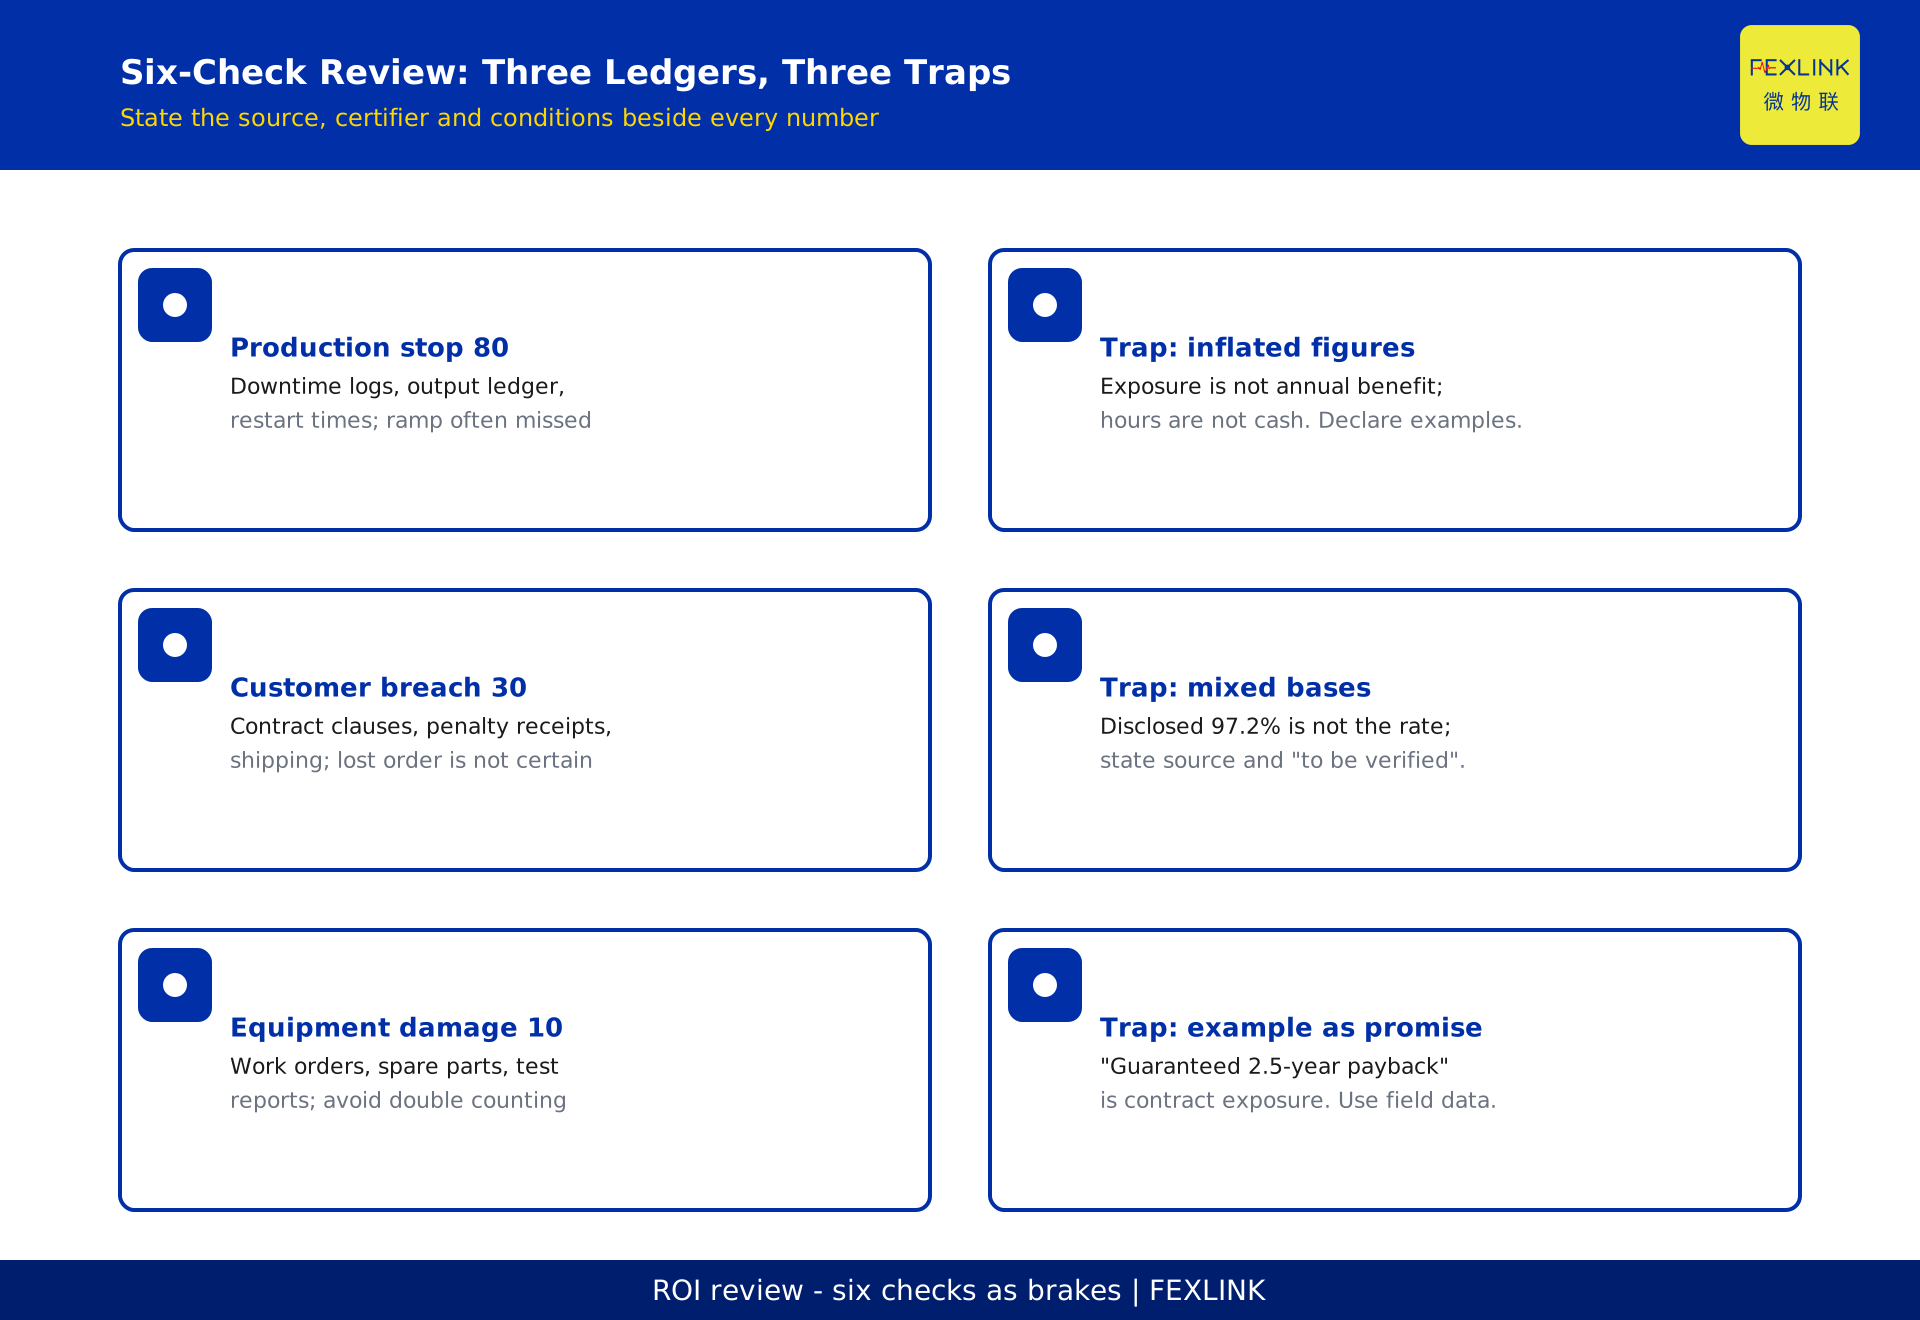
| Production stop | Lost output, restart ramp, scrapped work in progress | Downtime logs, output ledger, restart timestamps | Counting stopped hours, omitting ramp and scrap |
| Customer breach | Late penalties, expedited freight, lost orders | Contract clauses, penalty receipts, shipping records | Treating a possible lost order as certain |
| Equipment damage | Repair, testing, spare parts tied up | Work orders, part movements, test reports | Double counting against routine maintenance |
In the constructed example: production stop 80 wan CNY, customer breach 30 wan CNY, equipment damage 10 wan CNY, totalling 120 wan CNY. This is not a guess but the per-event exposure assembled from three ledgers. Listing them separately lets finance challenge each: which has a document, which rests on an interview, which needs a discount.
4. Step Two: Turn "One Less Outage" Into an Expected Value
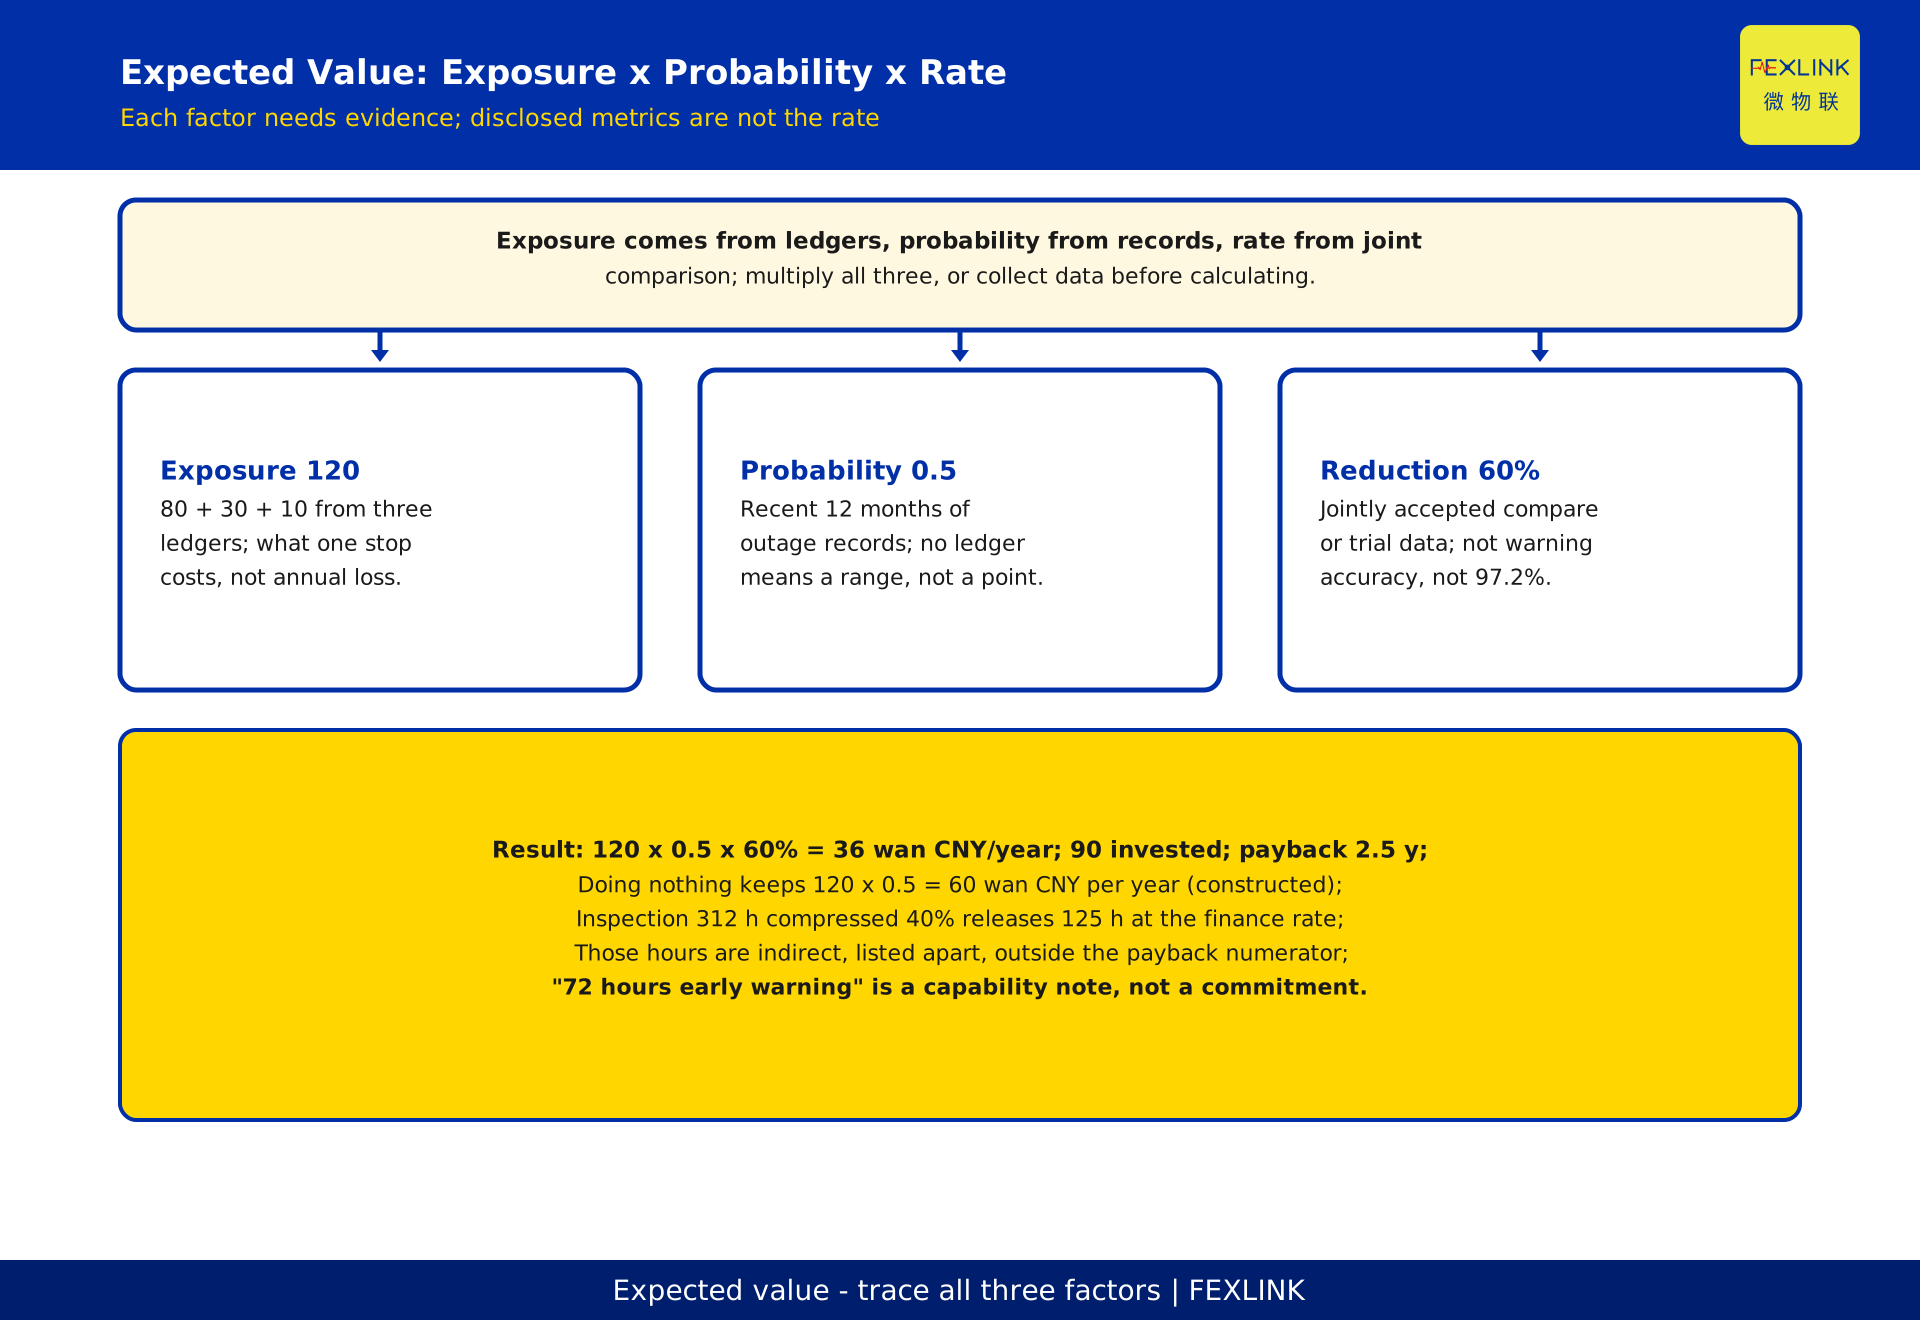
With exposure established, one line converts capability into money: expected annual benefit = per-event exposure x annual probability x reduction rate. In the constructed example, 120 wan CNY x 0.5 events x 60% = 36 wan CNY.
Each factor has its own evidence requirement. Exposure comes from the ledger sum above. Annual probability comes from outage and anomaly records over several years, ideally the most recent 12 months with the window stated; without records, give a range instead of a point estimate. The reduction rate is hardest: it describes how far losses from comparable events narrow after the change, and should rest on jointly accepted historical comparison or trial-operation data, never a supplier's unilateral declaration.
A reduction rate is not warning accuracy. The former is a financial measure of loss narrowing, the latter model performance under specific test conditions. Substituting a disclosed figure such as 97.2% for the reduction rate creates a number that looks actuarial but cannot be reproduced. Likewise "72 hours early warning" must not replace the reduction rate in the formula. Lead time describes a window; whether it narrows losses depends on someone acting inside that window and the action succeeding, which are process conditions for the notes.
Expected value also prices doing nothing: without the project, the organisation keeps carrying 120 x 0.5 = 60 wan CNY per year of expected loss, again a constructed example. Set the 90 wan CNY investment beside that, and the conversation shifts from "should we spend this" to "can 90 wan CNY narrow a 60 wan CNY exposure by 60%". The boss need not understand the model, only which factor is weakest and whether better data is needed first.
5. Step Three: Convert Inspection Labour Without a Fight With Finance
The second quantifiable benefit is inspection labour, and the item most likely to trigger an argument, because time saved is not money saved.
The correct sequence: convert current inspection workload into annual hours, agree the compressible share, then hand conversion to finance using their own composite hour rate. The technical side should never invent a labour rate. Constructed example: annual inspection is 312 hours, improvement compresses 40%, releasing 125 hours per year, rounded for illustration only. Those 125 hours are releasable capacity, not headcount removed and certainly not cash already banked.
So write: "An estimated 125 hours per year are released, to be converted at the finance hour rate and listed as an indirect benefit, not included in the payback numerator". Showing it beside the 36 wan CNY expected annual benefit is fine, but adding the two before dividing into 90 wan CNY artificially shortens payback. Finance is highly sensitive to treating hours as cash, and once that move is spotted, every other figure on the page gets re-examined.
6. Step Four: Land Technical Parameters in One Financial Sentence
In the body, technical content occupies one sentence with a fixed shape: because a capability exists, an exposure in a stated financial basis narrows by a stated rate. Constructed example: "Earlier detection narrows the 120 wan CNY exposure by 60%, corresponding to 36 wan CNY of expected annual benefit."
Anything untraceable moves to the appendix. The appendix may carry architecture, sampling, alert chains and claims such as "72 hours early warning", but must label them capability descriptions, not acceptance commitments, subject to field measurement and the original public disclosure.
7. The Decision Page Needs Only Three Columns
A decision page should be sparse enough to read in one glance. Three columns have proved the most robust:
| Column | What belongs | What does not | Review point |
|---|---|---|---|
| Investment | One-off 90 wan CNY (constructed), stating whether implementation and first-year service are included | No model-level unit prices, no quote breakdown | Consistent with budget scope |
| Annual benefit | Expected 36 wan CNY, with all three factors and their sources | No indirect benefits mixed in, no "up to" language | Numerator reproducible item by item |
| Payback | 90 / 36 = 2.5 years, noting indirect benefits excluded | No sensitivity cosmetics, no vague "about two years" | Same denominator as annual benefit |
Below them, add one line of risk exposure: "Without the project, expected loss of 60 wan CNY per year continues (constructed example)". The point is not pressure but pricing the option of doing nothing, so the choice becomes a comparison between two priced alternatives.
8. Rank by Payback and Exposure, Not by Sophistication
When several upgrades compete for one budget, the criterion is not how advanced the technology is but the combination of short payback, large exposure, and reliable data.
Use two dimensions: payback horizontally, per-event exposure vertically. Large exposure with short payback goes first; large exposure with long payback gets a separate discussion; small exposure is deferred. Data reliability acts as a veto. If any factor lacks a ledger or rests only on recollection, collect data before ranking and keep it out of this round. The 2.5-year payback in the constructed example is usable only because 120 wan CNY, 0.5 events and 60% each trace to a source. If an organisation can only offer "I think we stopped twice last year", the right deliverable is a data-collection list, not an attractive ROI table.
9. Three Traps That Recur
Trap one: inflated numbers. Treating exposure as annual benefit, hours as cash, or best case as expected value makes payback implausibly short. Defences: three factors with separate sources, indirect benefits on their own line, a footer declaring the constructed examples.
Trap two: mixed bases. Blending publicly disclosed model metrics, third-party evaluation conditions and site acceptance conditions in one formula is the main reason a calculation cannot be reproduced. A disclosed figure may be cited only as reference, with its source and a "to be verified" note, never written into an acceptance commitment and never substituted for the reduction rate.
Trap three: examples read as promises. Constructed examples demonstrate the arithmetic. Once "2.5-year payback" is heard as a guarantee, decision material becomes contract exposure. Write instead: "A calculation based on current assumptions; final figures subject to field data and jointly confirmed bases". One remedy covers all three: state beside every number where it came from, who certifies it, and under what conditions it holds.
10. FAQ: Five Questions
Q: The boss gives me 5 minutes. Which number comes first?
A: Lead with the three-column conclusion: investment 90 wan CNY, annual benefit 36 wan CNY, payback 2.5 years (constructed example). Follow with one sentence on the formula, then one line on the 60 wan CNY per year expected loss if nothing is done. Do not open the architecture or appendix unless asked. Reverse the order and all 5 minutes go into explaining the system.
Q: There is no outage ledger. Can the calculation still be done?
A: Yes, but the deliverable changes to a data-collection list plus a range estimate. Give upper and lower bounds for exposure and annual probability, state each basis and what records are missing, and publish no single payback figure. A calculation with visible gaps beats a point estimate filled from recollection.
Q: Should "72 hours early warning" appear in the presentation?
A: It may sit in the appendix as a capability description, labelled as not an acceptance commitment and subject to field measurement and the original public disclosure. Keep it off page one. It cannot be converted into money, and whether it narrows losses depends on someone acting within the window and that action succeeding, which are process conditions for the notes.
Q: What if the calculated payback is long?
A: Do not polish the number. Rank by risk exposure, show the expected loss of doing nothing alongside it, and let the decision compare investment cost against continued exposure. Then check whether conservative assumptions depressed the three factors, list each for adjustment, and never simply edit the result.
Q: Can these example figures be handed to a customer?
A: No. 120 wan CNY, 0.5 events, 60%, 36 wan CNY, 90 wan CNY and 2.5 years are constructed examples demonstrating the arithmetic. They represent no real customer and constitute neither a quote nor a commitment. Before delivery, replace them wholesale with that customer's ledgers, probability, a jointly accepted reduction rate and the finance hour rate, then recompute.
11. Scope and Limitations
This article is for presales engineers, project managers and energy leads preparing ROI presentations, project calculations and budget attachments for decision makers, translating safety and efficiency value into reproducible financial terms. It does not cover product selection, provide quotes or equipment lists, make standards-conformity determinations, or offer an energy-saving calculation method.
All amounts, probabilities, rates, hours and payback figures here, including 120, 80, 30 and 10 wan CNY, 0.5 events, 60%, 36 wan CNY, 90 wan CNY, 2.5 years, 312 hours, 40%, 125 hours, 60 wan CNY per year, 97.2%, 72 hours and 12 months, are constructed examples used to demonstrate the arithmetic. They represent no real customer, constitute neither a quote nor a commitment, and are not acceptance targets. Real use requires wholesale replacement with site ledgers, jointly confirmed bases and the finance-supplied hour rate, followed by a fresh calculation. "72 hours early warning" and similar statements are capability-description examples only, not acceptance commitments, and remain subject to field measurement and the original public disclosure. No standard number, year, clause reference or conformity table appears anywhere here; related solutions are registered only, without decoding or quoting their parameters. This article does not replace the sibling piece on busbar cost-structure calculation, and the two do not overlap in scope.
Frequently Asked Questions
How to Frame the Business Case for the Boss
A business case for the boss is not a second telling of the technical highlights