 FEXLINK Research Institute
Direct Answer
Two solutions that look alike in a demo can differ by 3 times in quoted price. Usually the expensive one is not collecting an "idiot tax" and the cheap one is not planting a trap: the two quotes simply do not describe the same scope. One prices the smallest set that passes acceptance in year one; the other has already priced replacements, expansion, software iterations and three years of operations. Compare not a unit price but both quotes levelled over the full lifecycle. Four places hide most of the gap: terminal accuracy and service life, gateway access-capacity headroom, platform algorithms and iteration, and installation plus three-year operations. The conclusion up front: a first-year quote answers only "what does it cost to get in", while lifecycle cost answers "what does it cost to finish". If a bid sheet has a single first-year column, a 3 times gap can never be explained. Every number below is a dimensionless index with the low bid set to 1.0, showing structure only, not any real project.
Translating a 3 Times Gap Into One Scope
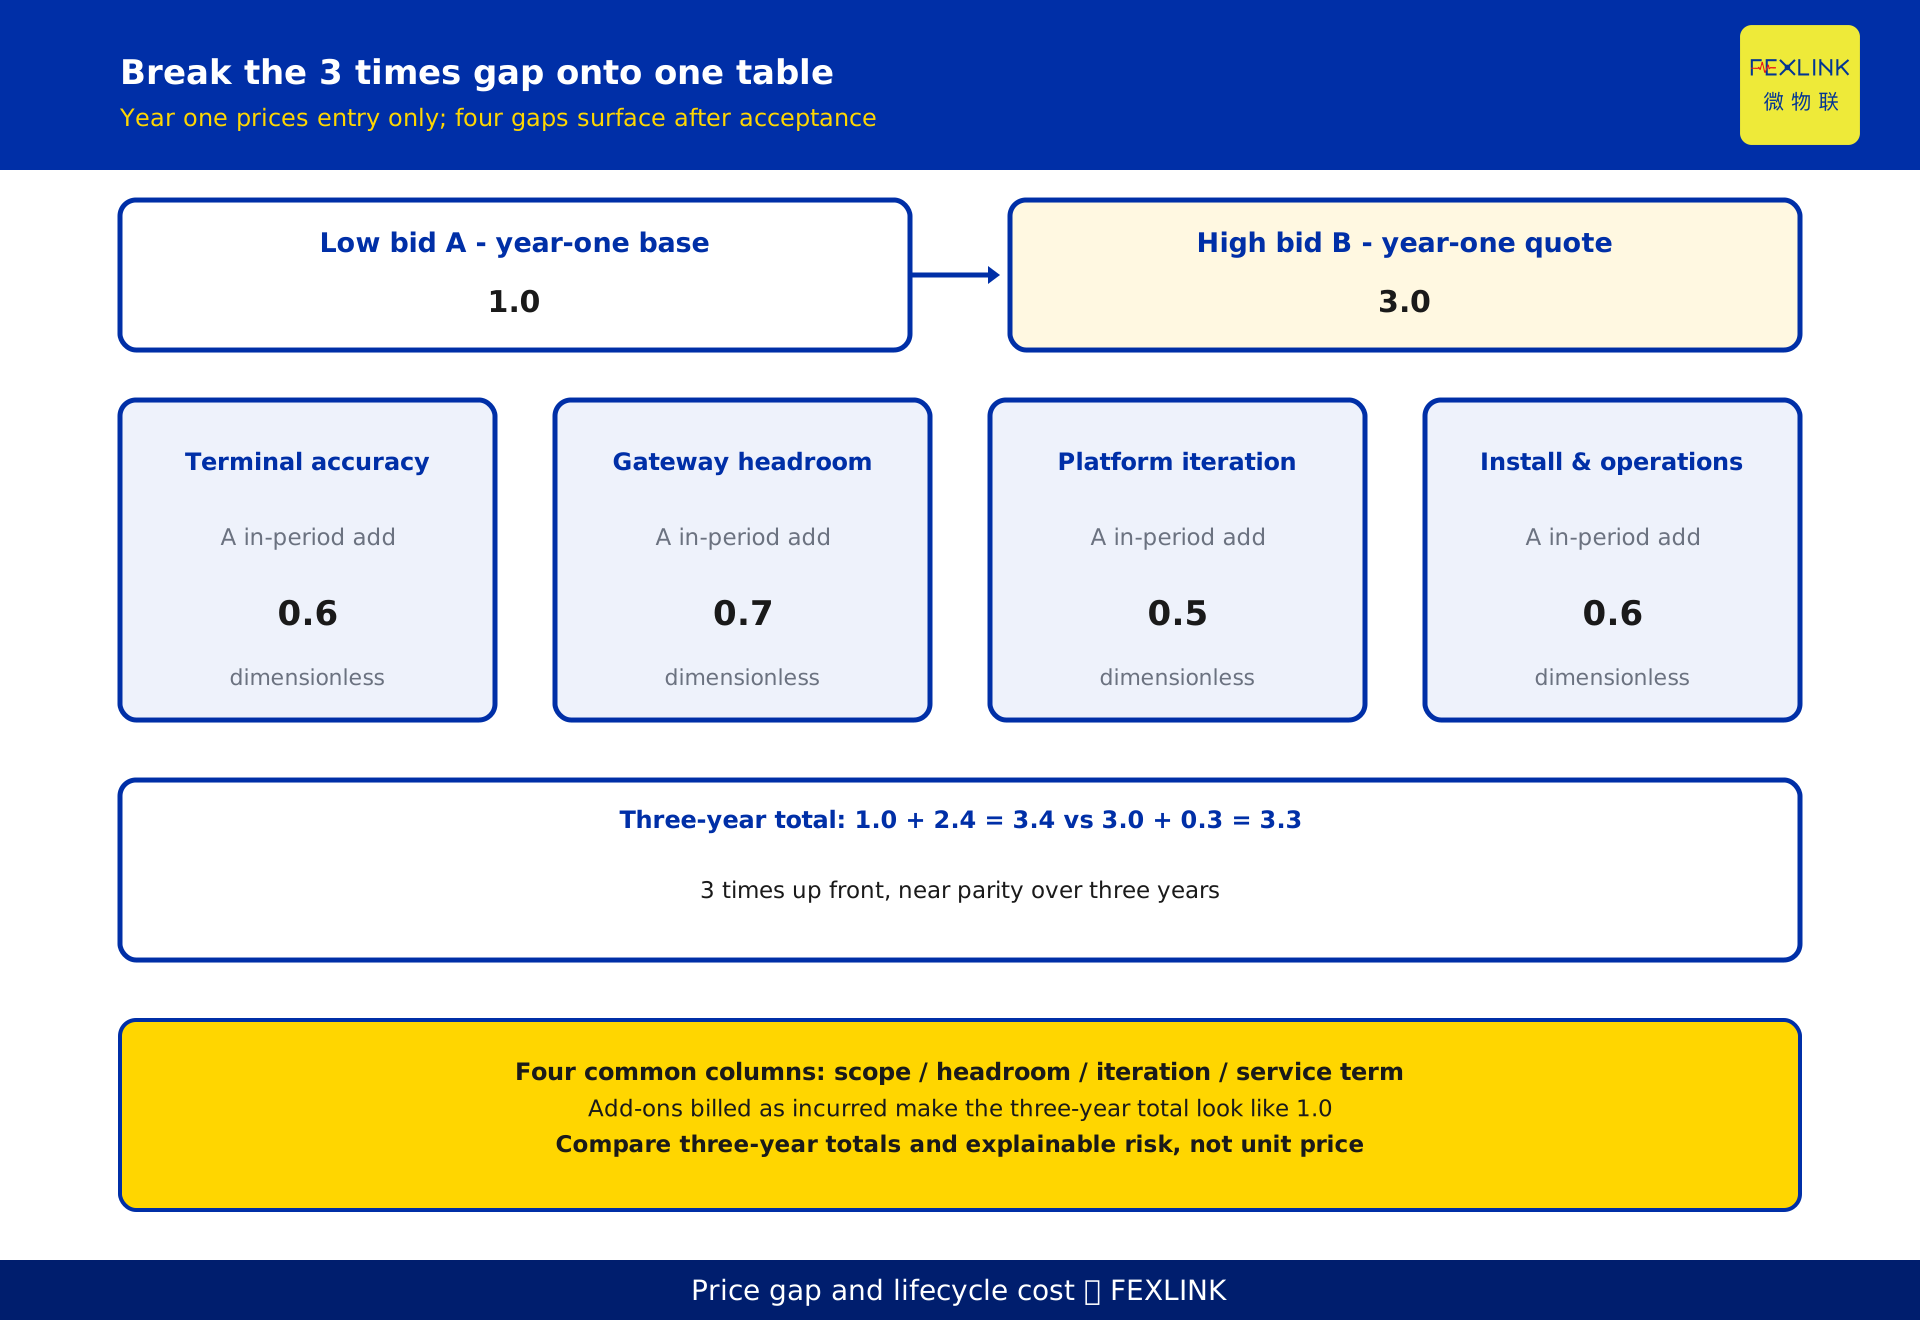
The first move is not to haggle but to ask what each quote contains. The low bid prices the smallest set that passes acceptance: terminals at the lowest usable accuracy class, gateways sized exactly to today's points, the platform frozen at delivery, installation and operations billed separately. The high bid folds accuracy margin, expansion margin, version iteration and three years of service into year one. Demos look identical because a demo runs today's points on today's features, not three years.
Translate both quotes into four common columns first: delivery scope for this phase, points covered and capacity headroom, platform features and the iteration boundary, and service term with response coverage. Once translated, a large part of the 3 times gap often turns out not to be "the same thing sold dearer" but "the low bid never priced that part at all". This step only stops a scope difference from being misread as a price difference.
Where the Gap Hides: Four Places
The gap concentrates in four places, none visible in a demo.
The first is terminal accuracy and service life. Accuracy class, range margin, environmental tolerance and service years decide how soon batch replacement comes, whether it needs a power cut, and whether readings must be recalibrated. The second is gateway access-capacity headroom. A gateway sized exactly to current points needs a swap or an extra unit when devices are added, dragging the point table, addressing and uplink configuration along. The third is platform algorithms and iteration. A one-time feature set and continuous delivery with version upgrades, algorithm updates and new protocol adapters are two different cost structures. The fourth is installation and three-year operations. Wiring, commissioning, on-site coordination, fault response, spares and inspection are often pushed outside the contract or written as "billed as incurred".
All four surface only after acceptance. On demo day they equal zero; across three years they can outweigh the first-year hardware. That is why "similar functions" never implies "similar total cost".
Terminal Accuracy and Service Life Set the Replacement Rhythm
Accuracy class decides whether data supports diagnosis rather than mere display. Range and environmental margin decide whether readings drift under load swings or temperature and humidity changes. Service years decide when replacement lands. A low bid commonly fills the bill at the lowest usable class: readings look fine at handover, but drift, loss of calibration and batch replacement cluster in the operations period.
Ask three things: which operating condition the accuracy and range margin were chosen for, how the calibration or replacement cycle is defined, and whether replacement needs a power cut and recalibration. If the answers cannot be written into the contract, no bidder carries the replacement cost. This article cites no model, accuracy figure or service-life figure; specifications belong to selection manuals.
Gateway Headroom Decides Expansion Add-Ons
A gateway's price gap often hides in "which year's points it was sized for". Sizing exactly to today's points is cheapest in year one. Add a circuit, raise sampling frequency or bring in a new protocol, and you swap or add a unit, then redo the point table, addressing, uplink configuration and platform-side registry. Headroom spends more in year one and defers that change.
Separate static capacity in device and data-point count from throughput per unit time created by sampling frequency: the first decides whether it fits, the second whether it runs once fitted. Neither substitutes for the other. Headroom here is only one cost line; unit-count sizing belongs to another article, and a bid sheet should not become a selection manual.
Check which year's points and frequencies the unit is sized for, what triggers expansion, whether expansion means adding or replacing a unit, and who carries point-table and addressing changes. Write those four down and add-ons stop becoming a surprise in year three.
Is the Platform a One-Time Delivery?
A platform is easily taken for "one piece of software", but it has at least three layers: the feature list delivered now, later versions and algorithm iteration, and the ability to adapt to new devices and new protocols. A low bid spells out the first layer and leaves the other two vague or billed per instance; a high bid folds iteration and adaptation into the service term. A demo shows only the first layer, which is why both quotes look "similar in function".
The test is not counting feature items but asking where the boundary sits: whether version upgrades are charged separately, how new protocol access is priced, what triggers an algorithm update, and whether data can be exported in full and migrated. The last one matters most: three years later, historical data and locked-in custom development can become a fresh investment if you change supplier. This article names no platform, module list or price structure.
Installation and Three-Year Operations Are Missed Most Often
Installation and operations are the least visible but hardest part of the gap. Installation covers site survey, wiring, power-cut windows, commissioning and as-built documentation; operations cover fault response, spares, inspection, calibration, troubleshooting and field-side re-verification. Low bids often write these as "billed as incurred" or shorten the service term, so year one looks attractive and the items return from year two.
Level service term and response coverage to the same length: both three years, which actions each includes, how response time is defined, whether spares and travel are inside, and how out-of-scope work is priced. If terms differ, the comparison has no meaning. What is calculated here is cost structure, not a performance promise; this article supplies no savings rate, accuracy rate, payback period or investment amount.
Stretching the Timeline: A Lifecycle Cost Model
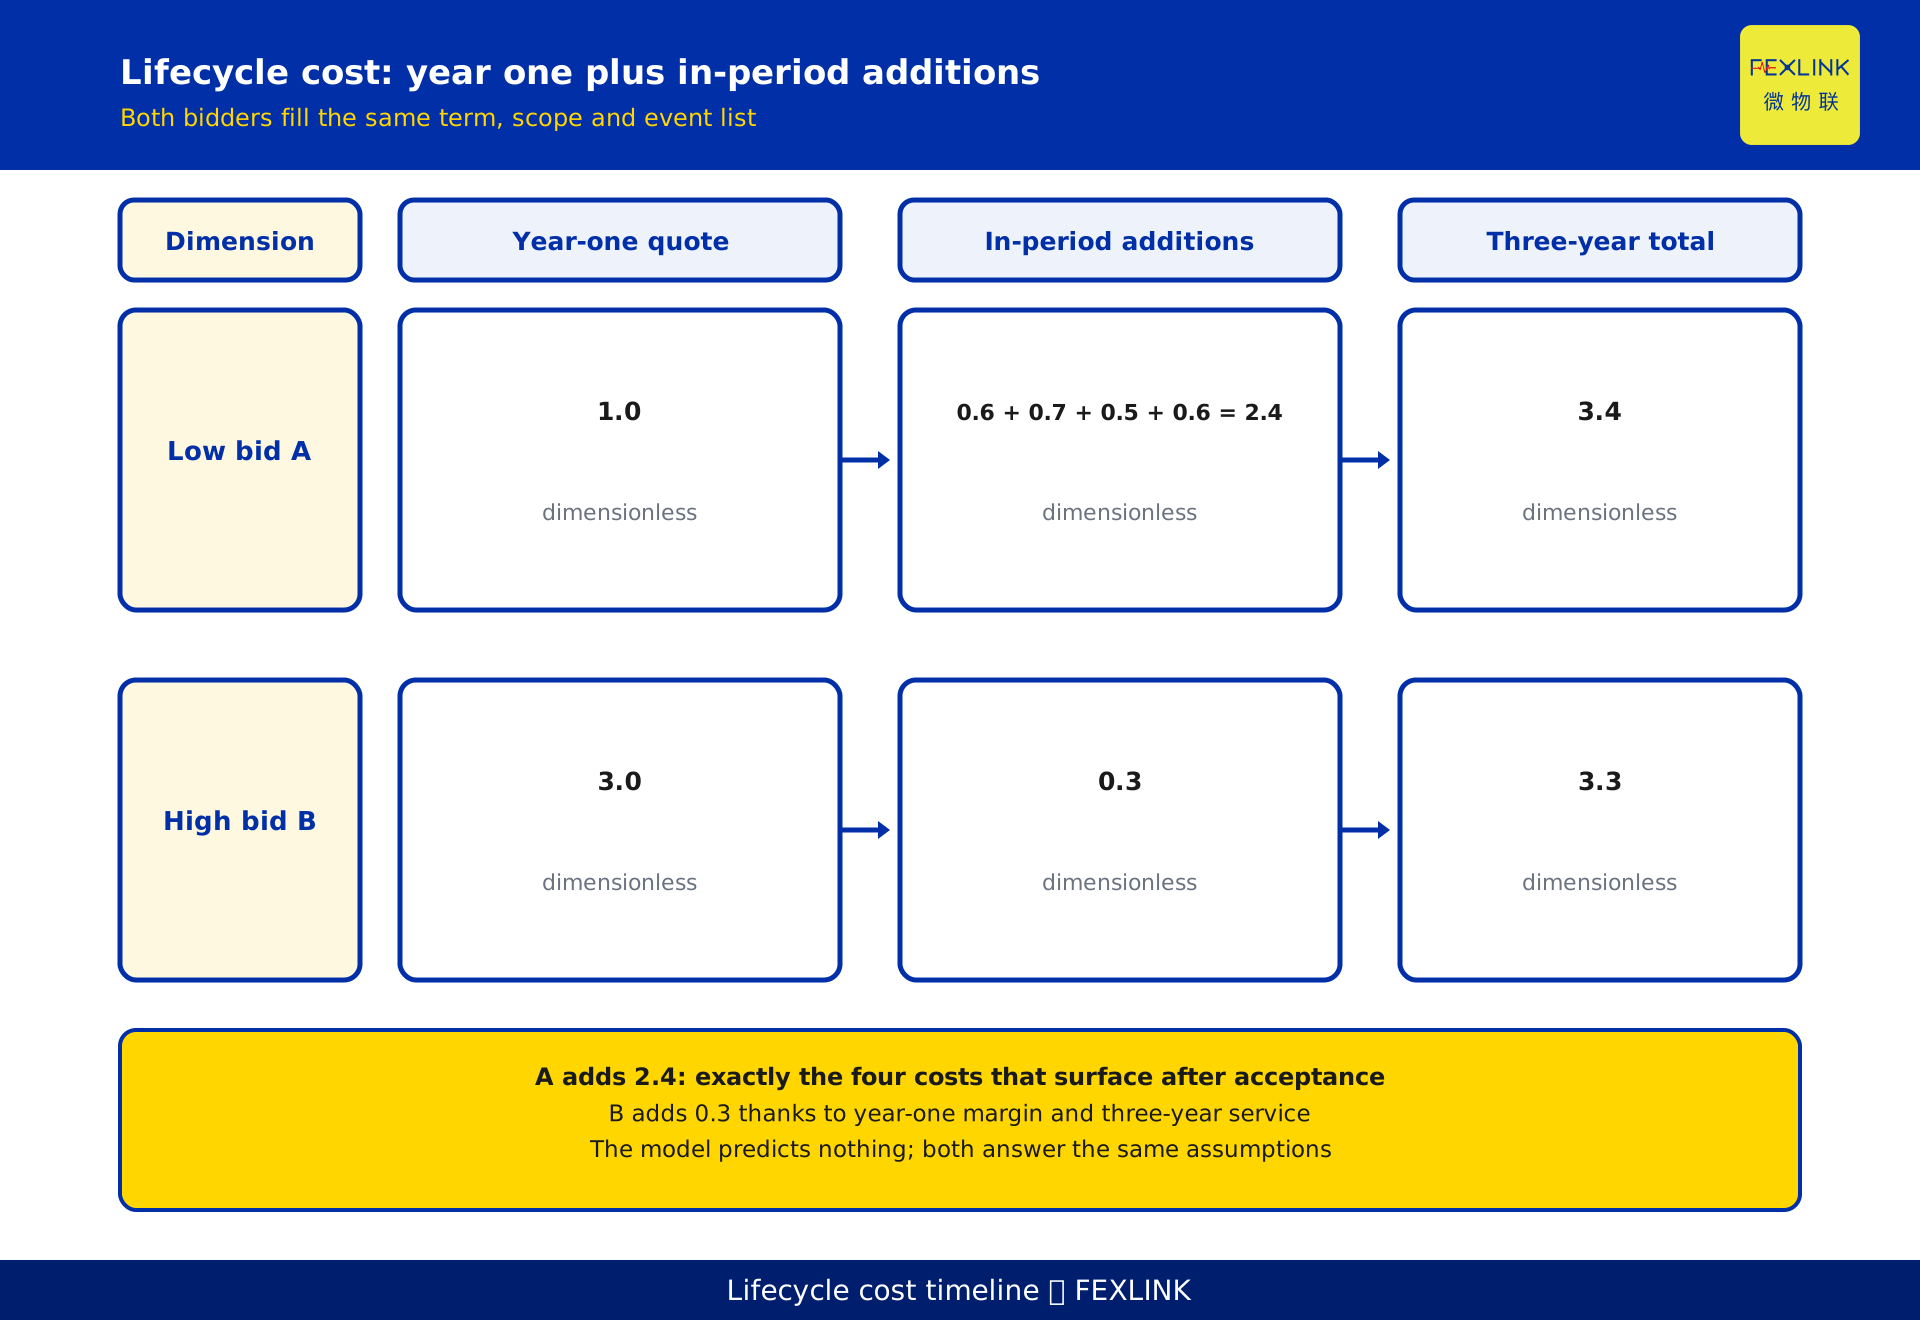
Put the four places on one timeline: lifecycle cost = first-year quote + in-period additions. Additions consist of batch terminal replacement, gateway expansion, platform custom development and protocol adaptation, and installation and operations renewals. Bid evaluation has both bidders fill in numbers under the same term, scope and event list, rather than compare one lonely first-year figure.
The point is not precision but turning "later" into "write it in the table now". Any blank cell or one marked billed as incurred should be an open item sent for clarification. More blanks mean a less controllable three-year total. The model asks no one to predict the future, only to answer the same assumptions.
A Normalised Example: 3 Times Up Front, Near Parity Over Three Years
The following constructed illustration shows structure only. Let low bid A have a first-year quote of 1.0 as the base index, and high bid B 3.0, the 3 times in the title. Now let A's in-period additions over three years be split by index as: terminal replacement 0.6, gateway expansion 0.7, platform custom development and protocol adaptation 0.5, installation and operations additions 0.6, totalling 2.4. A's three-year total is 1.0 + 2.4 = 3.4. Because B already carries margin and three years of service in year one, its in-period additions are only 0.3, giving a three-year total of 3.0 + 0.3 = 3.3.
Two conclusions follow. First-year quotes differ by 3 times while three-year totals are nearly level, with the high bid slightly lower; looking only at first year guarantees a wrong verdict. Second, the 2.4 did not appear from nowhere. It is exactly the cost of the four places in the earlier sections, each of which "surfaces only after acceptance". If A writes every addition as billed as incurred, its three-year total on the bid sheet appears to be just 1.0, and the risk has been pushed into the operations period.
This must be stressed: 1.0, 3.0, 0.6, 0.7, 0.5, 2.4, 3.4, 0.3 and 3.3 are dimensionless indices, a de-identified construction demonstrating comparison after scope levelling. They are no project's quote, ratio or empirical value, and cannot serve as a budgeting basis. Real numbers must come from both bidders against the same list.
How to Use It in Bid Evaluation: One Table and Four Questions
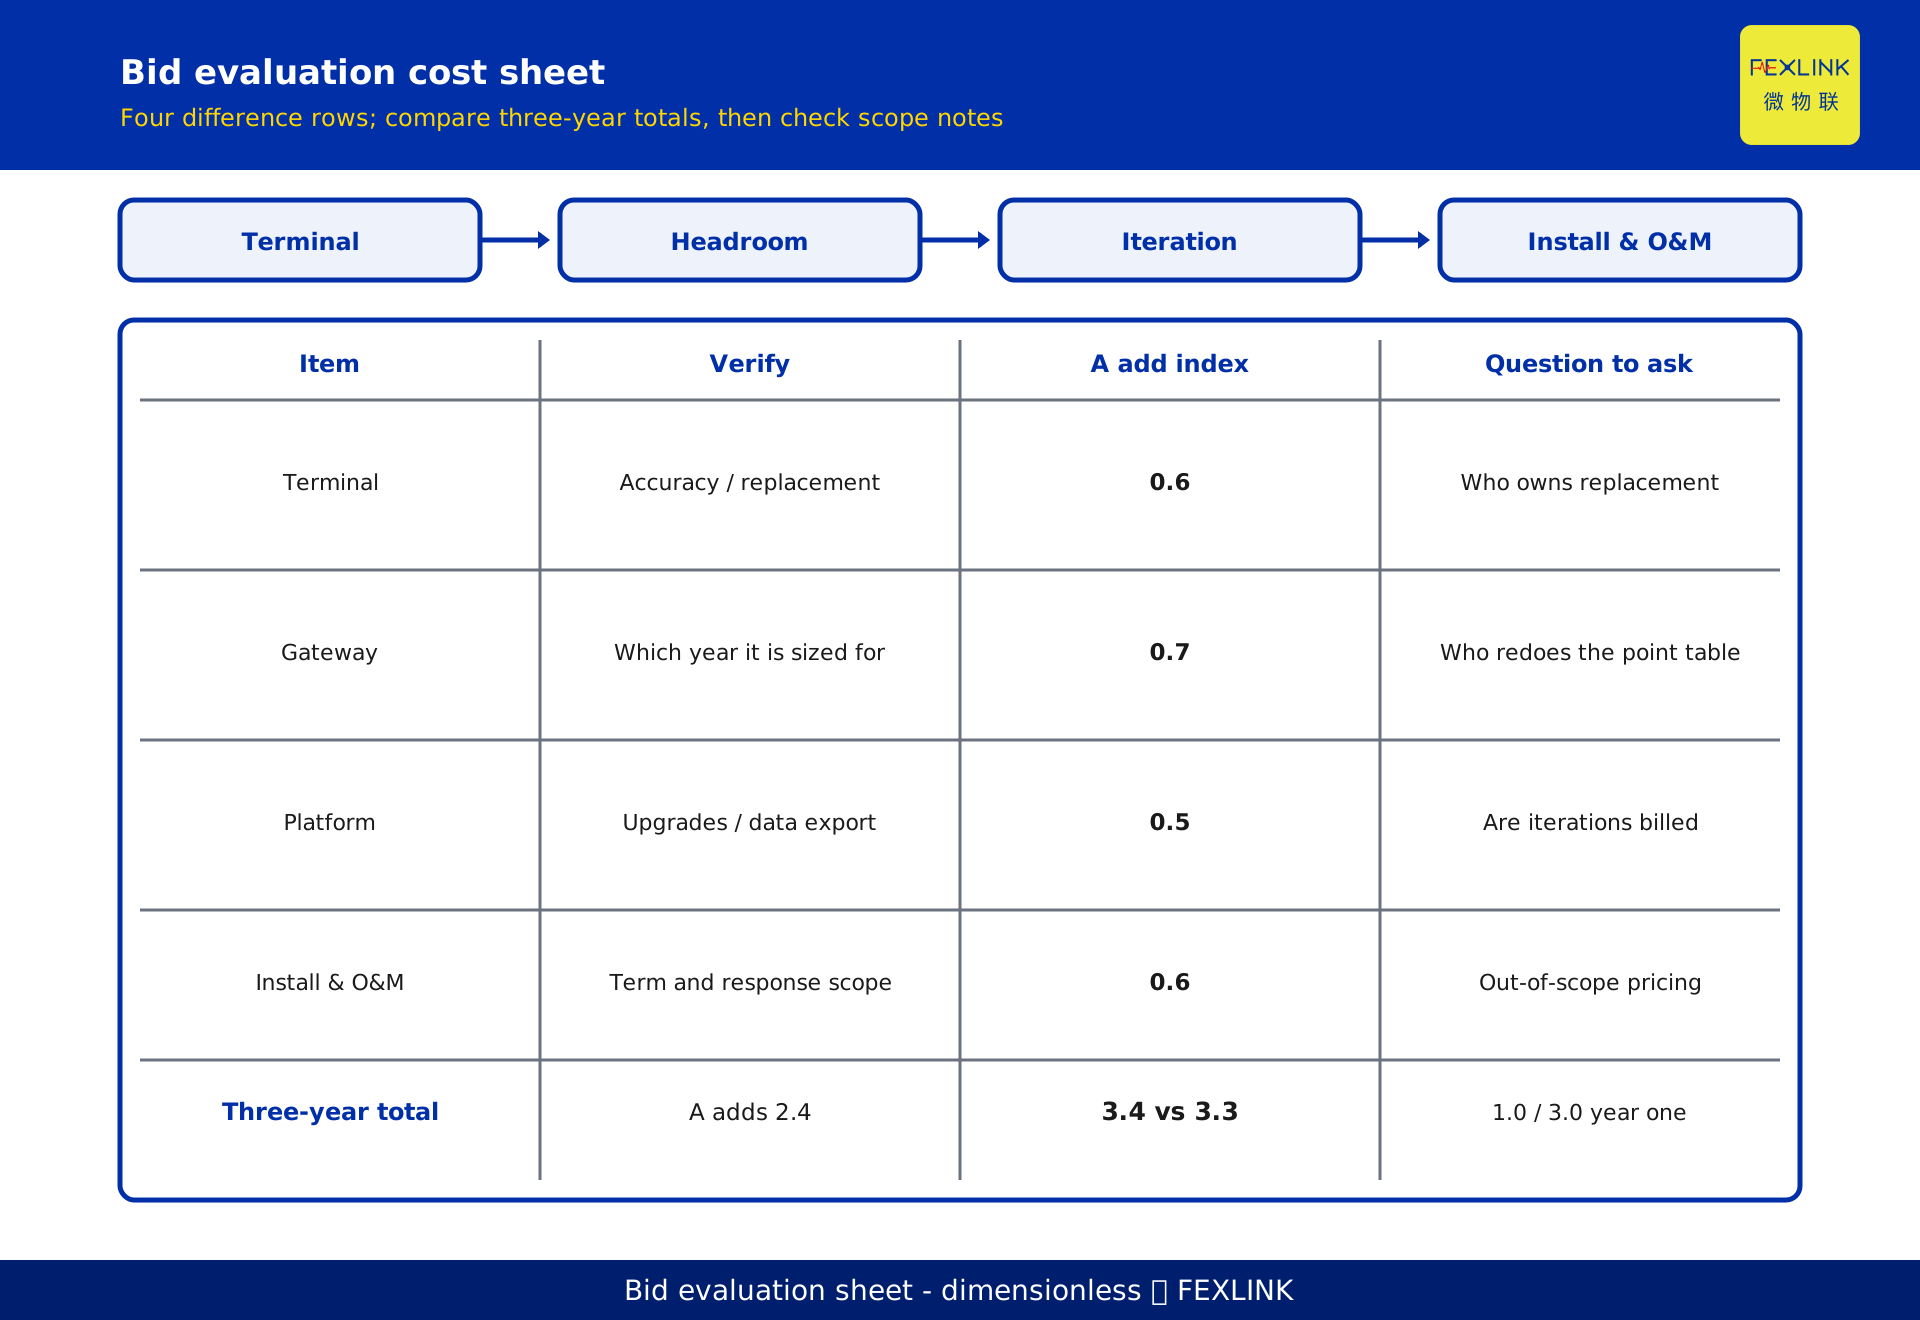
Putting this to work needs one table: the four difference items as rows; first year, in-period additions and three-year total as columns; one pass per bidder; plus a "scope note" column recording term, scope and event definitions. Compare the three-year totals first, then go back and see whose scope note is more concrete in each cell.
Add four questions: who owns terminal replacement and calibration, and on what cycle; what triggers expansion and who carries point-table changes; whether version upgrades, algorithm updates and new protocol adapters are priced separately; and what the three-year service scope includes, how response is defined, and how out-of-scope work is priced. All four should land in written clarification, not a verbal promise.
The verdict should be neither "pick the expensive one" nor "pick the cheap one", but whose three-year total and risk can be explained under one common scope. If neither bidder fills in the additions, what is missing is not price information but scope definition in the tender documents. This article answers where the gap between two similar solutions comes from and how to compare it; estimating investment for your own project belongs elsewhere.
Frequently Asked Questions (FAQ)
Q: Does a 3 times price gap always mean something is wrong?
Not necessarily. A scope difference is more common: one quote covers only the smallest first-year set, the other includes margin, iteration and three years of service. Level scope, term and event list first, then see where the difference lands; an unexplained residual gap deserves close questioning.
Q: Can a low bid be excluded simply because of "later add-ons"?
Neither exclude it outright nor accept it as is. Ask for additions filled against the same list and written into the contract with pricing terms. A bidder that cannot fill them or insists on billing as incurred should be flagged as a risk, not removed by default.
Q: How many years should a lifecycle cost calculation cover?
There is no universal term, but both bidders must use the same one. Three years is common because it covers one round of replacement, expansion and operations renewal. The actual term is set by the tender documents; three years here is only for the illustration.
Q: Can we apply these indices directly to our project?
No. Figures such as 1.0, 3.0, 3.4 and 3.3 are de-identified dimensionless indices demonstrating the levelling method, not quotes, ratios or empirical values. A real comparison needs actual data from both bidders against the same list.
Q: This article or the one on estimating point budgets?
That one answers how to estimate investment for your own project and build a point budget. This one answers where the price gap comes from when two demos look similar, and how to level a bid sheet. They can be used together, but an investment estimate must not replace a solution comparison.
Scope and Limitations
- Applies to levelling lifecycle cost scope during solution comparison and bid evaluation for non-classified monitoring, supervision and electrical-safety platforms. Pure equipment purchases and one-off deliveries with no platform or operations are out of scope.
- No standard number, clause, technical requirement table, model, accuracy figure, service-life figure, unit price, amount, payback period or performance data is cited. Related products and standards are empty in the registry; related solutions are described only qualitatively.
- All numbers in the eighth section are dimensionless constructed indices; the scenario is de-identified with no customer, project or place name, represents no real project, and constitutes no quotation, budget, compliance determination or selection advice.
- Service term, response coverage, expansion triggers and pricing methods are governed by tender documents, the contract and written clarification. This article is a method outline and does not replace an evaluation committee's judgement.
- Gateway unit-count sizing, point budget estimation and protocol coverage selection belong to other articles; here they appear only as cost lines.
- Performance data (compliance pass rates, assessment scores, savings rates, accuracy rates, investment amounts, remediation periods) never enters this article's conclusions.
Frequently Asked Questions
Two Solutions Look Alike but Differ Threefold in Price
Two solutions that look alike in a demo can differ by 3 times in quoted price