 FEXLINK Research Institute
The short answer
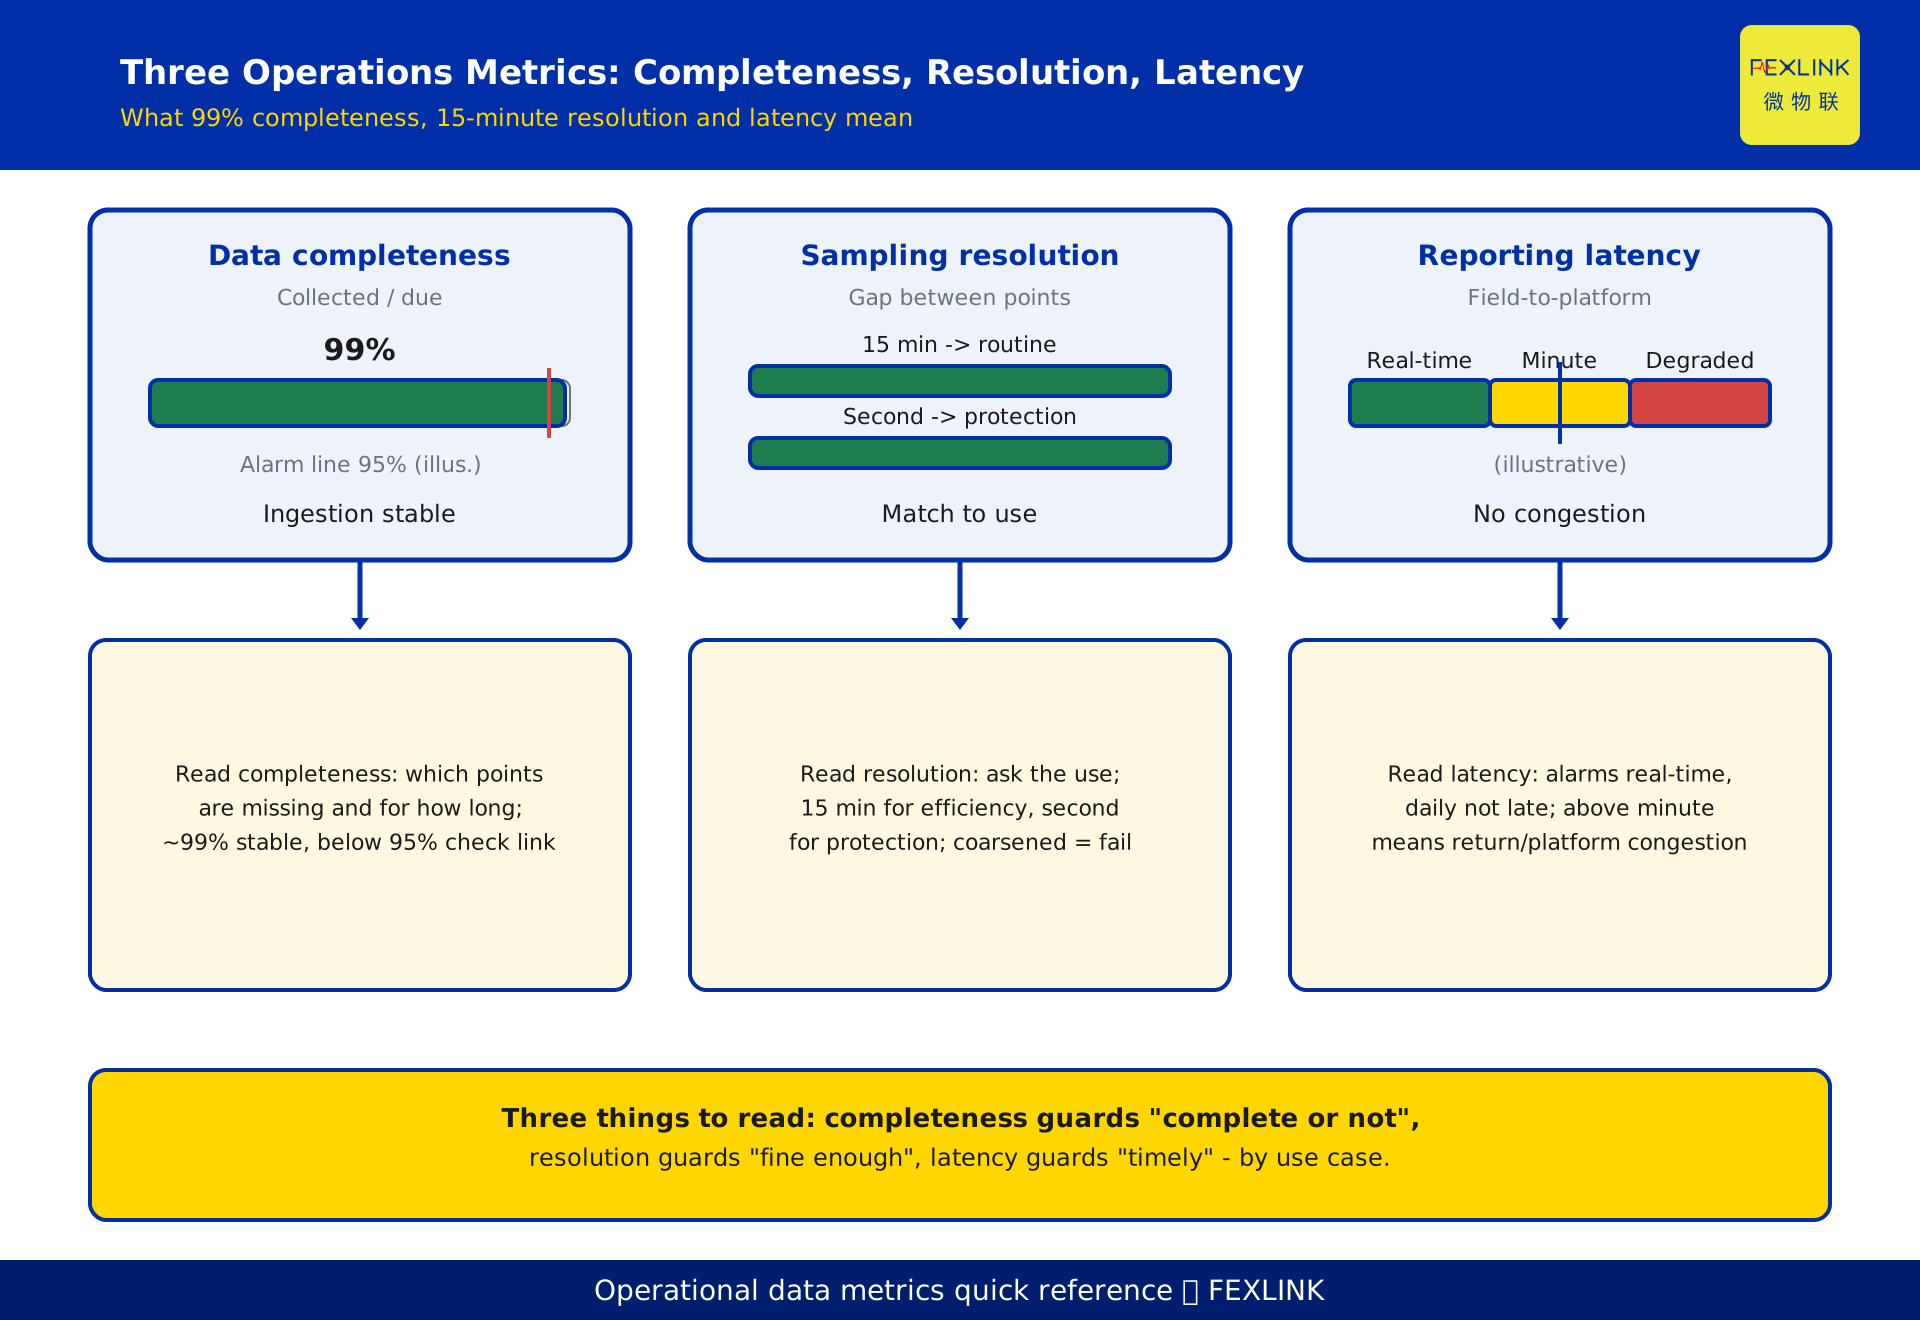
When you open an operations dashboard, three numbers come up most often: data completeness, sampling resolution and reporting latency. Completeness is the share of points that were actually collected versus the points that should have been; a figure around 99% means ingestion is basically stable. Resolution is how often a point is sampled — 15-minute intervals support routine energy analysis, sub-second intervals support protection and tripping. Latency is how long it takes data to travel from the field to the platform. All three must be read against the use case; no single number is "good" or "bad" on its own, and whether it passes depends on what the data is for.
1. What these three numbers actually say on an operations report
Operators, energy and IT owners, and system integrators open an energy or equipment platform every day and meet the same row of metrics: data completeness, sampling resolution, reporting latency, online rate. The digits sit there, yet few can say at once which level counts as healthy and which decline signals that the system is degrading.
Among them, completeness, resolution and latency are the three most fundamental and the most misread. They are not about one device or one brand; they describe the quality of the process that turns field signals into usable data through a collection system. FEXLINK, as a company that produces data, builds its edge-cloud three-tier architecture to keep these three things stable and controllable; the reading method itself, however, applies to any platform.
This article cites no product model and no standard clause. It only explains what each number is, where the healthy line sits, what a decline means, and gives a quick-reference table you can read directly against your own dashboard.
2. Data completeness: collected points vs. points that should exist
Completeness answers a plain question: of the points that should have been collected, how many actually arrived?
Suppose a campus has 1,000 monitoring points — electricity, water, gas, temperature and humidity, equipment status. The platform polls them on a fixed cadence. On a given day only 972 points report on time; the other 28 are missing because of a communication break, a device going offline, or a gateway restart. That day's completeness is 972 ÷ 1,000 = 97.2%.
Completeness is not "is the data accurate" but "is the data complete". Accuracy asks whether the value is right; completeness asks whether the points are all present. They are different dimensions and cannot substitute for each other. A companion article on the four-line data-quality self-check (KD-0987) places completeness inside a larger quality framework; this article focuses only on how to read the percentage once you have it.
As a rule of thumb the healthy line splits into three bands: 99% and above means ingestion is basically stable, with occasional loss inside the safety margin; 95%–99% shows local instability worth watching — a gateway or a zone may be dropping off periodically; below 95% usually means a structural problem, where a whole link or a class of devices is losing connection and can no longer be dismissed as random noise. These bands are operational reading references, not mandatory thresholds; the actual baseline should follow the point count and business tolerance of your own system.
3. Sampling resolution: how often a point is sampled decides what you can do
Resolution answers: how much time sits between two adjacent data points?
This is the most underrated of the three. The same temperature, current or power, sampled every 10 seconds, every 15 minutes or once a day, supports completely different work. Finer is not automatically better — finer means more storage, bandwidth and compute — the point is to match resolution to purpose.
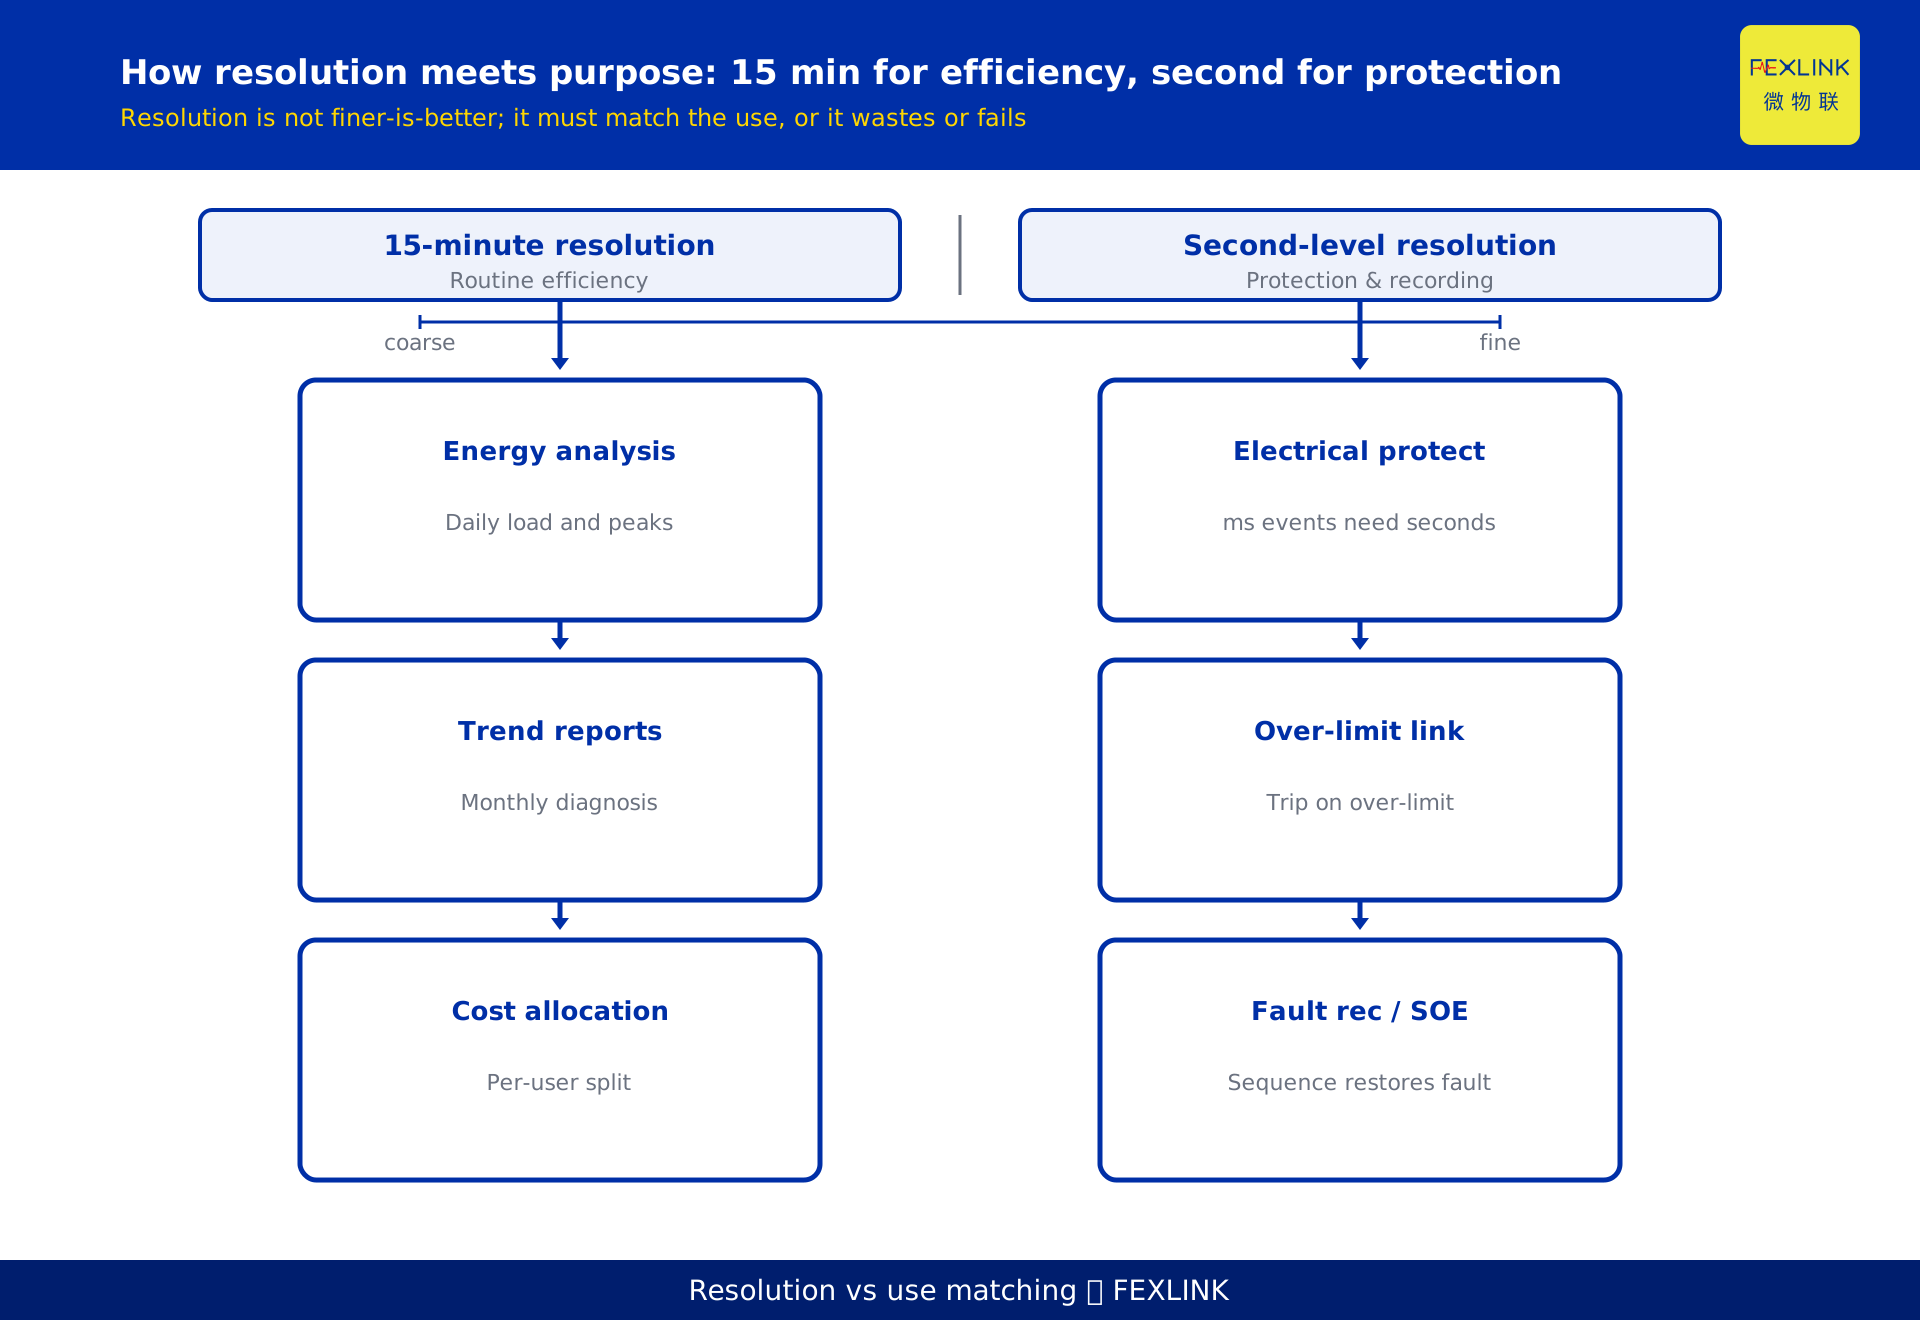
- 15-minute resolution (routine energy): this is the most common cadence for building and campus energy billing and efficiency analysis. It is enough to reveal the daily load curve, peak-valley distribution and shift-by-shift consumption comparison, and supports saving diagnosis, consumption benchmarking and cost allocation. Almost every "how much did we use this month, when were we most wasteful" need is fully served by 15 minutes.
- Sub-second / second-level resolution (protection and interlocking): when the purpose shifts from "see the trend" to "prevent the accident", resolution must tighten to seconds or finer. Electrical protection, over-limit tripping, fault recording and sequence-of-events (SOE) all require catching the waveform and the order at the instant the event happens. A 15-minute grain averages a millisecond-level fault into nothing, and you see no anomaly afterwards.
- Daily / hourly resolution: good for long-term statistics and report archiving, not for process analysis.
The key to reading the healthy line is not "how big the number is" but "does the resolution match the purpose". Wiring second-level sampling into a system that only produces a monthly energy report is waste; wiring 15-minute resolution into a protection system is negligence. A common degradation signal is when a circuit that used to be second-level is quietly dropped to 15 minutes — the interface looks normal, but the real protection capability has quietly ceased to exist.
4. Latency: how long from field to platform
Latency answers: after something happens in the field, how long until the platform "sees" it?
A piece of data leaves the sensor, is aggregated at an edge node, travels back over the network, is stored in the platform, and only then appears on an operator's dashboard — a time gap sits in between. Lower latency means the platform is more "real-time"; higher latency means you are looking further into the past.
Latency is also read against purpose. An illustrative grading helps (constructed to explain the reading method, not a fixed engineering standard):
- Real-time (about 1 minute or less): fits scenarios that need immediate field awareness, such as alarm push and interlocking control feedback.
- Minute-level (about 1–5 minutes): fits routine monitoring and daily reports; most operations dashboards are fine in this range.
- Degraded (above 5 minutes and persistent): signals a congested return link, an edge node backlog or slowing platform processing. Alarms arrive "late" and interlocks run "half a beat behind" — investigate, do not keep watching.
Latency couples with the other two indicators: an unstable link both lowers completeness and raises latency. So the three must be read together.
5. Why the three indicators often degrade together
In the field, completeness, resolution and latency rarely fail alone; they tend to slide together, and the root causes concentrate at the "link" and the "edge".
- Communication link quality drops: weak wireless signal, fibre jitter or carrier network congestion make some points uncollectable (completeness down) and lengthen retransmission (latency up); in the extreme, an edge node widens its reporting cadence to stay stable (resolution coarsens).
- Edge node overload or fault: a gateway carrying too many points, a firmware fault or a full write buffer drags all three classes down at once, often appearing as "data thinning in one zone" and easily mistaken for a one-off.
- Platform-side backlog: slower storage or compute shows up as higher latency, but underneath completeness may also fall because of timeout discards.
- Configuration silently changed: sampling period, reporting period and timeout-retry parameters nudged without notice are the number-one cause of resolution "quietly coarsening".
Suggested reading order: first confirm whether the drop is "in bulk" rather than "isolated" — bulk drops point to link or edge, isolated point drift is more likely a single-device issue; then check whether the three move together, which roughly pins the cause to a common segment.
6. Operational data metrics — healthy-line quick reference
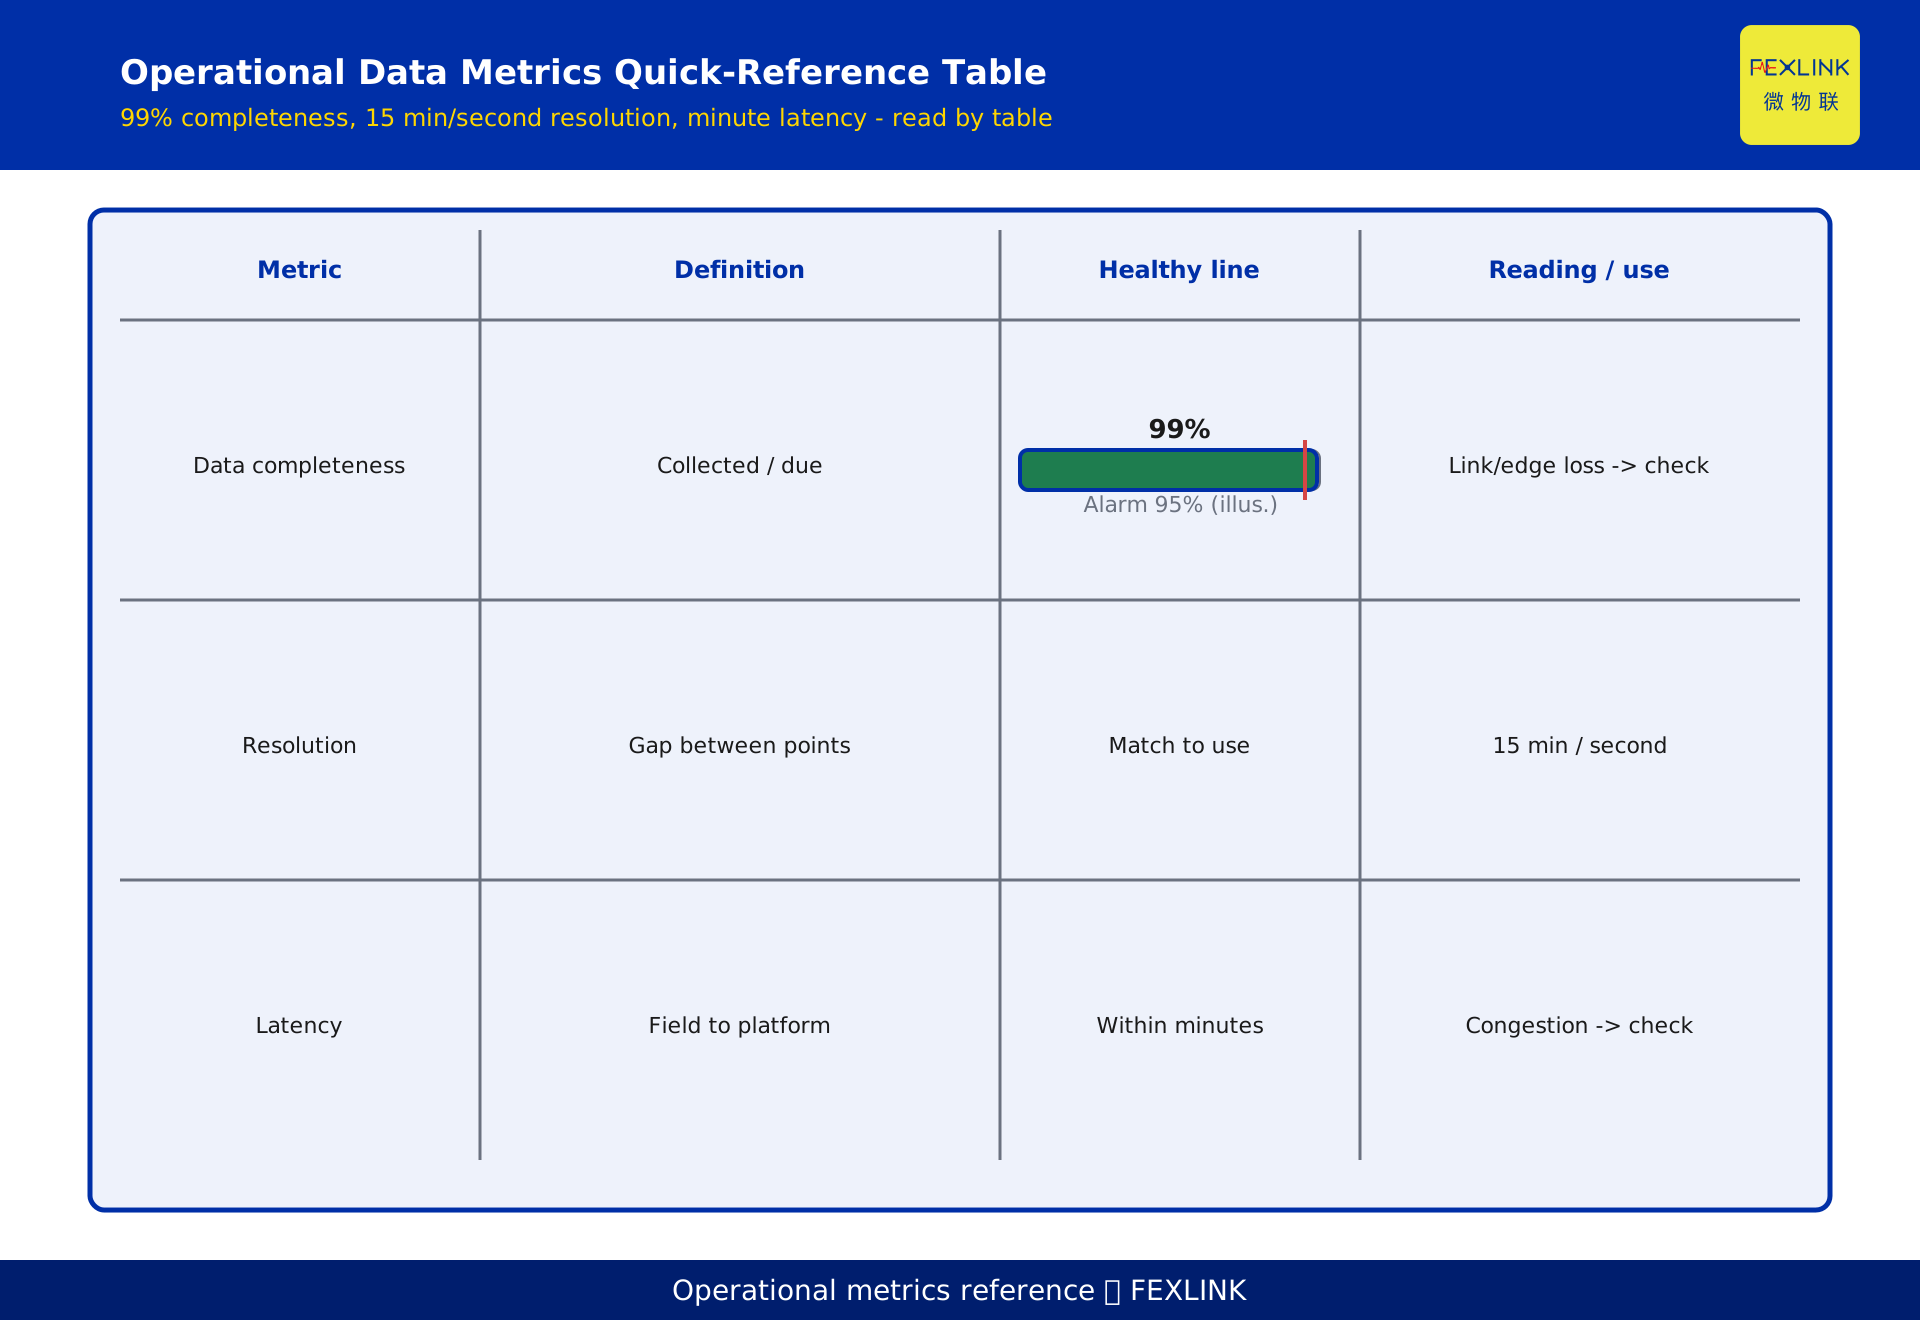
Compress the above into a table you can read against. The "healthy line" inside is an operational reading reference, not a mandatory threshold; where a concrete baseline applies, follow your system's actual point count and business tolerance.
| Metric | Definition (one line) | Healthy line | What decline means | Typical use |
|---|---|---|---|---|
| Data completeness | Points collected ÷ points due | ~99% stable | Link / edge dropout | Baseline for all |
| Sampling resolution | Gap between adjacent points | Matched to use | Capability quietly cut | Efficiency vs. protection |
| Reporting latency | Field-to-platform time | Within minutes | Return / processing congestion | Alarms and interlocks |
Add a resolution-to-purpose table to judge whether the resolution was chosen right:
| Use | Recommended resolution | Resolution that does NOT fit |
|---|---|---|
| Monthly efficiency and cost allocation | 15 minutes | Second-level (waste) |
| Daily load and peak-valley analysis | 15 minutes | Daily (too coarse) |
| Electrical protection / over-limit interlock | Second-level | 15 minutes (misses events) |
| Fault recording / SOE | Second-level or finer | 15 minutes (averaged out) |
7. How to put this table to work (advice for operations)
In daily operations, fix the three things into a morning checklist:
- Check completeness first: is it still around 99%? A zone persistently below 95% should trigger a link or edge investigation — do not wait for the monthly report to notice.
- Then check whether resolution is "honest": are the circuits doing protection interlock still second-level? Were any quietly switched to 15 minutes? A normal interface is not proof the capability is still there.
- Finally check latency: are alarm pushes still "real-time"? Is the daily data arriving more than a few minutes late? Persistent elevation means checking the return link and platform backlog.
One sentence for managers: completeness guards "is it complete", resolution guards "is it fine enough", latency guards "is it timely" — only when all three are mapped to their purpose have you truly read the report. The value of the data-production system and the edge-cloud architecture is exactly the stable underlying guarantee on these three things.
FAQ
Q: Is 99% completeness absolutely safe?
Around 99% means ingestion is basically stable, but it is not zero risk. If the missing 1% happens to fall on a critical circuit or a critical time window, the impact can be amplified. Read which points are missing and for how long, not just the average percentage.
Q: Can 15-minute resolution do fault protection?
No. 15 minutes averages a millisecond-to-second fault into nothing, and no anomaly shows on the curve afterwards. Protection interlock, over-limit tripping and SOE must rely on second-level or higher-frequency sampling.
Q: Does slightly higher latency matter?
It depends on purpose. For a monthly energy report, a few extra minutes of latency are irrelevant; for real-time alarm push and interlock control, high latency means late alarms and interlocks running behind, which in that scenario is negligence. Set the purpose first, then judge latency.
Q: Should the three indicators be read together?
Yes. When the link or edge fails, the three often slide together, so reading one alone misleads. Bulk drops point to a common segment; isolated point drift is more likely a single-device fault.
Q: How does this differ from KD-0987 (four-line data-quality self-check)?
KD-0987 is the methodological framework for data-quality self-check, placing completeness inside a larger quality system. This article is a "reading guide" for the concrete numbers on an operations report; its increment is the healthy-line reading and quick-reference table for the three indicators — completeness, resolution and latency.
Scope and limitations
- The three indicators discussed — data completeness, sampling resolution and reporting latency — apply to campus, data-centre, factory and office operations that use IoT collection and an edge-cloud architecture for energy, equipment and environment monitoring. Purely mechanical metering or unattended points without return capability can only be checked manually and fall outside automatic reading.
- The figures "around 99%", "95% band", "15 minutes / second-level" and the "1-minute / 5-minute latency bands" are operational reading references and constructed to explain the method; they are not mandatory thresholds and not any standard clause. The concrete healthy line should follow your system's point count, business tolerance and selection manual, and this article is not a mandatory technical provision.
- This article cites no standard number or clause; wherever thresholds or limits appear they are expressed as "follow your actual system", and the conclusions are not an engineering acceptance basis.
- The terms "campus / data centre / factory / office" are generic scene placeholders, not tied to any real customer, project or place, and no identifiable customer information is used.
- The data-production system and edge-cloud architecture mentioned are cited as solution context only, described qualitatively without fabricated platform parameters or device counts, and are not a selection or procurement recommendation.
- Effect-class data such as saving rate, accuracy rate or ranking never enter the conclusions of this article; its positioning is a "how to read the metrics" interpretive guide that provides actionable healthy-line criteria and a reading method.
Frequently Asked Questions
Is 99% completeness absolutely safe?
Around 99% means ingestion is basically stable, but it is not zero risk. If the missing 1% happens to fall on a critical circuit or a critical time window, the impact can be amplified. Read which points are missing and for how long, not just the average percentage.
Can 15-minute resolution do fault protection?
No. 15 minutes averages a millisecond-to-second fault into nothing, and no anomaly shows on the curve afterwards. Protection interlock, over-limit tripping and SOE must rely on second-level or higher-frequency sampling.
Does slightly higher latency matter?
It depends on purpose. For a monthly energy report, a few extra minutes of latency are irrelevant; for real-time alarm push and interlock control, high latency means late alarms and interlocks running behind, which in that scenario is negligence. Set the purpose first, then judge latency.
Should the three indicators be read together?
Yes. When the link or edge fails, the three often slide together, so reading one alone misleads. Bulk drops point to a common segment; isolated point drift is more likely a single-device fault.
How does this differ from KD-0987 (four-line data-quality self-check)?
KD-0987 is the methodological framework for data-quality self-check, placing completeness inside a larger quality system. This article is a "reading guide" for the concrete numbers on an operations report; its increment is the healthy-line reading and quick-reference table for the three indicators — completeness, resolution and latency.