 FEXLINK Research Institute
Direct Answer
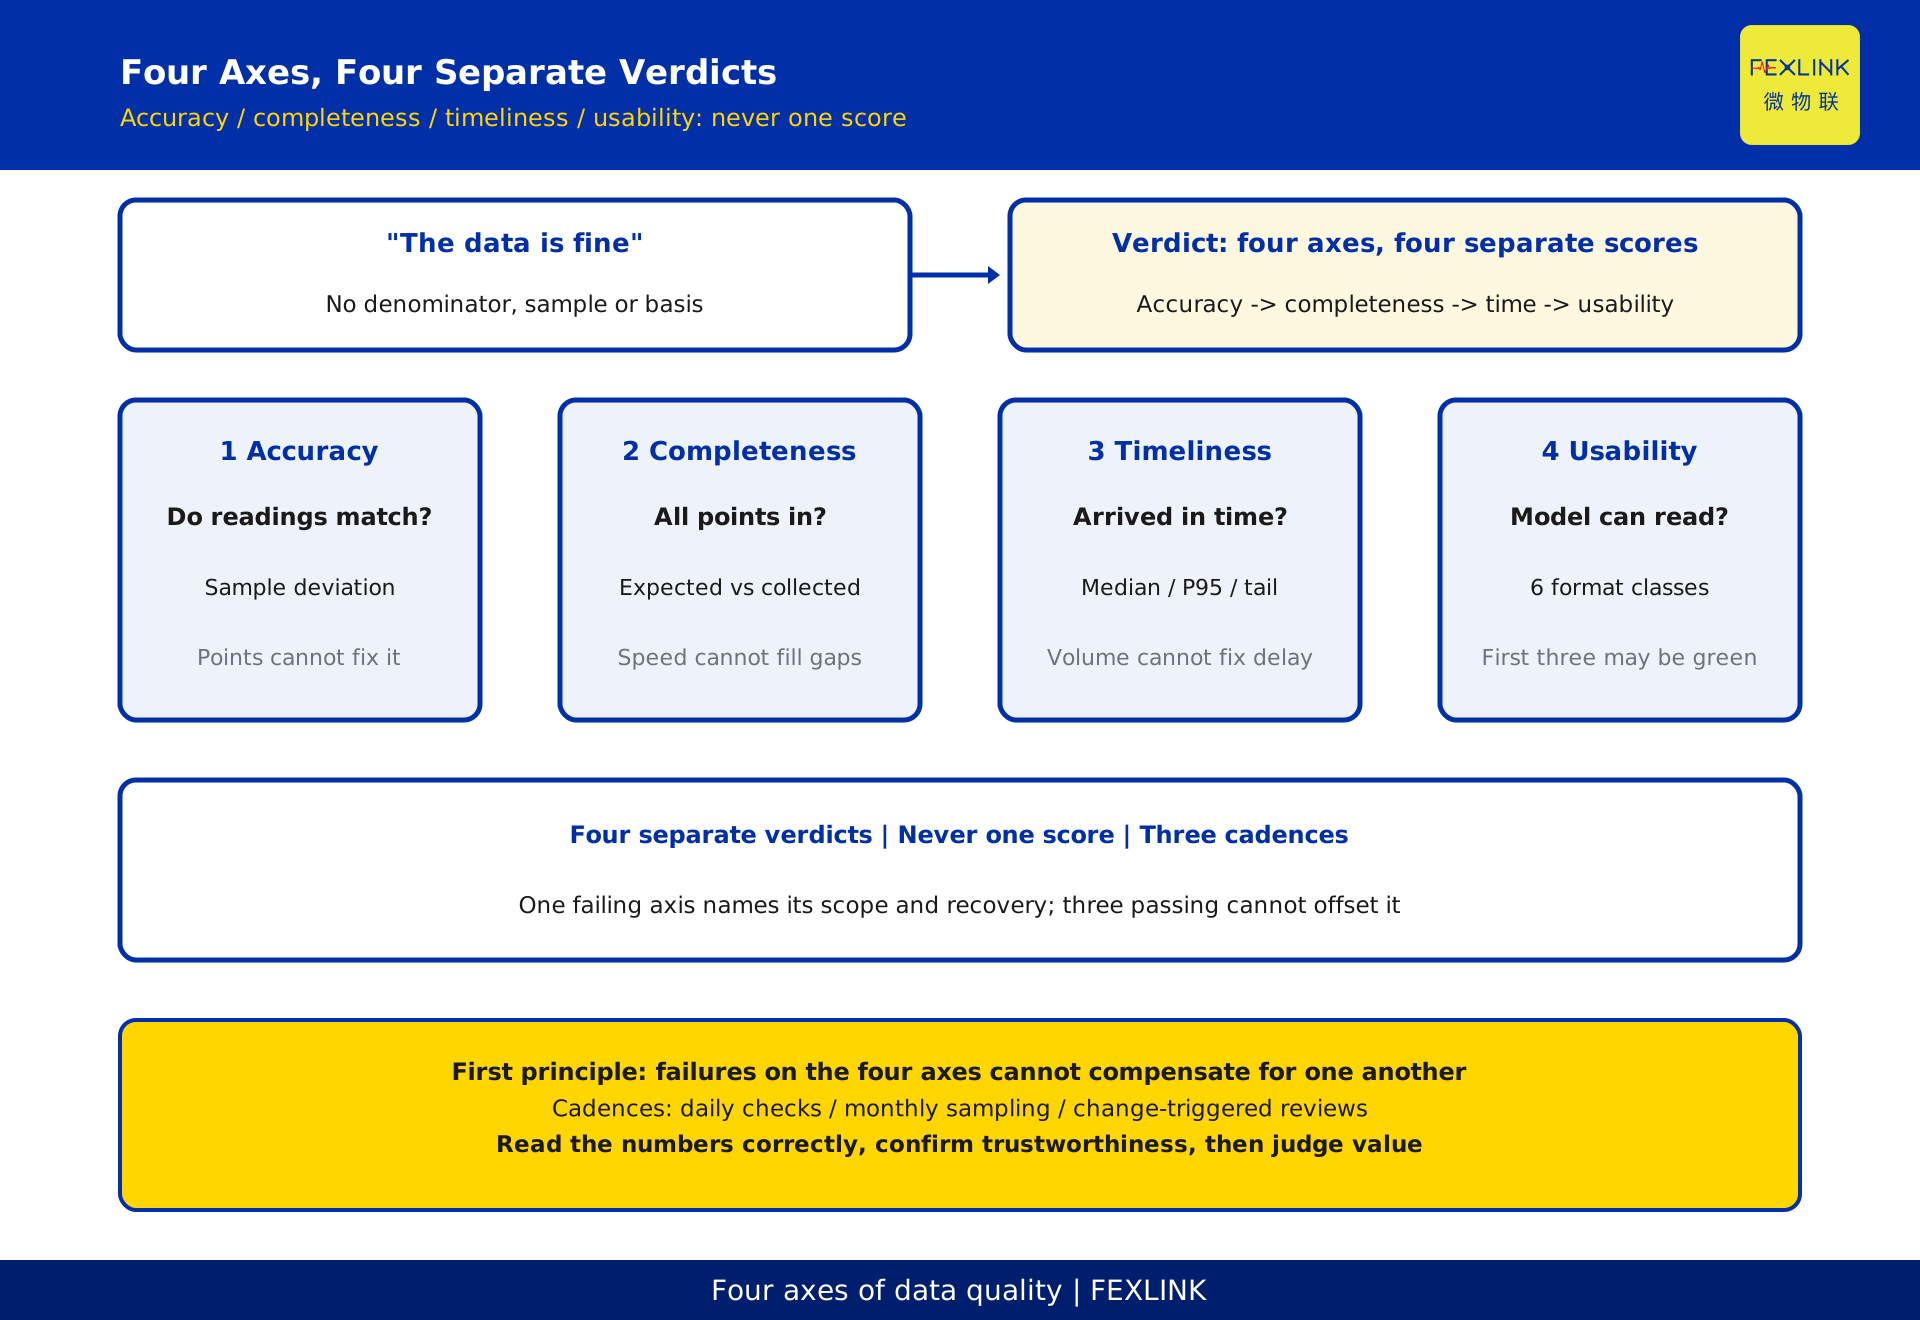
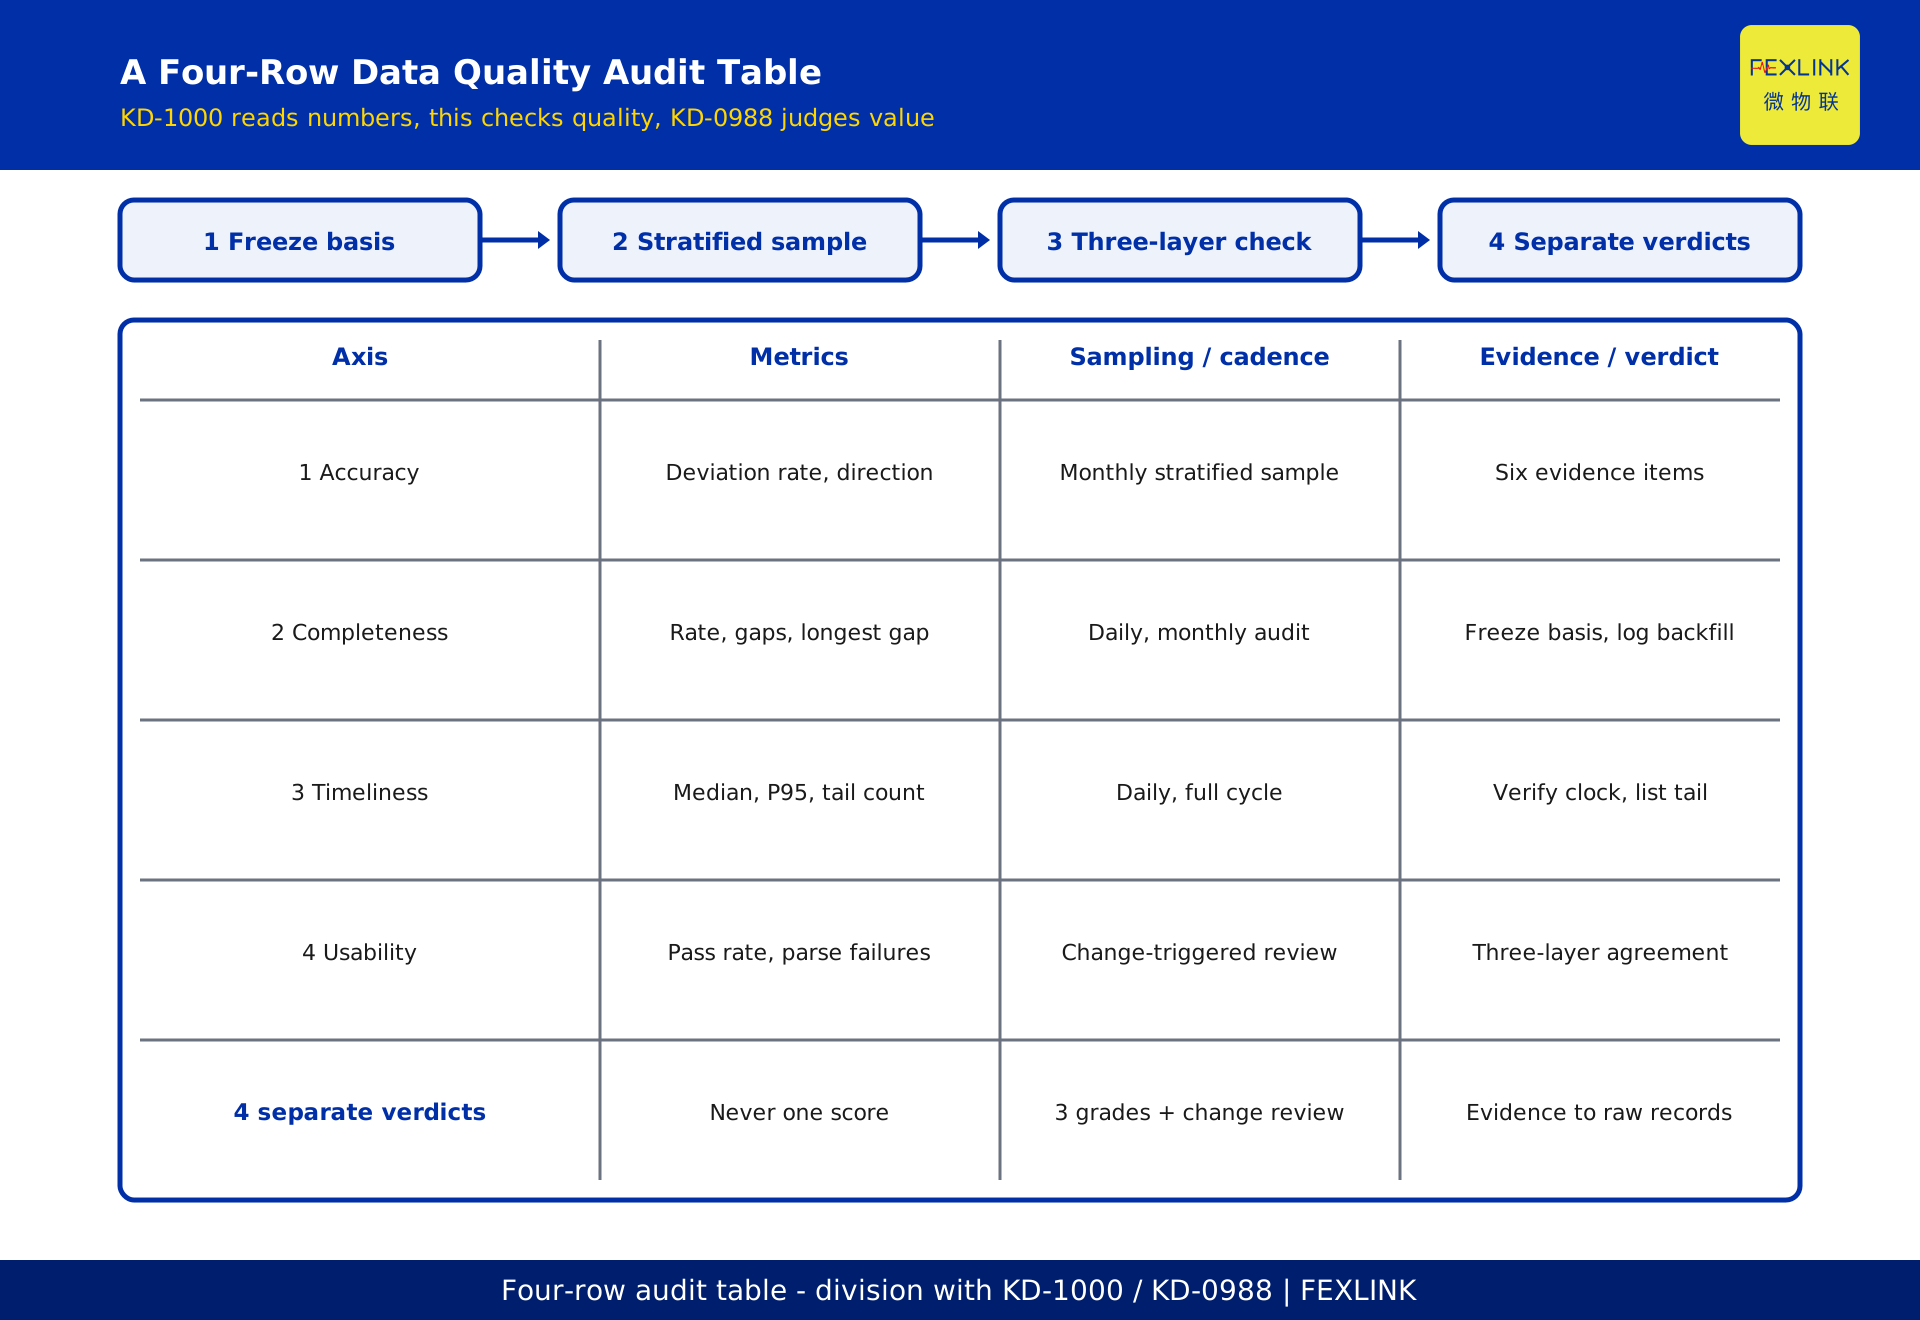
A platform can hold a great deal of data and still produce analyses that never reconcile. The problem is usually not volume but four quality axes never audited separately: accuracy (do readings match the field), completeness (were all expected points collected), timeliness (did data arrive in time), and usability (can downstream models consume format and semantics as-is). An operational audit must give each axis its own metric and verdict rather than the phrase "the data is fine". Failures cannot compensate: wrong accuracy multiplied by more points, missing completeness served faster, or wrong format delivered with low latency still leaves the model unable to read it. Cadence follows the axes - daily automated checks, monthly sampling, change-triggered reviews - backed by a four-row table and an evidence trail. This is a technical data-quality self-audit, not a guide to reading operational report numbers or to management value KPIs.
1. Why "The Data Is Fine" Is Not an Actionable Conclusion
"The data is fine" cannot be accepted, reproduced or acted upon: it has no denominator, no sample, no decision basis, and no way to trace which link failed first.
Three illusions feed it. Volume as quality: many points mean broad coverage, not credible values. Stability as correctness: a smooth curve proves a stable chain, and a wrong multiplier at source yields a stable wrong value. Ingestion as usability: rows land in a database, but mismatched time zone, point coding or enumerated domains simply move the error later in the pipeline.
2. Four Axes Answer Different Questions and Must Not Be Merged Into One Score
| Axis | Question answered | Typical failure | Why another axis cannot compensate |
|---|---|---|---|
| Accuracy | Does a reading match a traceable reference | Smooth curve biased high or low | More points only replicate the same bias |
| Completeness | How many expected points arrived | Whole gateway or circuit missing | Faster transport never creates missing points |
| Timeliness | Delay from field generation to platform availability | Long-tail samples arriving very late | Complete but late data misses the handling window |
| Usability | Can downstream read format and semantics | Wrong unit scale, time zone, coding | With the first three green, the model still misreads |
The four axes have different failure modes, owners and remedies, so a weighted "data quality score" is the wrong instrument. Three passing axes bury one failing axis, leaving a respectable number and an unusable analysis. Separate verdicts also point directly at the responsible segment.
No universal threshold is set here either: point scale, collection interval, business use and risk baseline vary too widely. Freeze the decision basis and denominator first, then use the first full operating month as a reference and read direction.
3. Accuracy: Auditing Measurement Error and Sample Deviation
Accuracy is not a vague feeling about precision. It is whether, at the same instant and the same measurement point, the platform reading stays within an agreed range of a traceable independent reference. That range is frozen by the project owner in a basis document; this article gives no numeric limit.
Three metrics: the ratio of sampled points outside the range to the total sampled; the direction of deviation, meaning whether it is persistently one-sided; and the count of checks on multipliers, ranges and unit settings. One-sided deviation usually points to configuration or wiring; random two-sided deviation more often comes from the reference or from misaligned comparison instants.
Sampling must be stratified across high and light load, circuits and channels, including night and switchover periods; picking only points that "look normal" excludes the highest-risk samples. Six items belong in evidence: reference source, comparison instant, ambient conditions, verdict, reviewer and remediation.
The classic mistake is treating agreement with the platform's own history as accuracy: same-source comparison proves stability, not correctness.
4. Completeness: Auditing Point Count and Collection Completeness
The denominator is the expected point count frozen in the point register; the numerator is the number actually collected in the period. Their ratio is collection completeness. The hard part is not the arithmetic but whether the denominator is trustworthy - without a maintained register, completeness means nothing.
Three metrics: collection completeness; the distribution of missing points; and the longest continuous gap. Gaps concentrated on one gateway or fixed time window point to a local link fault; evenly scattered gaps suggest collection policy, concurrency limits or a changed counting basis. A single global percentage collapses both into "minor gaps".
Three disciplines freeze the denominator: additions, retirements and planned maintenance are logged with a marked break point; shrinking it mid-stream makes completeness improve by itself; backfilled values must not count as in-period collection. Two inflations are counting only rows already in the platform, and treating duplicate uploads as multiple points.
5. Timeliness: Auditing Data Latency
Timeliness is the interval between generation in the field and availability on the platform, and it presupposes a common clock or completed time synchronisation at both ends. Otherwise the latency figure itself is untrustworthy; verifying the clock comes before computing percentiles.
Three metrics: median latency, P95 and the count of extreme long-tail samples, by collection channel rather than one global value. The median describes the norm; P95 and the tail describe congestion, retransmission and switchover - the cases that break analysis jobs. A mean alone dilutes them into a flattering line.
Sampling must cover a full operating cycle including nights, shift handovers and switchovers; office hours alone understate delay. Three misreadings deserve naming: reporting interval as latency, buffered backfill as real-time arrival, and clock-skew outliers dropped without a trace.
6. Usability: Auditing Format Alignment and Model Consumption
This is the axis most often omitted, and the one that can make the first three a waste of effort. It asks not whether data was ingested but whether downstream can read it as intended. The checklist has at least six classes: timestamp and time zone, unit and multiplier, point naming and coding, enumerated value domains, missing-value representation, and data contract version.
Three metrics: format validation pass rate, number of inconsistency classes hit, and model-side parse failures plus fallback records. Zero parse failures does not mean a pass - kW changed to W, a shifted time zone, or nulls written as zero all ingest cleanly while the scale or meaning of a curve is wrong. That is a silent failure.
Sampling here is change-driven: after a point-table update, firmware upgrade, gateway replacement, interval change, model release or platform expansion, compare the same point batch before and after. Daily checks cannot catch silent failures - they never appear as gaps or delays.
The working test is "three-layer agreement": compare the device raw value, the edge forwarded value and the platform stored value at one instant, point by point, then let the model read it once. All three matching and the model reading correctly is the pass condition - still required when the other three axes are green.
7. The Audit Cadence: Daily Checks, Monthly Sampling, Change-Triggered Reviews
| Cadence | Axes | Main action | Output | Reviewer |
|---|---|---|---|---|
| Daily automated check | Completeness, timeliness | Run gap and latency statistics, push exceptions to duty staff | Inspection log | Duty and operations |
| Monthly manual sampling | Accuracy, completeness denominator | Stratified comparison, point register reconciliation | Sampling report | Data owner |
| Change-triggered review | Usability first, all four regressed | Compare the same point batch before and after | Change comparison sheet | Change owner and data owner |
| Quarterly review | Trends on all four | Read direction, close remediation, refresh the basis | Review minutes | Project owner |
Three disciplines matter more than frequency: give each axis its own verdict (pass, watch, fail) and never merge them; freeze the denominator and basis, logging changes and marking break points; keep evidence traceable to raw records. Frequency stays low - daily checks are automated, sampling is monthly, reviews are event-driven.
8. A Reproducible, De-Identified Example
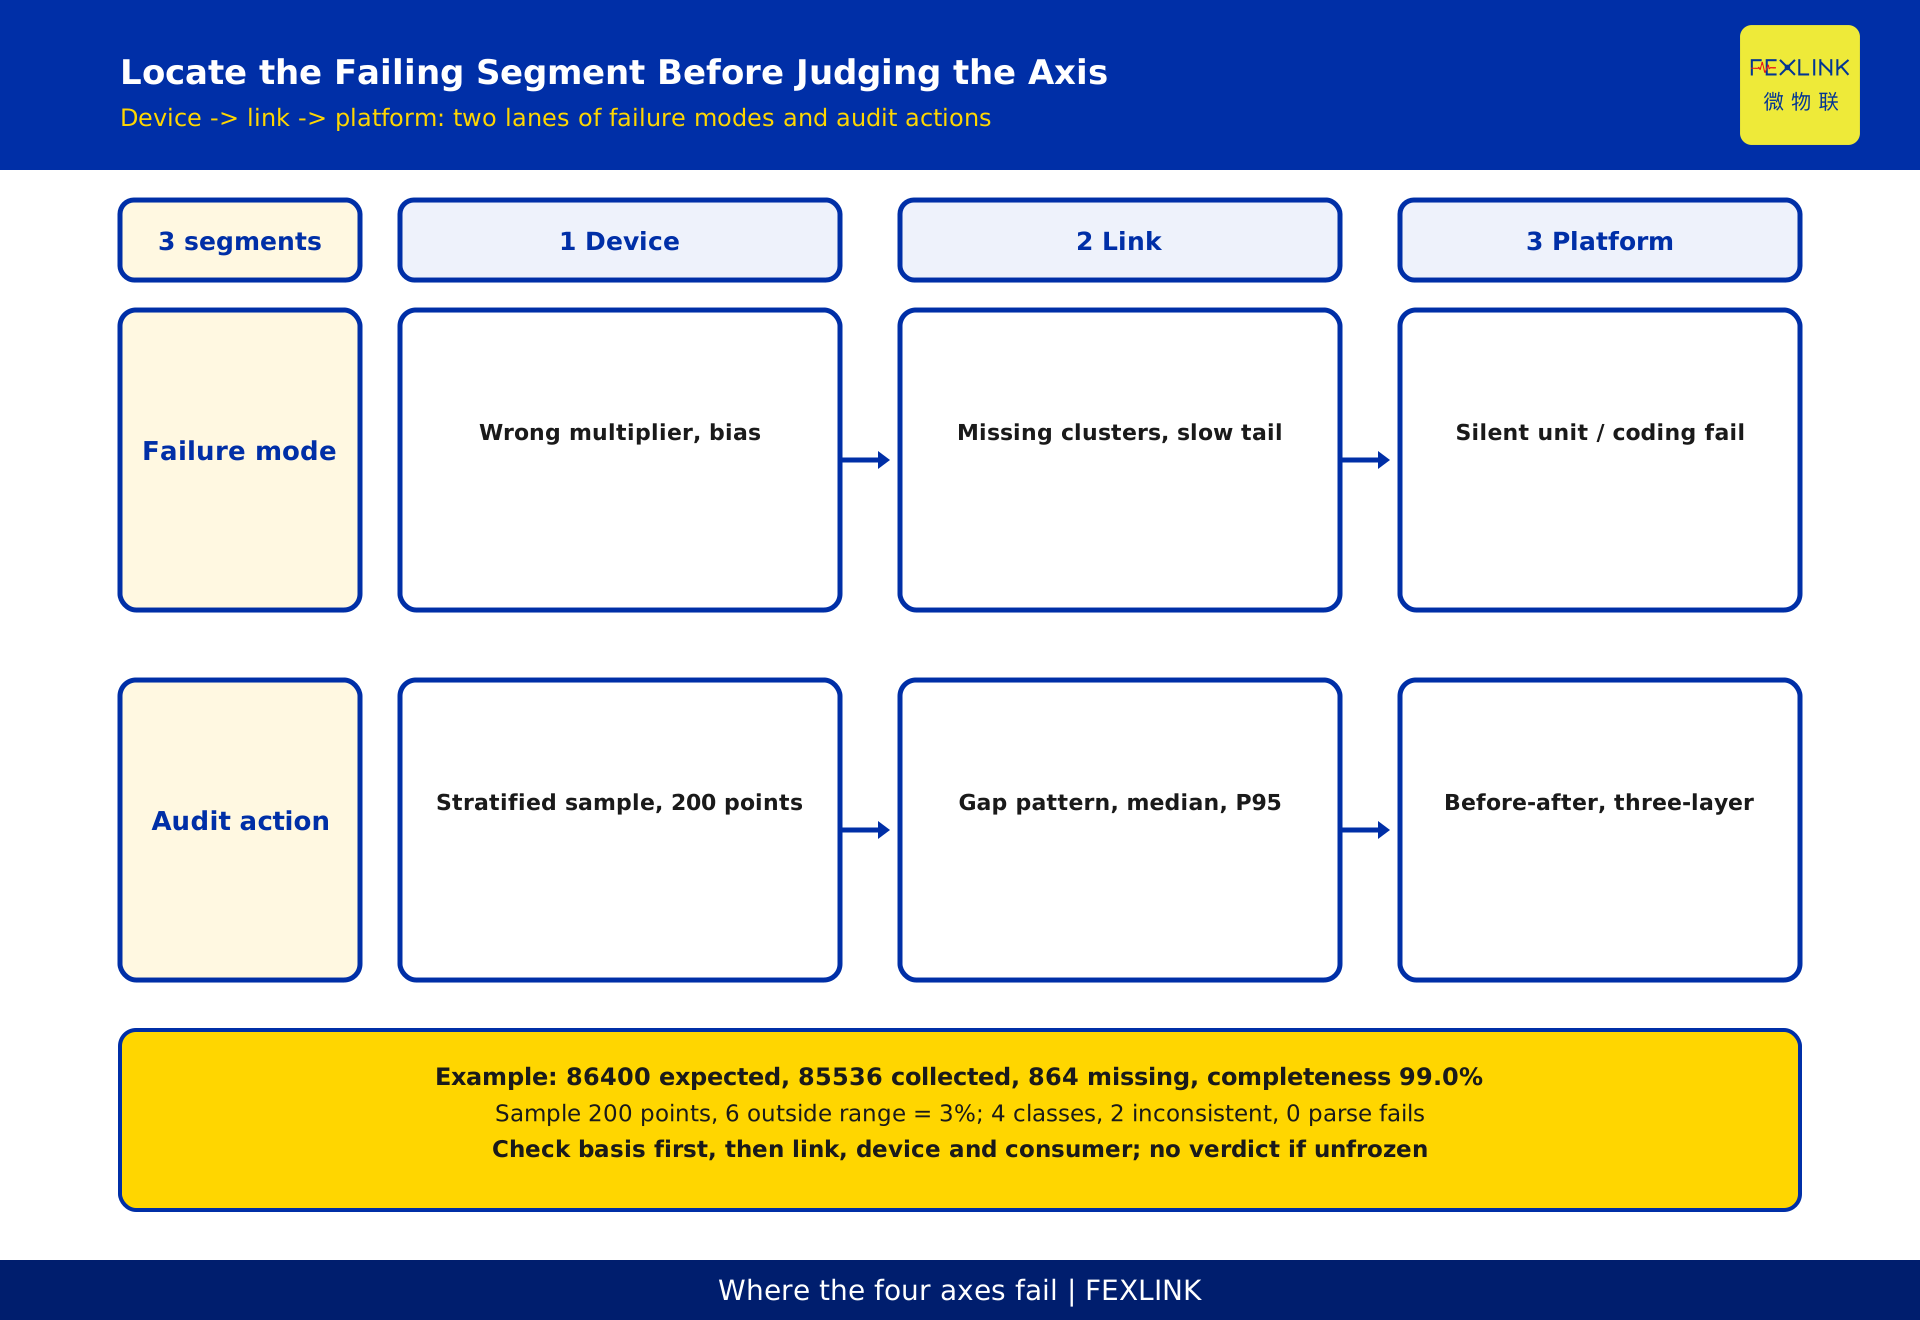
All numbers below are constructed illustrations, not any real project, and they correspond to no threshold. In one month the frozen register holds 86400 expected points; 85536 were collected, leaving 864 missing, so collection completeness is 99.0% (85536 / 86400 = 0.99). Median latency was 2 seconds, P95 18 seconds, with 3 extreme tail samples listed separately. A stratified sample of 200 points found 6 outside the agreed range, or 3% (6 / 200). Format validation covered 4 classes and hit 2 inconsistencies - timestamp time zone and unit multiplier. Model-side parse failures were 0, yet the curve scale needs rechecking.
Separate verdicts give four rows: completeness - watch, the 864 gaps need a gateway check; timeliness - pass, with 3 tail samples listed; accuracy - pass, with 6 deviations needing reference review; usability - fail, with 2 inconsistency classes to fix. Weighted into one score, the first three bury the fourth.
Parse failures of 0 and a usability fail can coexist, so this axis cannot be judged by error counts alone.
9. Locating the Cause of Quality Degradation
Fix the order at four steps: basis and denominator first, then the link, then the device, then the consumer.
Check basis first: has the point table, decision rule or counting scope changed, or has backfill occurred? Basis problems are cheapest and most common; excluding them prevents a statistical change being misread as equipment degradation. Then check gateway state, congestion, time sync and retransmission; then wiring, multipliers and sampling settings; finally contract version, units, time zone, coding and model version.
For cross-segment problems, the first layer where three-layer agreement diverges is the responsible segment. Three prohibitions: no conclusion while the basis is unfrozen; no recomputing history after backfill; no collapsing four remediation tracks into "data optimised".
10. Division of Labour With KD-1000 and KD-0988
All three articles discuss operational numbers from different angles. KD-1000 is a reading guide for completeness, collection resolution and reporting latency. KD-0988 is a management value KPI set covering alarm closure rate, handling time, failure trend and a monthly board. This article is a technical data-quality audit.
Two boundaries are fixed: the banded reading of completeness or latency is not repeated here, only cited as the metrics of two rows; alarm closure rate, tickets and outcome metrics are not expanded. The increment is the accuracy and usability axes, the no-compensation judgement, and the three-tier cadence. Read together: read numbers correctly, confirm trustworthiness, then discuss value.
Frequently Asked Questions (FAQ)
Q: Can the four axes be merged into one data-quality score for reporting?
A: A reference figure may sit in an appendix, but the main table must keep four independent verdicts. Merging lets one failing axis be buried, and a falling score no longer tells you whether to inspect the device, link or consumer.
Q: A project has just gone live with no first full operating month to compare against. What then?
A: Freeze the basis and denominator, reconcile the point register, and set the first month as reference. Until three months accumulate, report direction and watch items only. Prioritise the completeness denominator and the six usability classes over trend reading.
Q: Should sampled deviation have a single universal limit?
A: This article gives none. The range should be frozen by the project owner against point purpose, reference availability and business tolerance, with changes logged. One generic percentage misjudges points serving very different purposes.
Q: Completeness is high, so why do analyses still fail to reconcile?
A: Work the four steps: check basis and denominator, then link backfill, then device multipliers and wiring, then consumer units, time zone and coding. High completeness clears only that one axis; silent failures happen on accuracy and usability.
Q: How often is a change-triggered review run, and who triggers it?
A: By event, not by calendar. Any of six events - point-table update, firmware upgrade, gateway replacement, interval change, model release or platform expansion - prompts the change owner and data owner to run a before-and-after comparison. With no change, a light regression rides with the monthly sample.
Scope and Limitations
This article applies to live electrical-safety, energy and smart-monitoring projects that already have a point register, collection statistics and a downstream analysis or model consumer. It helps operators and data owners design a periodic audit table and an evidence trail; pilot projects may keep only the completeness and usability rows. It is not a template for tender documents or contract clauses.
Limitations: the four-axis split, metrics, cadence, table and example are generic illustrations representing no enterprise's appraisal criteria. The constructed quantities 86400, 85536, 864, 99.0%, 2 seconds, 18 seconds, 3 tail samples, 200 points, 6 points, 3%, 4 classes, 2 classes and 0 failures involve no product model, parameter, price or point scale; no standard number or clause is cited; no effect-type commitment such as accuracy rate, energy-saving rate or payback period is given. No universal threshold is set - the decision basis should be frozen by the project owner against the contract, operating procedures and local requirements. The three-layer comparison borrows FEXLINK's general device-edge-cloud layering only as a responsibility analogy, not a selection or compliance commitment. All cases are de-identified.
Frequently Asked Questions
Data Quality on Four Axes
A platform can hold a great deal of data and still produce analyses that never reconcile