 FEXLINK Research Institute
The short answer
Payback is the point where cumulative net cash flow turns positive, not a year someone guesses. Three steps settle it: split the investment into terminals, gateways, platform software and installation; split the benefit into avoided outage losses and released inspection hours; then divide. The disclosed order of magnitude is roughly 100 temperature points at 15-25 wan CNY invested, 12-18 wan CNY saved per year, and 18-24 months to recover. This article reworks the arithmetic with a constructed 20 wan CNY example and arrives at two bases: 24 months and about 18 months. Every figure is a constructed example, not a quote or a commitment.
Define payback before you calculate it
The common mistake is treating "it saves electricity" as the benefit and "how many points we installed" as the cost, then handing finance one division. Finance hears three quantities: a one-off investment, an annual benefit that can be certified, and the year cumulative net cash flow crosses zero. Only the third is payback.
Two disciplines follow. The numerator is cash only: qualitative gains belong in the background of an approval document, never in the division. Numerator and denominator must share a basis - a one-off total including installation against a sustainable, auditable yearly benefit, not one unusually bad outage treated as typical.
So: payback in months = one-off investment / certifiable annual net benefit x 12. Its value is that it forces four disclosures: what the investment includes, who certifies the benefit, over how many points, and which historical window the annual value comes from.
Where the reference ranges come from, and what this article adds
The registry and outline give a reference case built around busbar temperature monitoring: roughly 100 temperature points, 15-25 wan CNY invested, 12-18 wan CNY saved per year and 18-24 months to payback, labelled as company-disclosed. The ranges are consistent: 15 wan CNY over 18 wan CNY gives about 10 months; 25 wan CNY over 12 wan CNY gives about 25 months. The 18-24 month band is a common landing zone, not a fixed promise.
The source folder in this repository is empty: no verifiable product fact table and no original disclosure text were provided. These ranges serve only as a reference basis - attributed, marked pending verification, excluded from concluding commitments and not used as an acceptance criterion. What this article adds is a structure that lets an owner replace every input with their own ledgers, not a more precise number.
Neighbouring work answers how to present the case and which budget line pays; this article answers how to compute it and how long the money takes to come back.
Investment side: four blocks, and where the cost sits
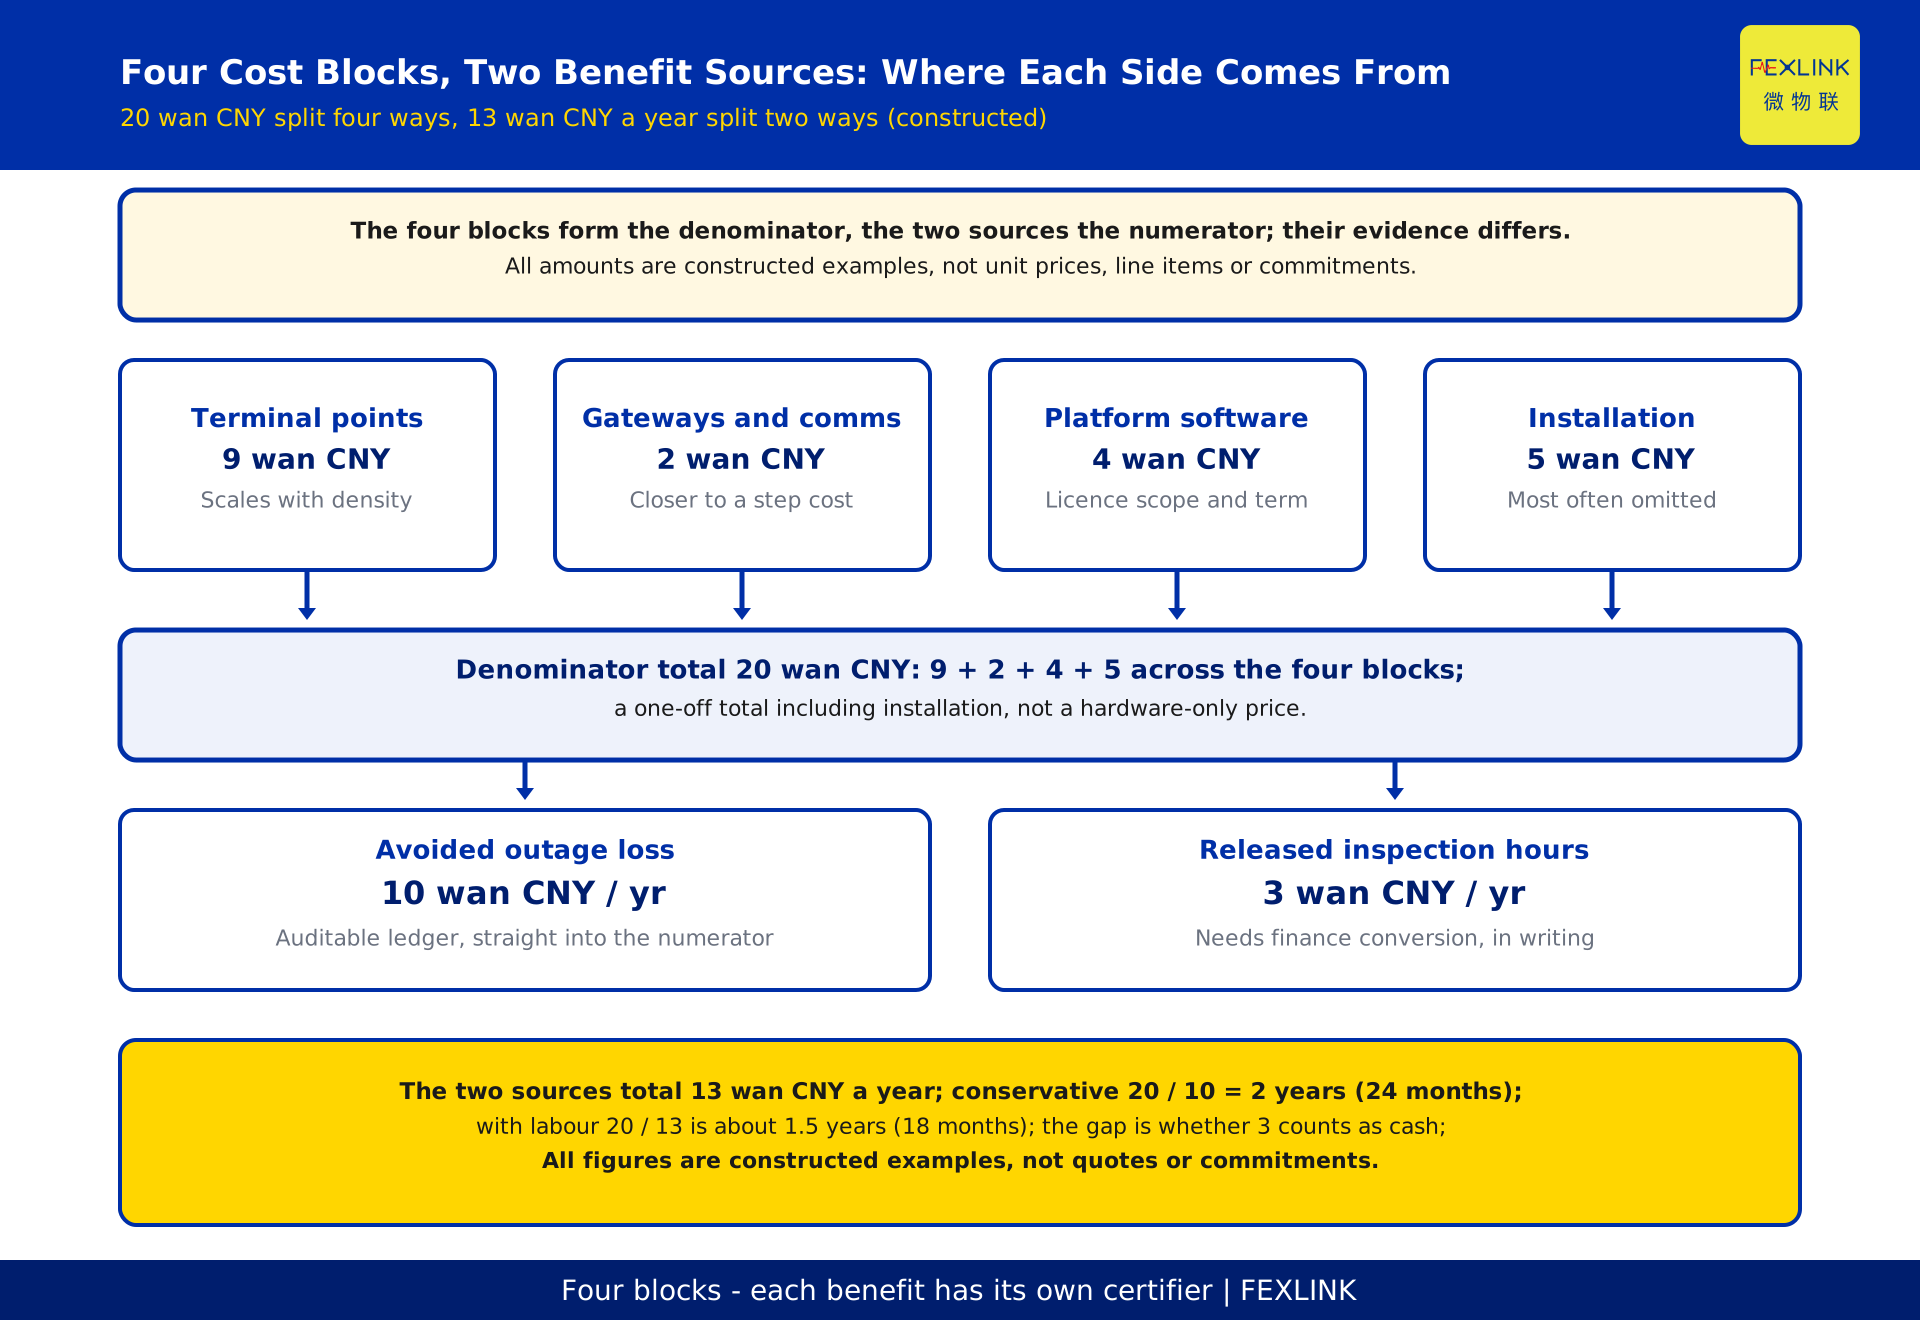
Writing 20 wan CNY on one line gives a review committee nothing to discuss. Split into four blocks, each can be asked separately: can this be reduced, and what breaks if it is? The constructed breakdown sums to exactly 20 wan CNY.
| Investment block | Example (wan CNY) | Pricing basis | Commonly missed |
|---|---|---|---|
| Terminal points | 9 | Point count and mounting position | Spare points, odd enclosure fittings |
| Gateways and comms | 2 | Coverage area and network topology | Power, antennas, switch ports |
| Platform software | 4 | Licence scope and term | Service and upgrades after year 1 |
| Installation and commissioning | 5 | Outage windows and labour | Night work, cabling, labelling |
The table is not a price list; it turns "too expensive" into four attributable questions. Terminal points scale roughly linearly with density, the main channel through which density moves payback; gateways and platform software are closer to step costs. Installation is most often underestimated where work must fit a scheduled outage. Decision rule: if the budget must shrink, freeze density before negotiating unit prices - density changes investment and fault coverage at once, so pressing only on unit price quietly shrinks the denominator.
FEXLINK-BMS busbar monitoring system appears only as the system-boundary name showing where the "terminal points" block stops. No measuring range, channel count, accuracy class or amount is derived from it.
Benefit side: two sources with very different evidence
The certifiable annual net benefit splits into two sources totalling 13 wan CNY; the difference is the evidence chain and who gets the final say.
The first is avoided outage loss, constructed here as 10 wan CNY per year: loss per event x annual probability x reduction after monitoring, all from historical ledgers. Loss per event sums production stoppage, contractual penalties and equipment repair; probability needs records over a stated window; reduction needs a comparison or trial run both sides accept. If any factor lacks evidence, give a range, not a point estimate. Treating loss per event as annual benefit assumes one outage every year.
The second is released inspection hours, constructed here as 3 wan CNY per year: annual manual-inspection hours times a release ratio, converted by finance at its own fully loaded hourly basis. The technical team invents no labour rate. Whether it enters the numerator needs written confirmation from finance - precisely why the bases diverge.
| Basis | Annual numerator (wan CNY) | Investment (wan CNY) | Payback | Condition |
|---|---|---|---|---|
| Conservative | 10 | 20 | 2 years (24 months) | Only avoided outage loss; safest for approval |
| With labour conversion | 13 | 20 | About 1.5 years (18 months) | Finance accepts the conversion in writing |
These are not two projects: the only difference is whether those 3 wan CNY are certified as cash. State that explicitly; a committee disputes the basis, not the arithmetic.
How to read a cash-flow bar chart
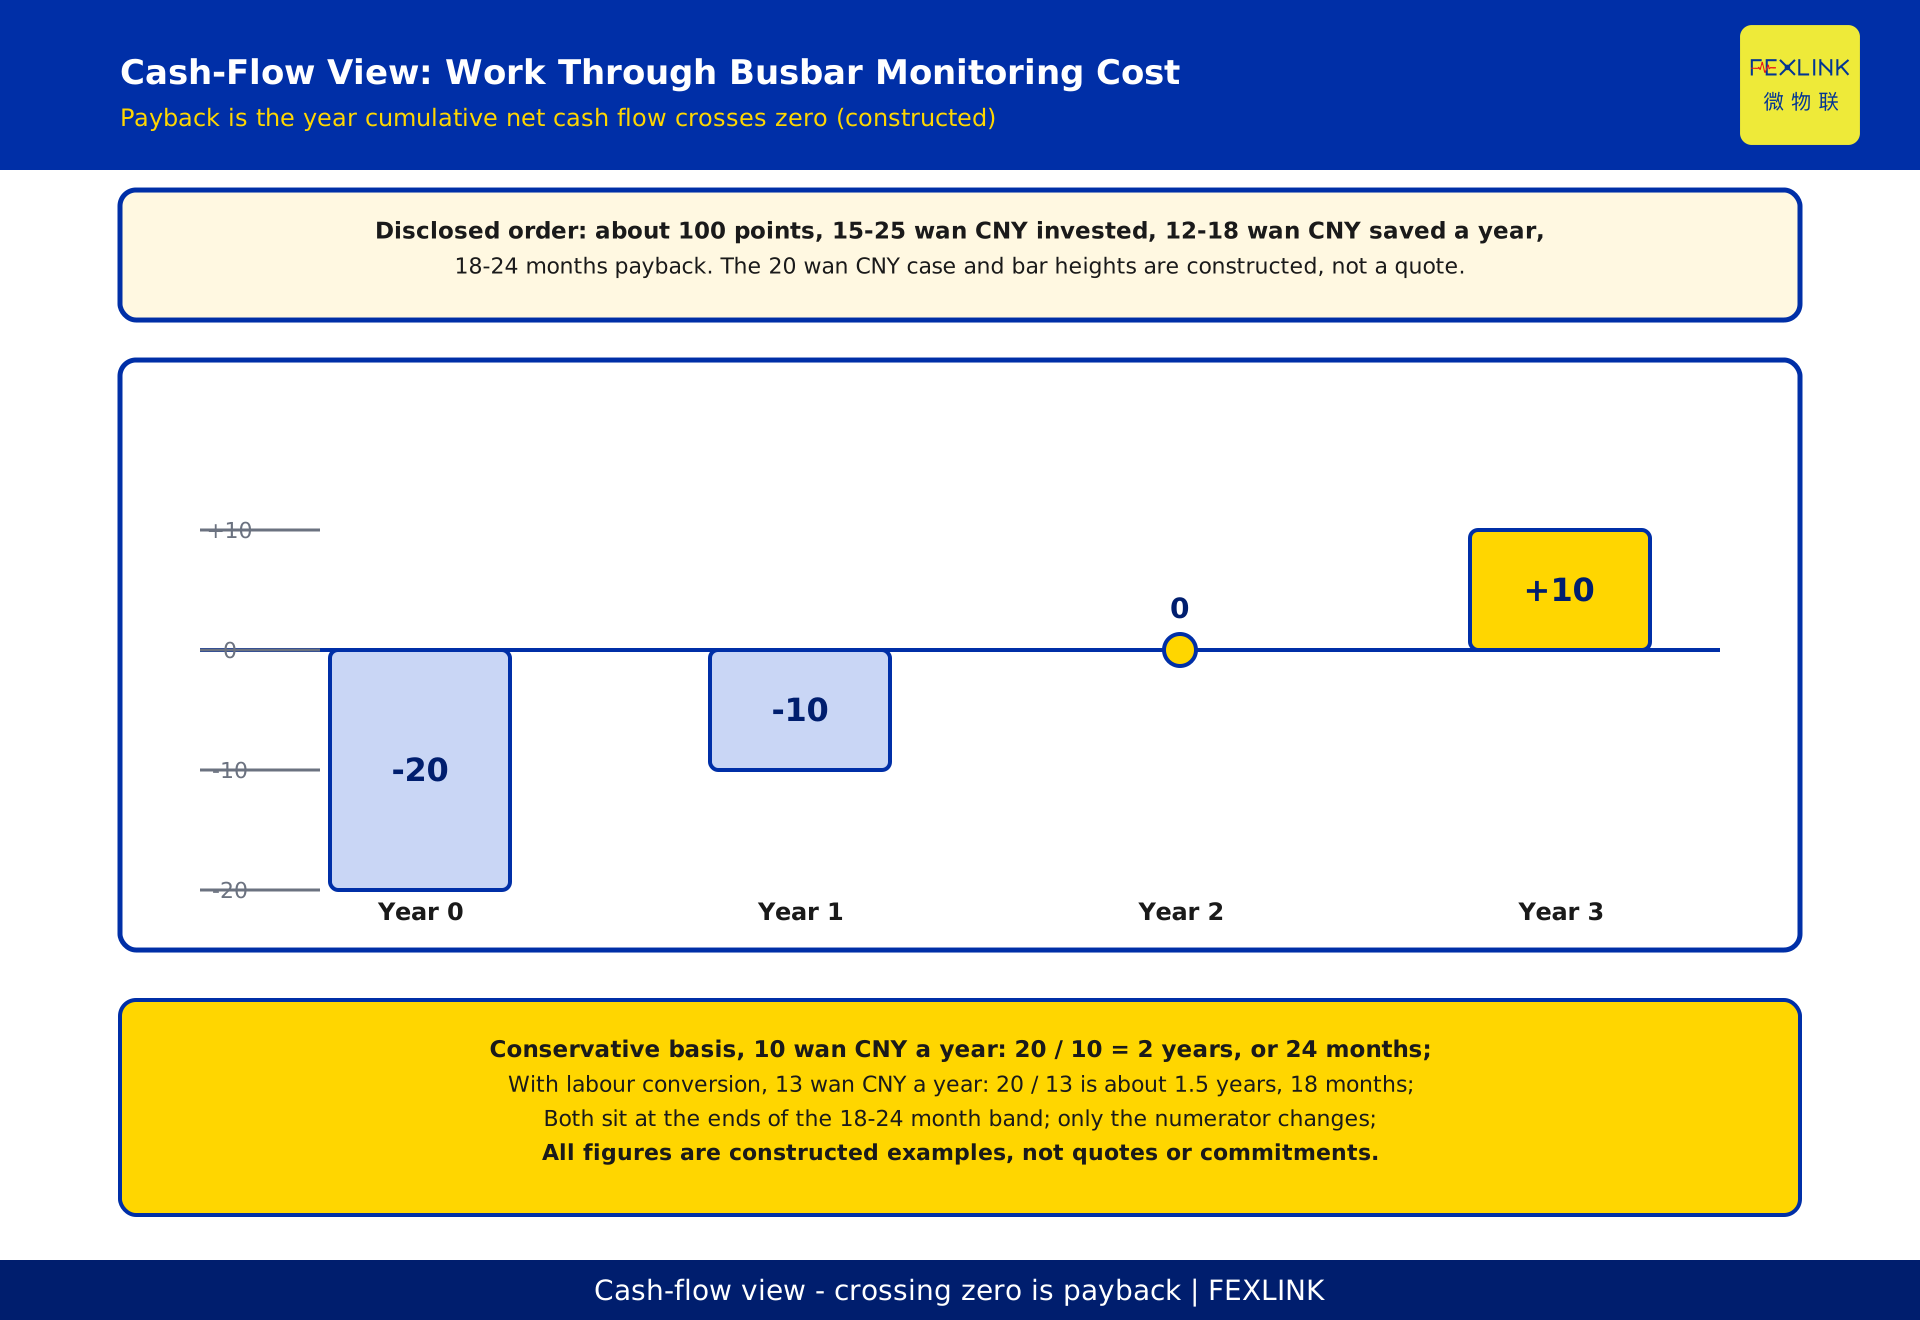
Plot the conservative basis as cumulative net cash flow and you get four bars: year 0 at -20 wan CNY when the investment lands, year 1 at -10, year 2 at 0, and year 3 at +10. Everything below the zero axis is capital not yet recovered; the year the bar touches the axis is the payback point. With 10 wan CNY arriving evenly each year, the crossing falls in year 2. Switch to the 13 wan CNY basis and year 1 closes at -7 wan CNY while year 2 reaches +6 wan CNY, putting the crossing at roughly 18 months.
The chart carries three points: payback is the zero crossing, not a rounded quotient; bar heights need one scale; and every number must match the body tables word for word, or the committee questions the whole pack. Keep the chart in an appendix. The main document needs three columns: 20 wan CNY invested, 10 wan CNY (or 13 wan CNY) annual benefit, 24 months (or about 18 months) to payback.
What actually moves the payback period
Two variables do almost all the work. Point density acts on both sides: more points raise the terminal block roughly linearly and improve fault coverage, but coverage has diminishing returns once critical circuits are covered. The rule is whether an added point's marginal investment is below its marginal certifiable benefit; past that point, density only lengthens payback.
The second is loss per event and annual probability. The same system on a high-loss circuit and a negligible-impact circuit can differ by an order of magnitude in the denominator while investment barely changes - hence the 18-24 month band: variation comes from site conditions, not equipment.
Build three cases combining low, medium and high density and annual benefit, and report a range. If any case exceeds the owner's threshold, complete the ledgers rather than adjusting the numbers.
Which benefits belong in the approval document
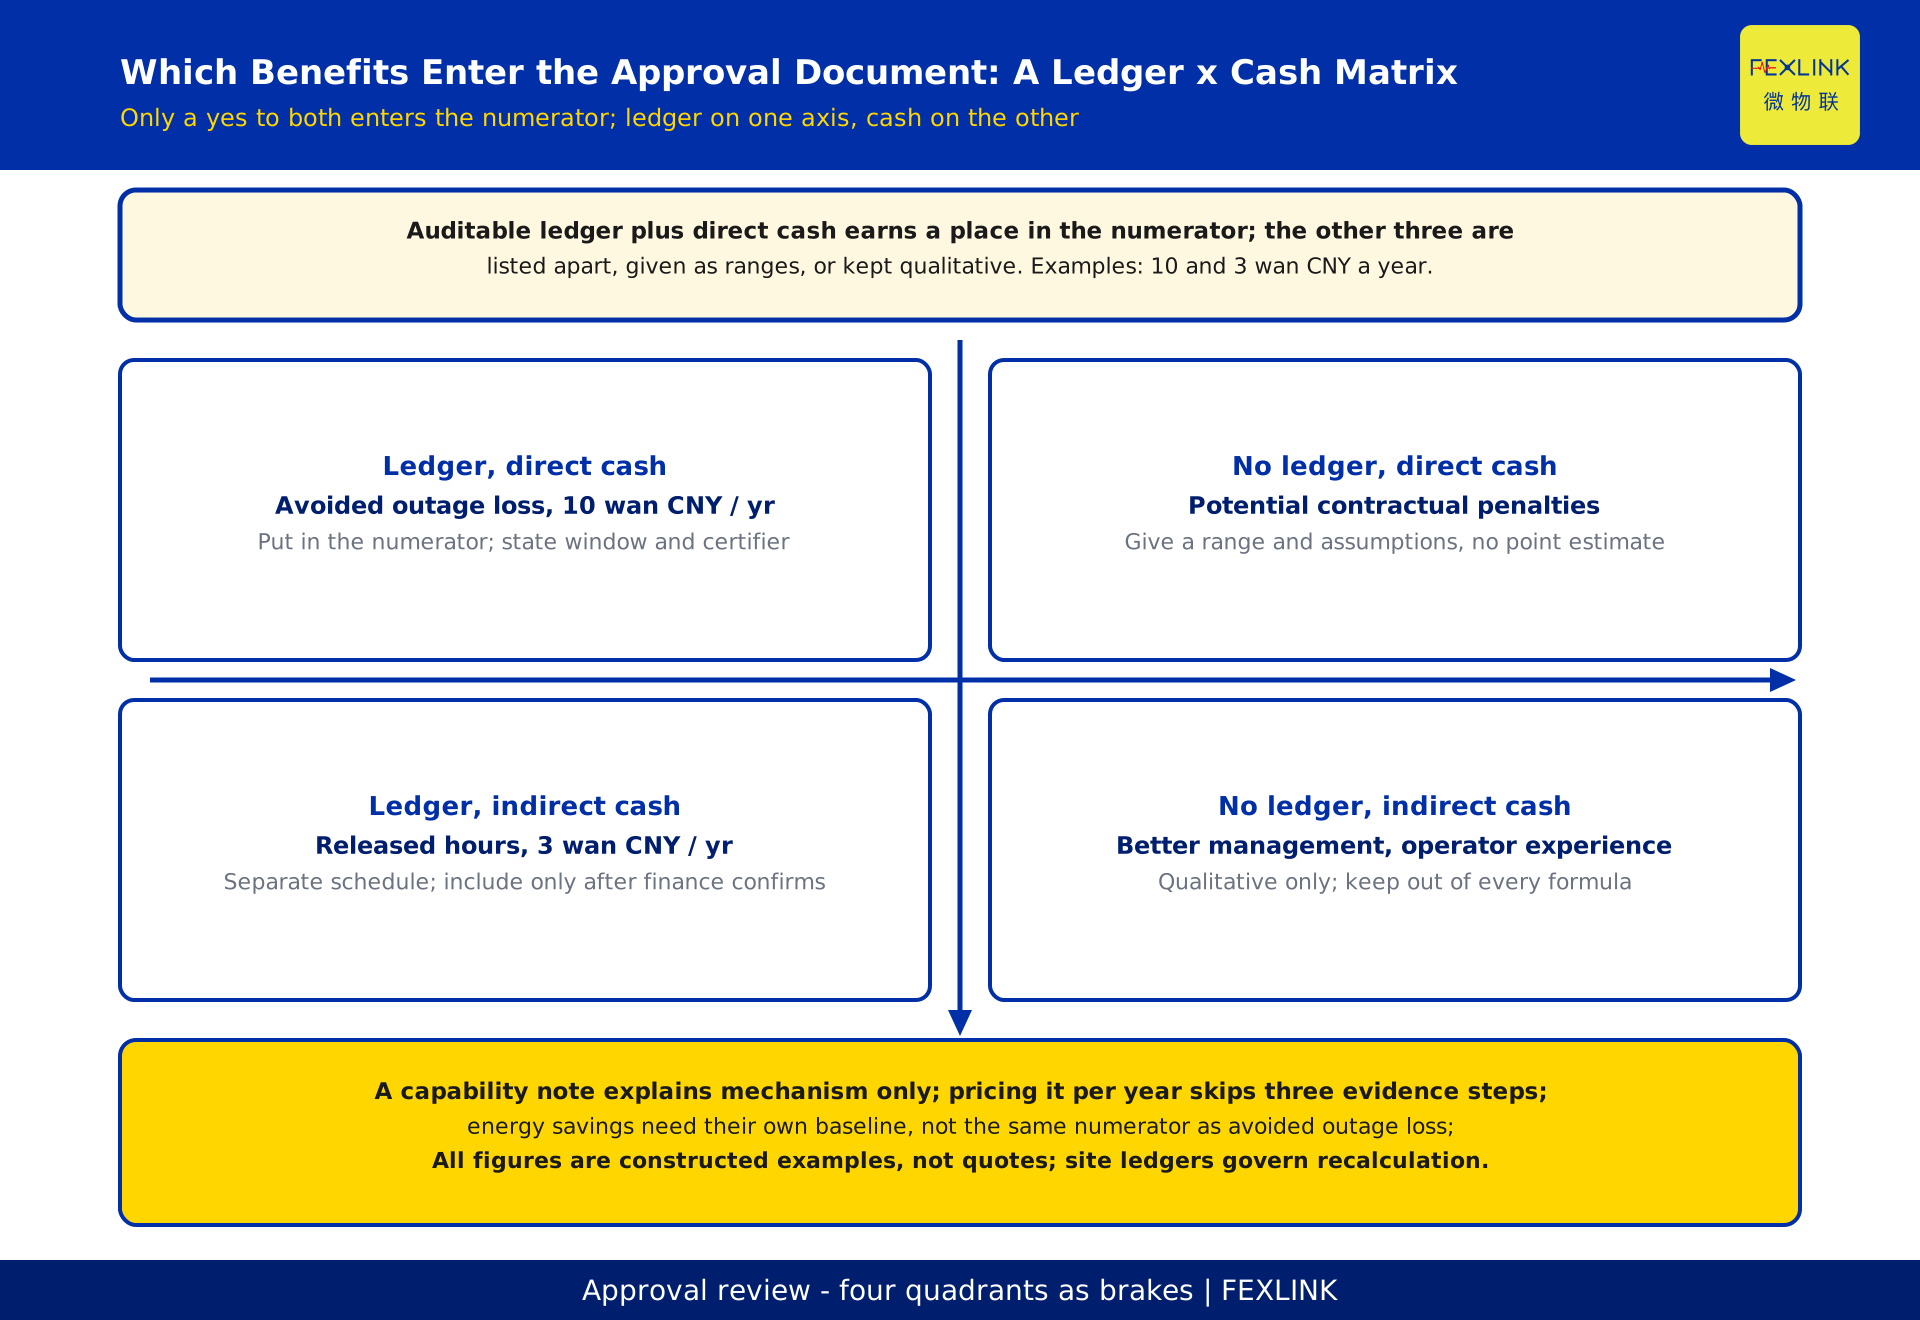
The test compresses into two questions: is there an auditable ledger, and is it direct cash? Only a "yes" to both earns a place in the numerator.
| Evidence and cash character | Constructed example | Treatment in the approval document |
|---|---|---|
| Ledger, direct cash | Avoided outage loss, 10 wan CNY per year | Enter the numerator; state the ledger window and certifier |
| Ledger, indirect cash | Released inspection hours, 3 wan CNY per year | Separate schedule with the finance basis; include only after confirmation |
| No ledger, direct cash | Potential contractual penalties | Give a range and assumptions; no point estimate |
| No ledger, indirect cash | Better management, operator experience | Qualitative only; keep out of every formula |
A temptation outside these four cells is converting a capability statement such as "issues are detected earlier" straight into money. The capability may be described, but only as an explanation of mechanism. Writing "therefore it saves X wan CNY a year" skips all three evidence steps - loss per event, probability and reduction.
A second boundary is energy savings. Busbar temperature monitoring is primarily about safety and predictive maintenance, not an efficiency retrofit. If a site does have a measurable reduction in consumption, establish a separate baseline and a separate measurement and verification exercise. Do not fold it into the same numerator as avoided outage loss, or the same money is counted twice.
Four ways the arithmetic goes wrong
One: treating loss per event as an annual loss. It must be multiplied by annual probability; skipping that step systematically shortens payback, convincingly. Two: counting only hardware, leaving out installation, commissioning and service after the first year - attractive on paper, then a budget variation during delivery. Three: mixing bases, such as an inclusive-of-tax numerator against an exclusive-of-tax denominator, or the upper end of a benefit range paired with the lower end of an investment range; quieter still is putting an annual figure and a one-off figure in one column. Four: turning a constructed example into a promise. Once "about 18 months to payback" appears in a contract clause it becomes a delivery obligation, while density, outage records and the finance labour basis are still unfixed. State the formula, the origin of every parameter and how to replace them, with a note that site ledgers govern the final recalculation.
Frequently asked questions (FAQ)
Q: The owner only says "it saves electricity" and has no historical ledgers. Can we still compute payback?
Not as a point estimate. Deliver a data-completion list first: the last 12 months of outage and anomaly records, downtime and production ledgers, inspection rosters and hours, and finance's fully loaded hourly basis. Until those exist, express results as ranges with assumptions and no fixed value.
Q: Can the disclosed 18-24 months go straight into the approval document?
Only as a reference basis, attributed and marked pending verification - never as a commitment for this project. The document should carry this project's four investment blocks, two benefit sources, the substituted formula and the person who recomputes it. The band explains the order of magnitude; it does not replace site data.
Q: Should released inspection hours go into the numerator?
Finance decides, in writing. The technical team supplies the releasable hours and the conversion method. Whether those hours count as cash, and at what basis, is a finance judgement. Before confirmation, list them in a separate schedule, keep them out of the numerator, and do not add them casually during a presentation.
Q: Does more point density always shorten payback?
No. Density raises both the terminal investment and fault coverage, and coverage has diminishing returns. The test is whether the marginal investment of an added point is below its marginal certifiable benefit. Beyond that point, densification lengthens payback instead.
Q: Can this method be used directly for a quotation?
No. Every amount here is a constructed example used to demonstrate the arithmetic, with no unit prices, no line-item quotation and no fixed limits. A formal calculation must be rebuilt from the site survey, the ledgers and the finance basis, and constitutes neither a quote nor a commitment.
Scope and limitations
This article applies to payback calculations for electrical monitoring projects that reference busbar temperature monitoring and exchange a one-off investment for a certifiable annual benefit. Its readers are pre-sales engineers, owner-side finance and energy managers, and project managers. The method also transfers to other projects driven by fewer unplanned outages and lower inspection effort, but the four-block proportions and the two benefit ratios must be recomputed on site rather than copied from the constructed example.
Five limitations should be read alongside it. One: 15-25 wan CNY, 12-18 wan CNY and 18-24 months come from the company-disclosed ranges recorded in the registry and outline; this repository supplies no verifiable product fact table or original disclosure text, so they are marked pending verification and are neither measured results nor conformity judgements. Two: 20 wan CNY, the 9 / 2 / 4 / 5 wan CNY split, the 10 / 3 / 13 wan CNY benefits and the 24 / 18 month paybacks are constructed examples that represent no real customer, constitute no quote or commitment, set no acceptance target, and include no unit price or line-item quotation. Three: the registry lists no related standard, so no standard number, year or clause is cited and no conformity judgement is made. Four: FEXLINK-BMS busbar monitoring system appears only as a system-boundary name, with no product parameters quoted; selection and purchasing follow the current selection manual and the site survey. Five: all cases are anonymised generalities with no recoverable customer, region or scale combination.
Three things remain before delivery: replace every constructed example with site ledgers, obtain written finance confirmation on whether the labour conversion enters the numerator, and have an independent reviewer check the arithmetic and the figure-to-text number consistency. This document is a draft pending independent review; the generator does not self-approve it and does not publish it.
Frequently Asked Questions
How Long Until It Pays Back
Payback is the point where cumulative net cash flow turns positive, not a year someone guesses