 FEXLINK Research Institute
Direct Answer
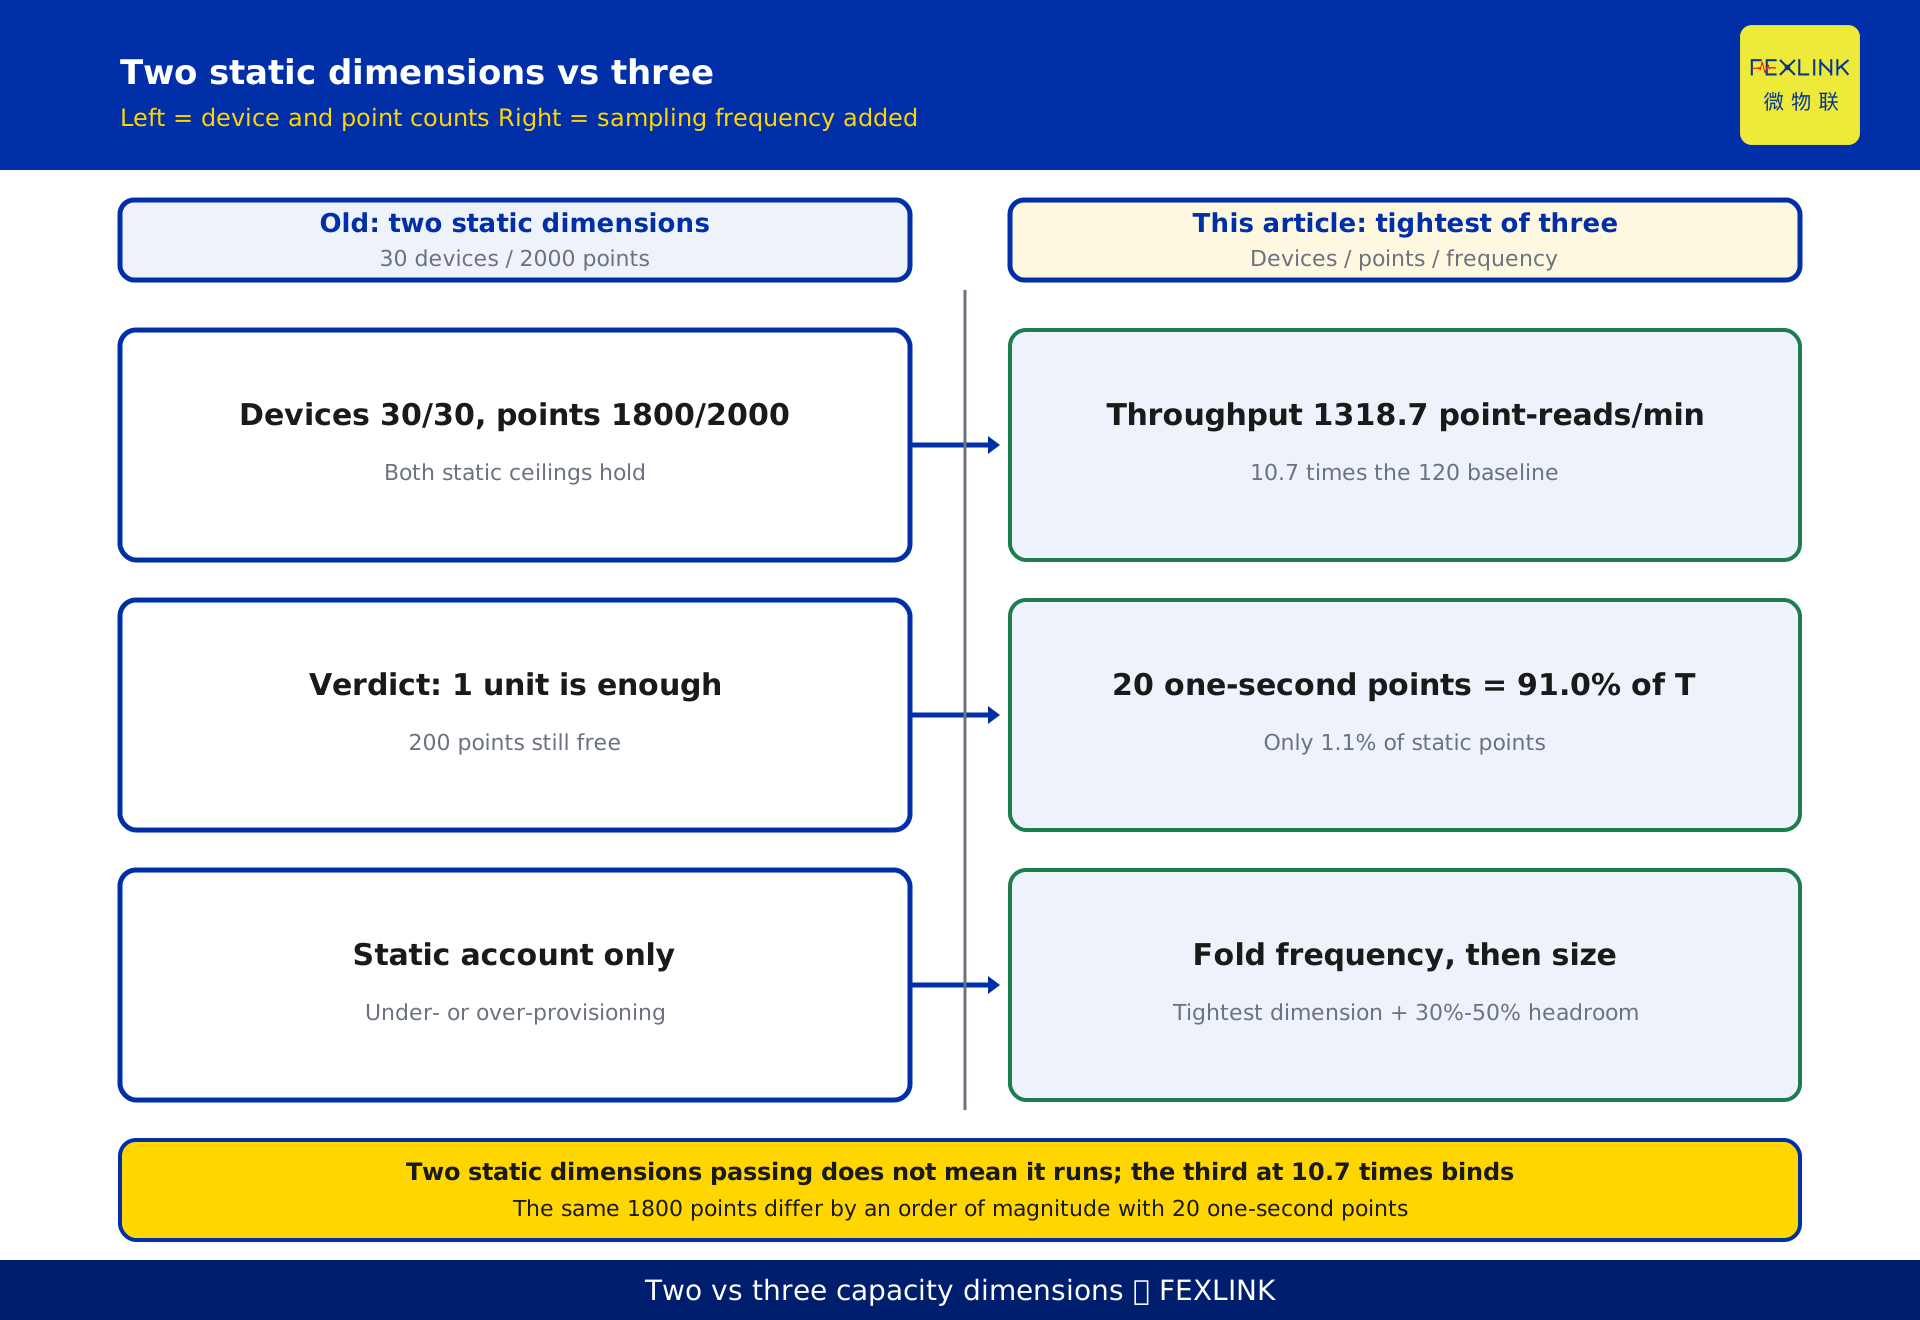
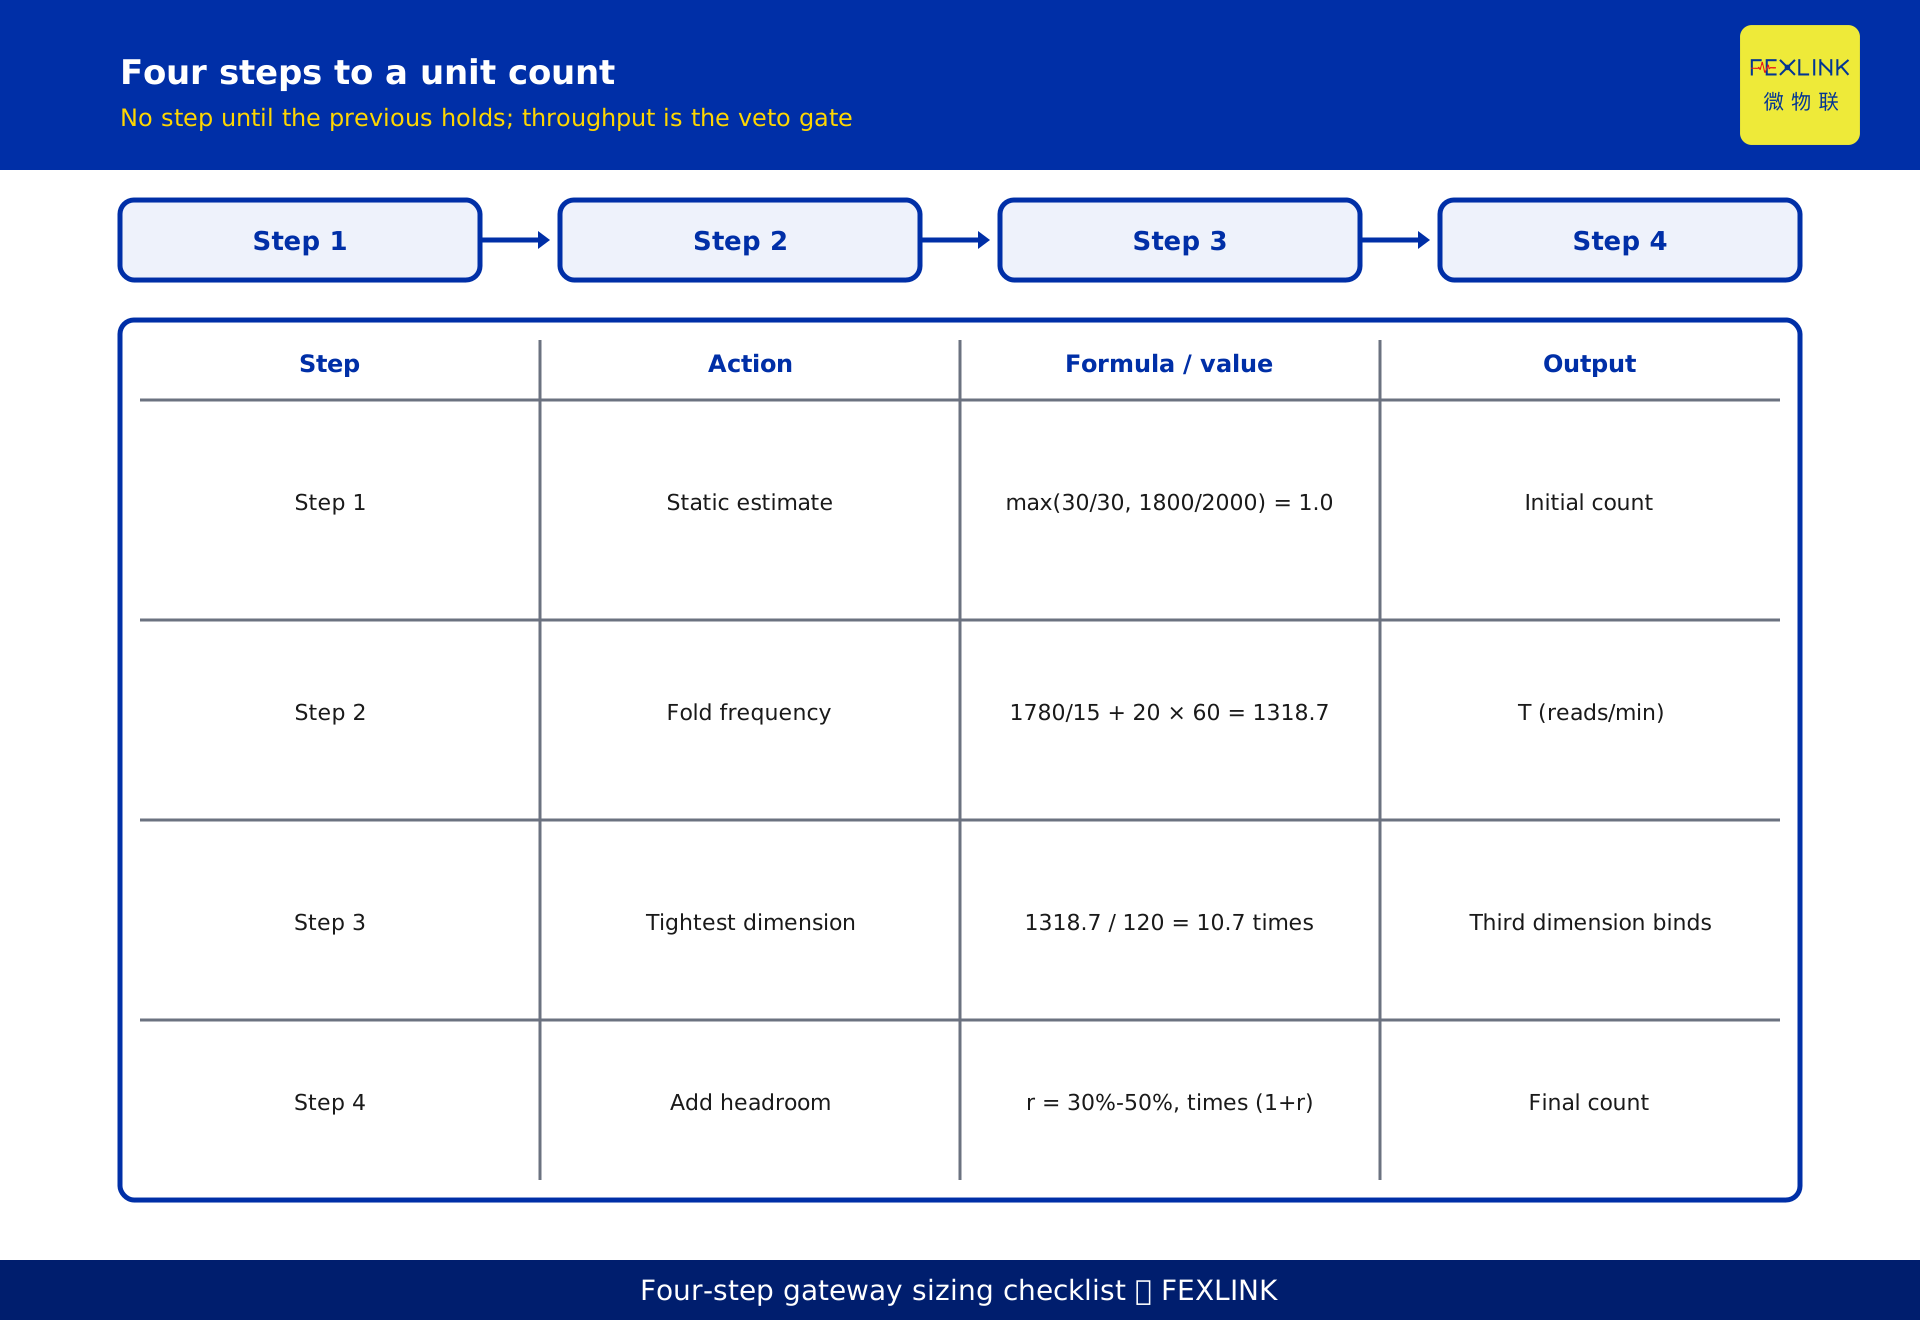
Is 30 devices per gateway enough? Not by counting devices, or even data points. Size a gateway along three dimensions — device count, static point count and sampling frequency — let the tightest one determine the unit count, then add 30%-50% headroom for planned growth. The figures 30 devices / 2000 points are two static ceilings: how large a point table fits, not how often those points are read or how many messages must move per unit of time. Take 30 devices and 1800 points: reading everything once every 15 minutes is modest; mixing in 20 points sampled once per second raises the load by an order of magnitude. Convert every sampling period to a common basis of "point-reads per minute" before deciding whether one gateway is enough.
1. Why "30 devices" is not a capacity answer
The common heuristic is simple arithmetic: "one gateway carries 30 devices, I have 120 meters, so I need 4 gateways." It collapses three distinct questions into one number.
Two opposite errors follow. Under-provisioning: device count and point table are within limits, yet a handful of points sampled every second saturate the polling queue and uplink, so the platform cannot refresh until acceptance testing reveals it. Over-provisioning: almost every point is a 15-minute energy total, but headroom is piled on for a worst case that never arrives.
Both share one root cause: "how many can be connected" is treated as "how many can be sustained". Device count and point-table size are a static account; sampling frequency is a time account that decides whether the configuration runs once fitted. Size on the static account alone and the answer is biased.
2. Three dimensions: device count, static points, sampling frequency
Split capacity into three dimensions, each governing one thing.
Device count D. The ceiling on devices one gateway can attach, commonly referenced at the 30-device level.
Static point count P. Total data points in the point table, referenced at the 2000-point level. It depends on how each device expands into voltage, current, power, energy and harmonic parameters; that estimation is in KD-0474 and is not repeated here.
Sampling frequency F, and the throughput T derived from it. Periods differ by orders of magnitude: 15 minutes suffices for energy totals, 1 minute may be needed for demand or load curves, and transient records, harmonic snapshots or event-triggered values may reach 1 second. Frequency is the multiplier that turns a static point count into message volume per unit time.
The three cannot be exchanged or added; the third measures how often the first two are turned over.
3. Computing the third dimension: point-reads per minute
Convert each point's sampling period into reads per minute f, then compute T = Σ(points × f) in "point-reads per minute".
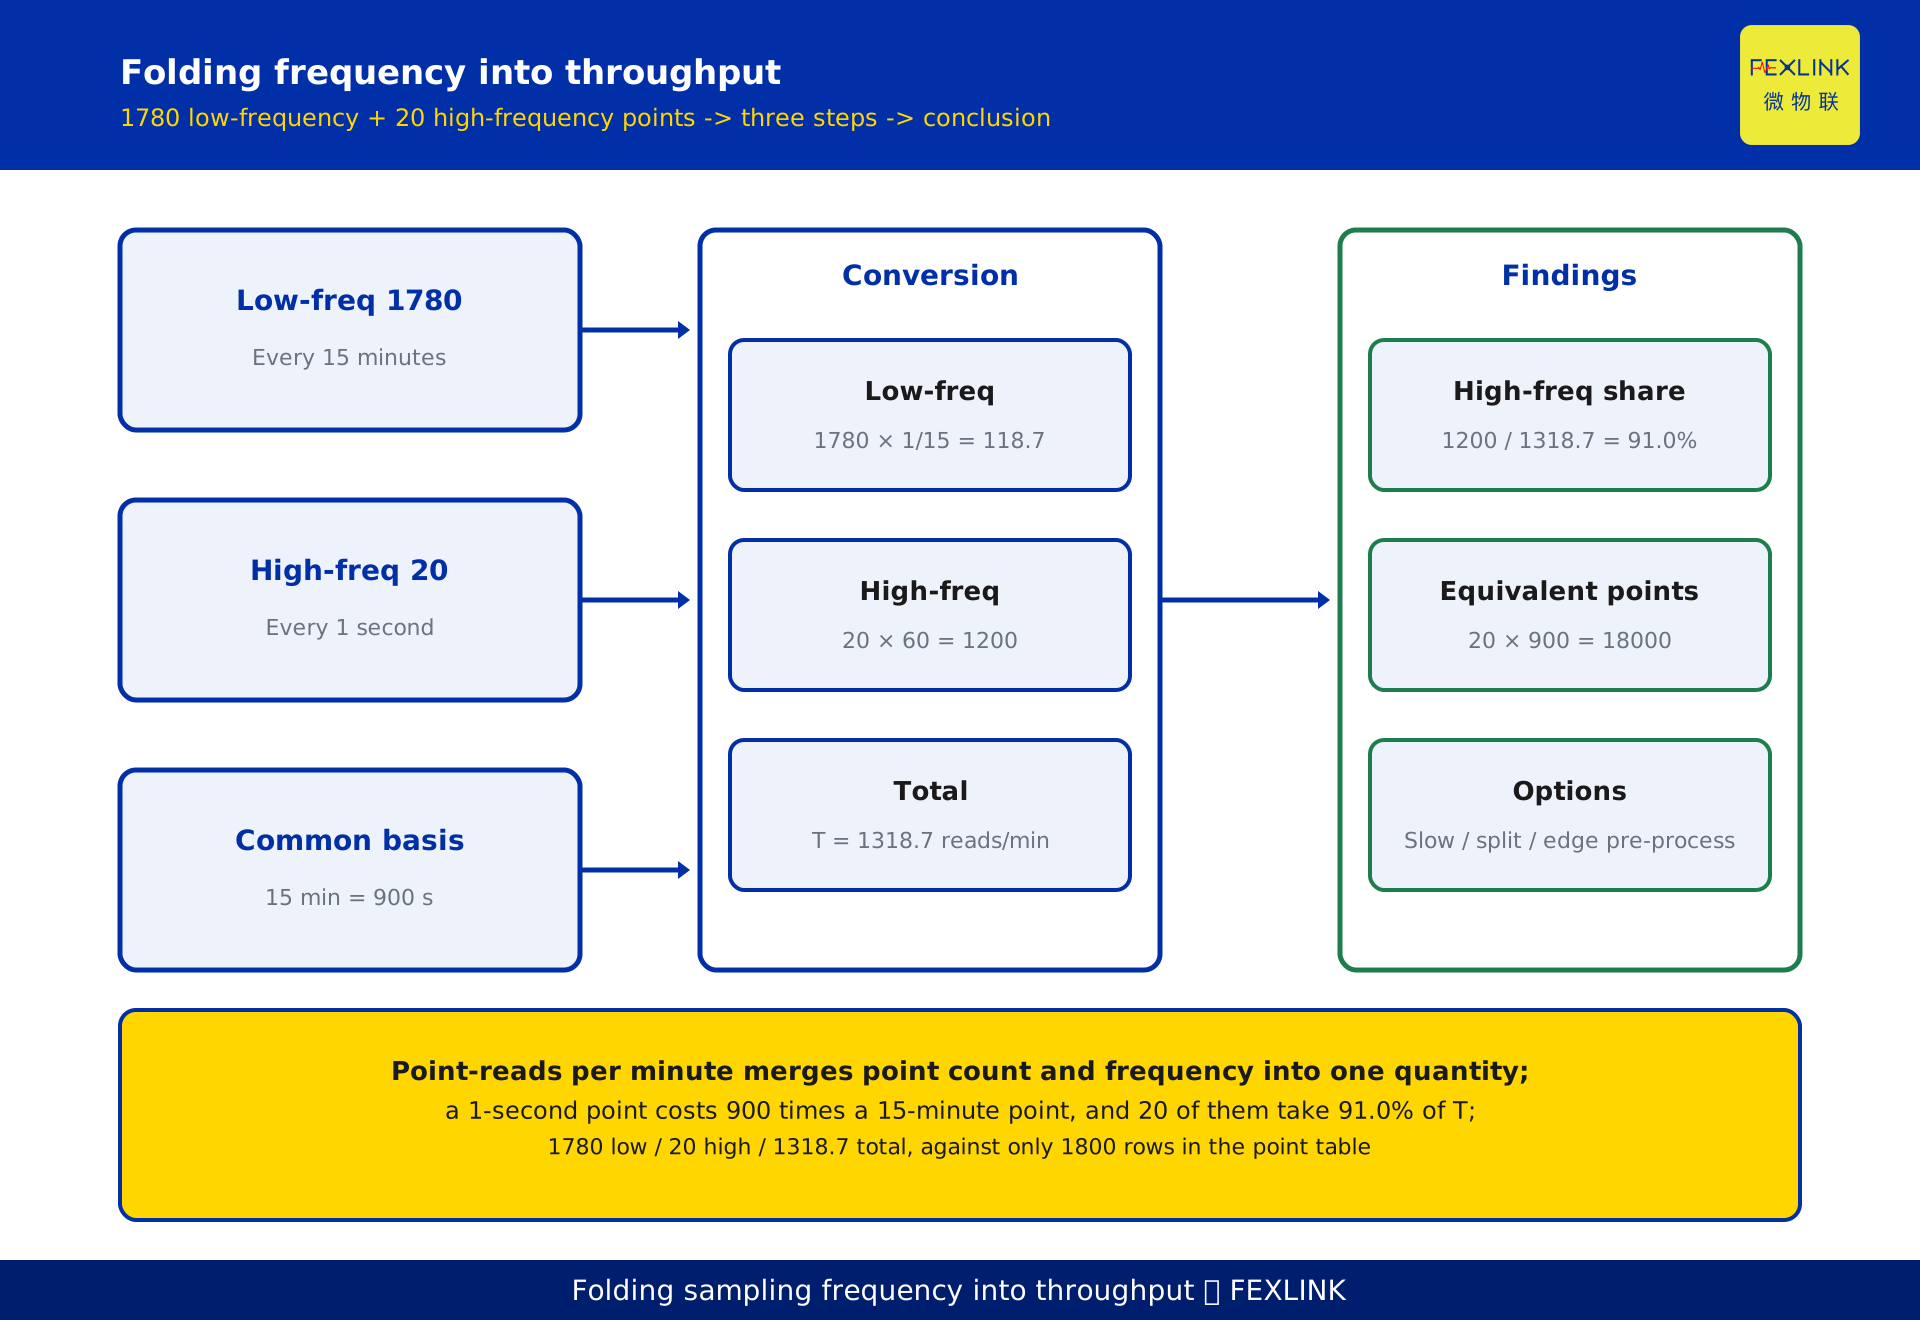
The conversion is direct: once per 15 minutes is 1/15 reads per minute, once per 1 minute is 1, once per 1 second is 60. A point sampled every second consumes 900 times the throughput of one sampled every 15 minutes — 15 minutes equals 900 seconds.
This merges points and frequency into one comparable quantity. A point table with 1800 rows can be split into low-frequency and high-frequency contribution; put each zone's T on the same basis and the saturated unit becomes visible. Absolute ceilings still come from vendor specifications and field measurement; this article invents no hardware parameters.
4. A counter-intuitive example: 1800 points fit on paper but not in practice
The following is a constructed illustration; quantities and scenario are de-identified and represent no real project.
A distribution room plans 30 devices and 1800 static points: 1780 read every 15 minutes and 20 read every 1 second (transient and waveform points).
On the two static dimensions: devices 30 ≤ 30, points 1800 ≤ 2000, neither ceiling breached — "1 gateway is just enough, with 200 points left over".
On the third: low-frequency part 1780 × (1/15) = 118.7 point-reads per minute; high-frequency part 20 × 60 = 1200; total T = 1318.7. Those 20 points are only 1.1% of static points but contribute about 91.0% of throughput. Reduce them to 15-minute sampling and T becomes 1800 / 15 = 120, only 9.1% of the original.
The conclusion inverts: the static account says "enough, with room to spare", the time account says "nine tenths consumed by 20 points". This is not a gateway quality problem — the sizing method is missing a dimension. Count devices and points only and you fail here.
5. Folding high-frequency points: equivalent points and three options
Use "equivalent 15-minute points": one 15-minute read is 1 equivalent unit, a 1-second read equals 900. The 20 one-second points above are about 18000 equivalent points; add the 1780 low-frequency points for about 19780 — nothing like the 1800 rows in the point table.
High-frequency points must not be added directly to low-frequency ones. Three options:
First, ask whether the business truly needs that period. If 1-second data is only for post-event traceback, drop to 1 minute or trigger on demand and throughput falls by an order of magnitude; keep it only where second-level analysis is required.
Second, if the period cannot be reduced, separate it. Put high-frequency points on an independent acquisition channel or dedicated gateway so they do not consume the polling and uplink budget of ordinary points. Ordinary zones still follow 30 devices / 2000 points; the two load classes are physically isolated.
Third, pre-process at the edge. Upload only limit-crossing fragments, feature values or statistical results instead of full raw high-frequency series. Actual capability depends on product specifications; no parameter commitment is made here.
None of the three is "buy a bigger gateway": solve capacity by basis and layering first, hardware last.
6. How to set the 30%-50% headroom
The registry reference is "reserve 30%-50% headroom for planned growth". That band is not a fixed coefficient; it is r = planned growth + uncertainty buffer.
If a two-year plan adds 25% more points and a 10%-20% uncertainty buffer is added, r lands at 35%-45%. A frozen point list with no expansion plan takes the lower bound 30%; an unsettled table, frequent expansion or vague phase boundaries takes the upper bound 50%.
What matters more is where headroom goes. Unit count takes the largest of the three dimension ratios then multiplies by (1+r), equivalent to reserving the same proportion on all three — not reserving on static points only while leaving throughput bare. Counterexample: a zone uses 60% of static points, apparently leaving 40% of room, but throughput already sits at 90%; add 30% more points and static points rise to 78% (still within limits) while throughput breaks first. Headroom must act on the tightest dimension, only known once T is computed.
The formula is N = ceil( max(D/30, P/2000, T/T_cap) × (1+r) ), where T_cap is the usable throughput budget of one gateway, set by vendor specification and field measurement. No absolute value is given; the example uses relative multiples only.
7. A gateway sizing table
The table is a constructed illustration of three zones, showing "static estimate → throughput check → final". T_cap has no absolute value, so the throughput column only yields pass or split decisions.
| Zone | Devices D | Static P | 15-min points | 1-s points | T (point-reads/min) | 2-D max ratio | r | Estimate | Throughput check | Final |
|---|---|---|---|---|---|---|---|---|---|---|
| A | 30 | 1800 | 1800 | 0 | 120 | 1.0 (devices) | 30% | 2 | Pass | 2 |
| B | 22 | 1200 | 1180 | 20 | 1278.7 | 0.733 | 40% | 2 | Split high-freq points | 2 + separate channel |
| C | 18 | 900 | 900 | 0 | 60 | 0.6 | 30% | 1 | Pass | 1 |
Zone A: max(30/30=1.0, 1800/2000=0.9)=1.0; times 1.3, rounded up, gives 2 units. Device count already reaches the ceiling, so no headroom means no expansion space. Zone B uses only 0.733 on two dimensions and still needs 2 units at 1.4 times, but T reaches 1278.7 — 10.7 times Zone A's 120 — so the 20 one-second points must be split onto a separate channel or even 2 units will not run. Zone C: 0.6 × 1.3 = 0.78, so 1 unit suffices with about 22% room left.
The instructive row is B: the static estimate says "2 units", and without a throughput gate that estimate would be delivered as final.
8. Division of labour with KD-0474
KD-0474, "Hundreds of Meters to the Platform: Sizing Gateways by Device and Point Counts", already covers the two-dimension device/point method, per-meter point estimation, the five-step unit count, the 200-meter campus example, and zone deployment with uplink choices. None is repeated here, nor is its campus example reused.
KD-0474 answers "how many units does the static configuration need" using the larger of two dimensions plus headroom; this article answers "will those units hold up at the chosen sampling periods" by adding the third dimension, high-frequency folding and a headroom method. The former is the starting estimate, the latter the validation gate. Compute the initial value with KD-0474, then run the throughput check zone by zone — never in reverse.
The registry also separates this article from KD-0990: KD-0990 covers multi-protocol access selection, the protocol-coverage dimension; this article covers capacity sizing. The three do not substitute for one another.
9. How the related products map onto the sizing table
The registry associates ESX-0223-GR, CW-C1/C2/C3 and CX-08R06AI08-C1/C2/C3 — edge computing and industrial gateways. In the sizing table they are nodes that execute acquisition and aggregation: meters and controllers downstream, data to the platform upstream.
Three-dimension sizing affects selection concretely: device count and static points decide how many units and how to zone them; sampling frequency decides whether gateways should be deployed in high-frequency and low-frequency groups, and whether second-level points need an independent channel. Model choice rests not only on "how many devices it can attach" but on polling and uplink margin at the target sampling period.
Exact capacity specifications, accuracy and pricing follow the latest selection manual and product knowledge base. This article gives qualitative roles only, invents no parameters and makes no selection commitment. related_standards is empty, so no standard numbers or clauses are cited.
FAQ
Q: Since 30 devices / 2000 points are reference figures, why not just divide by them?
They are fine for a static initial value, not a final answer. They describe how large a point table fits, not how often those points are read. Once second-level points are mixed in, "static account passes, throughput collapses" is common — the third dimension check is mandatory.
Q: Is finer sampling always better?
No. 15-minute granularity supports energy totals and trend analysis; second-level data is only necessary for transients, waveform recording and event traceback. Each step up in frequency multiplies throughput, and most of that data never enters a business conclusion.
Q: Must high-frequency points get a dedicated gateway?
Not necessarily. First judge whether they can be slowed or triggered on demand; if second-level sampling is truly required, consider an independent channel, grouped deployment or edge pre-processing. Whether a separate gateway is needed depends on comparing T with the measured throughput budget; no absolute threshold is given here.
Q: Why 30%-50% headroom instead of a fixed 30%?
Because it equals planned growth plus an uncertainty buffer. Clear growth with a frozen list takes the lower bound; vague phasing or frequent expansion takes the upper. A fixed coefficient would produce the same result for "no expansion planned" and "capacity will double".
Q: This article or KD-0474 — which should I read?
Start with KD-0474 for the two-dimension initial count and zoning, then use this article for sampling frequency, throughput validation and headroom selection. For static unit-count planning only, read the former; if second-level points exist, or acceptance testing finds the platform cannot refresh, read the latter.
Scope and Limitations
- Applies to campuses, plants and buildings that already have a point list and defined sampling periods and need to size and zone edge gateways. Points with local display only and no upstream capability are outside the calculation.
- 30 devices / 2000 points and 30%-50% headroom are reference figures from the registry, not specification commitments for any vendor product. The usable throughput budget T_cap must be set from vendor specifications and field measurement; no absolute value is given, and no CPU, bandwidth or storage parameter is invented.
- All quantities — 30 devices, 1800 static points, 1780 low-frequency points, 20 one-second points, 118.7 / 1200 / 1318.7 point-reads per minute, 900-fold equivalence, 18000 and 19780 equivalent points, and the three zones' 30 / 1800 / 22 / 1200 / 1180 / 18 / 900 — are constructed illustrations. Scenario and customer information are de-identified and correspond to no real project.
- ESX-0223-GR, CW-C1/C2/C3 and CX-08R06AI08-C1/C2/C3 are described qualitatively only. Accuracy, range, capacity specifications and pricing follow the latest selection manual and product knowledge base; this article makes no commitment and is neither selection nor purchasing advice.
- related_standards is empty: no standard number, clause or acceptance limit is cited. "Point-reads per minute" and "equivalent 15-minute point" are method quantities defined here for comparison, not industry units of measurement.
- No performance data (saving rate, accuracy rate, payback period) enters the conclusion. This is a capacity sizing method, not a performance commitment.
Frequently Asked Questions
Since 30 devices / 2000 points are reference figures, why not just divide by them?
They are fine for a static initial value, not a final answer. They describe how large a point table fits, not how often those points are read. Once second-level points are mixed in, "static account passes, throughput collapses" is common — the third dimension check is mandatory.
Is finer sampling always better?
No. 15-minute granularity supports energy totals and trend analysis; second-level data is only necessary for transients, waveform recording and event traceback. Each step up in frequency multiplies throughput, and most of that data never enters a business conclusion.
Must high-frequency points get a dedicated gateway?
Not necessarily. First judge whether they can be slowed or triggered on demand; if second-level sampling is truly required, consider an independent channel, grouped deployment or edge pre-processing. Whether a separate gateway is needed depends on comparing T with the measured throughput budget; no absolute threshold is given here.
Why 30%-50% headroom instead of a fixed 30%?
Because it equals planned growth plus an uncertainty buffer. Clear growth with a frozen list takes the lower bound; vague phasing or frequent expansion takes the upper. A fixed coefficient would produce the same result for "no expansion planned" and "capacity will double".
This article or KD-0474 — which should I read?
Start with KD-0474 for the two-dimension initial count and zoning, then use this article for sampling frequency, throughput validation and headroom selection. For static unit-count planning only, read the former; if second-level points exist, or acceptance testing finds the platform cannot refresh, read the latter.