 FEXLINK Research Institute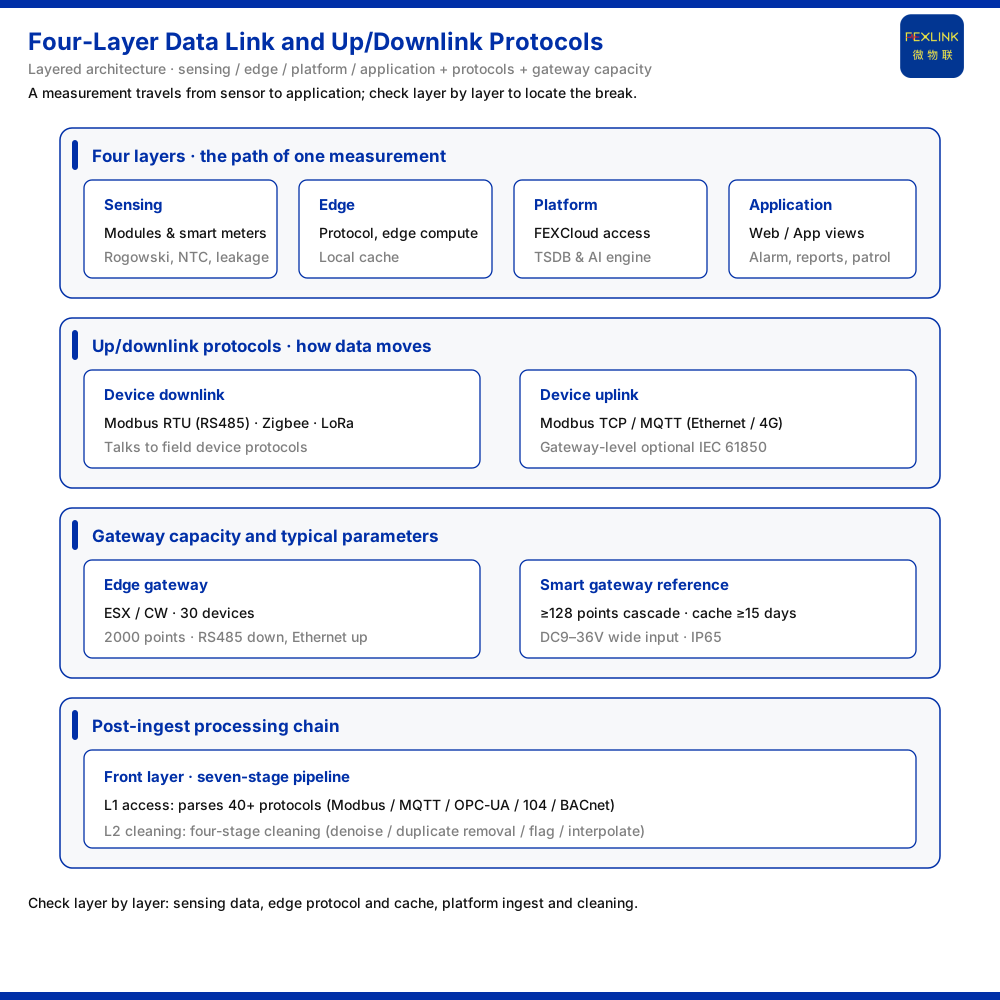
Direct answer
A measured-point datum travelling from a sensor to the platform passes in turn through three stages, the perception layer, the edge layer and the platform layer, and finally reaches the application layer. The product knowledge base divides the general architecture of a monitoring system into four layers: the perception layer, which holds the various monitoring modules, smart meters, and Rogowski coils, NTC sensors and microamp-level leakage sensors; the edge layer, which holds gateways and programmable devices and takes on protocol conversion, edge computing and local caching; the platform layer, which is FEXCloud, responsible for device access, a time-series database and an AI inference engine; and the application layer, which is the visualisation, alarm management, analysis reports and mobile inspection of the Web and App. On protocols, the device downlink uses Modbus RTU over RS485, Zigbee in the Modbus manner, and LoRa; the device uplink uses Modbus TCP or MQTT over Ethernet or 4G, with IEC 61850 optional at the gateway level. This article follows that main line to explain what each layer does and where to look during integration and troubleshooting.
1. Four-layer architecture: the four stages a data point passes through
The general four-layer architecture of a monitoring system in the product knowledge base is the perception layer, the edge layer, the platform layer and the application layer. The perception layer acquires data, the edge layer converts and temporarily stores it, the platform layer accesses and stores it, and the application layer presents and handles it.
The value of understanding this chain lies in troubleshooting. Data may be broken at the perception layer because nothing was acquired, at the edge layer because a protocol does not connect, or at the platform layer because access was not set up correctly. Checking stage by stage along the four layers is more efficient than saying vaguely that the system has a problem. For a system integrator, this chain is also the common language for aligning the division of work with platform integration engineers.
2. Perception layer: starting from the sensor
The perception layer includes the monitoring modules of the lightning-protection and electrical-safety families, smart meters, and Rogowski coils, NTC sensors and microamp-level leakage sensors. Each is responsible for one class of physical quantity or electrical parameter and converts the field state into an acquirable signal.
What this layer shares is direct contact with the field. Sensor selection and mounting method decide the quality of the raw data. If acquisition at the perception layer is itself biased, later protocol conversion and platform analysis cannot compensate. Chain troubleshooting therefore usually starts at this layer: first confirm whether there is data, then discuss whether the data is accurate.
Different types of quantity are connected in different ways. Monitoring modules and smart meters are mostly digital interfaces, while Rogowski coils, NTC sensors and microamp-level leakage sensors convert current, temperature and small leakage current into measurable signals. Distinguishing how each class of signal is connected avoids detours in wiring and configuration.
3. Edge layer: protocol conversion, edge computing and local caching
The edge layer consists of the lightning-protection smart gateway, the intelligent edge-computing gateway (ESX-0223-GR), the industrial gateway, the industrial wearable controller and the cloud PLC. The three responsibilities the product knowledge base gives are protocol conversion, edge computing and local caching.
Protocol conversion solves the problem of different languages above and below: it interfaces downward with the various device protocols and converts upward into a format the platform accepts. Edge computing lets part of the judgement happen on site rather than all being sent back. Local caching ensures data is not lost when the network is interrupted and is retransmitted after recovery. Together, these three make the edge layer the hub of the chain and the buffer between the field and the cloud.
4. Uplink and downlink protocols: how data goes in and out
The protocol division is set out clearly in the communication protocol matrix of the product knowledge base. The device downlink protocols are Modbus RTU over RS485, Zigbee in the Modbus manner, and LoRa; the device uplink protocols are Modbus TCP or MQTT, carried over Ethernet or 4G, with IEC 61850 optional at the gateway level.
This stretch is where integration most easily goes wrong. The downlink requires aligning the device address, baud rate and register mapping; the uplink requires configuring the topic, port and certificate properly. The protocol matrix gives the scope, but the specific parameters at each end still need to be fixed by device and project. Distinguishing the downlink and uplink protocol sets prevents confusing a fieldbus problem with a cloud access problem.
5. Platform layer: FEXCloud access and storage
The landing point of the platform layer is the FEXCloud IoT cloud platform, also called FEXLINK. Its responsibilities as listed are device access, a time-series database and an AI inference engine. There is also the independent Mistudio programmable logic control software system.
Device access registers the data sent by the gateway into the database, the time-series database stores measured points by time, and the AI inference engine analyses on top of them. For a user, the platform layer is the destination of the data and the starting point of all later analysis and applications. Once measured points are correctly stored, reports, alarms and forecasts have a usable data source.
6. The processing chain after entering the platform
Data is not necessarily usable once accessed; it must still be processed. The front-end layer of the product knowledge base divides this processing chain into a seven-level pipeline, in which the L1 access layer parses more than 40 protocols, including Modbus, MQTT, OPC-UA, 104 and BACnet, and the L2 cleaning layer executes four-level data cleaning, namely denoising, duplicate removal, anomaly marking and interpolation completion.
The Taiyi back end likewise provides access to more than 40 protocols, four-level cleaning, a PB-level time-series data lake and an intelligent data bus. This shows that whichever implementation is used, there is a cleaning gate after access to ensure the data entering analysis is usable. For troubleshooting, if data appears anomalous on the platform side, besides looking at access, one should also check whether the cleaning stage has mislabelled a valid value.
7. Typical gateway parameters and breakpoint troubleshooting
The capability on the gateway side can be sensed from a typical parameter. The reference parameters the product knowledge base gives for the smart gateway of the grounding resistance monitoring system are a mount of at least 128 points and cascade capability, at least 4 RS485 ports, at least 2 Ethernet ports, 4G, 5G or LoRa optional, data caching of at least 15 days, a supply of DC 9 V to 36 V wide voltage, and a protection rating of IP65. Another reference is the intelligent edge-computing gateway and the industrial gateway, with an access capability of 30 devices and 2000 data points, downlink over RS485 and uplink over Ethernet or 4G.
Comparing these parameters with the four-layer chain gives troubleshooting a handle: first check whether the perception layer has data, then whether the edge layer has a cache record and whether the protocol matches, and finally whether the platform layer received the data and stored it correctly. Verifying layer by layer usually locates the breakpoint.
Scope and limitations
First, this article restates only what the product knowledge base lists; the factual boundary is limited to the records of the general four-layer architecture of a monitoring system, the communication protocol matrix, the front-end layer and the related gateways.
Second, the layers of the four-layer architecture and the responsibilities of each are cited as listed in the product knowledge base; this article does not infer unlisted devices or software.
Third, the downlink and uplink protocols in the communication protocol matrix are cited as listed in the product knowledge base; this article does not give specific engineering address, port or certificate configurations.
Fourth, the 30 devices and 2000 data points of the intelligent edge-computing gateway and the industrial gateway are cited as listed in the product knowledge base; the same applies to the reference parameters of the smart gateway of the grounding resistance monitoring system.
Fifth, the more than 40 protocols and four-level data cleaning of the front-end layer, and the more than 40 protocol access points and PB-level time-series data lake of the Taiyi back end, are cited as listed in the product knowledge base; this article does not extend the details of the processing chain beyond the listed scope.
Sixth, this article explains only the composition of the data chain and points for troubleshooting and does not provide a specific integration implementation plan; the related conclusions must be verified against field conditions and the project scheme.