 FEXLINK Research Institute
The short answer
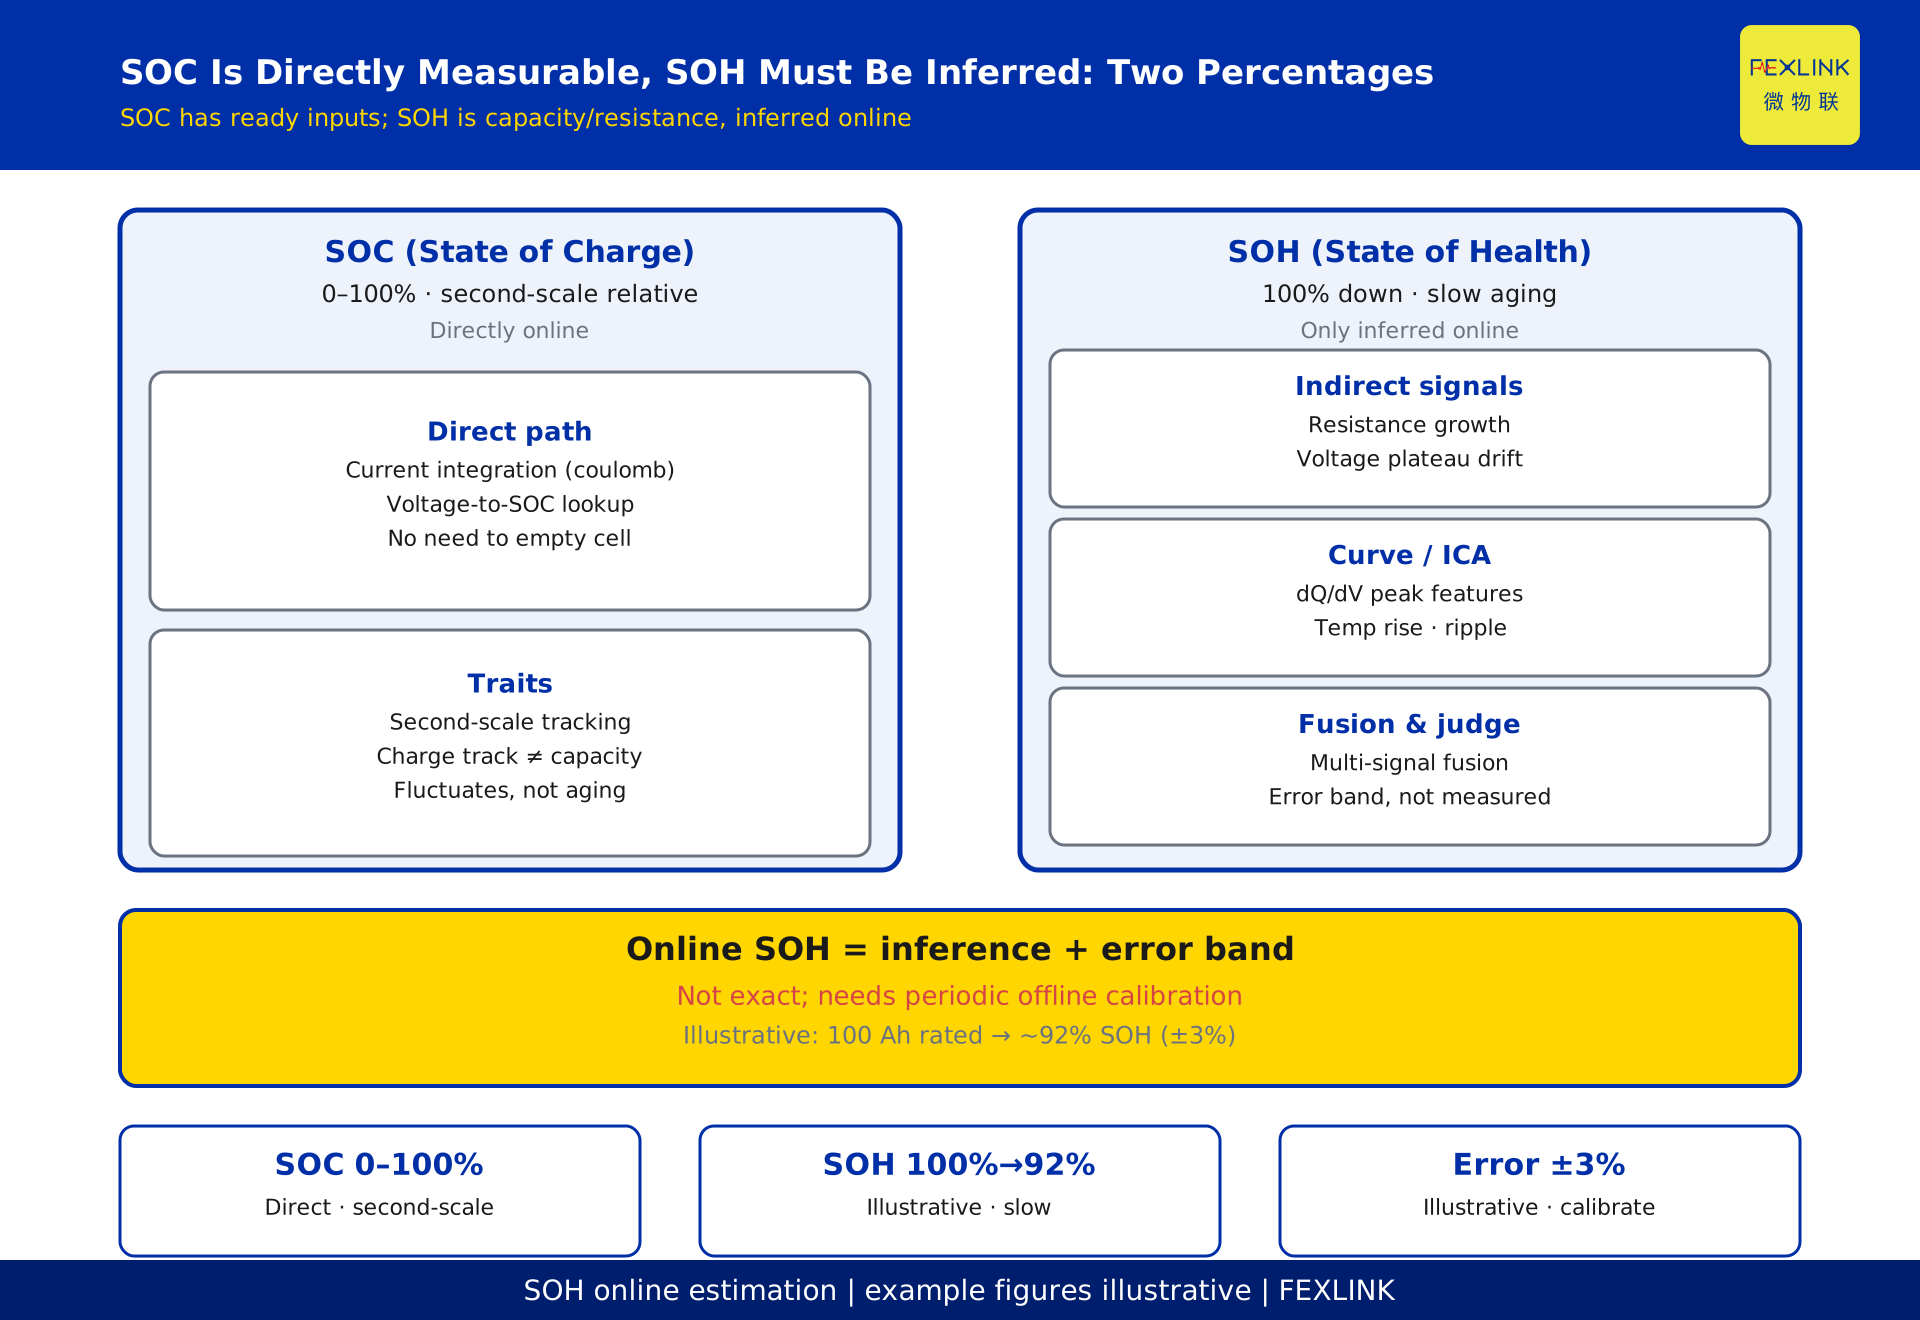
One-line conclusion: SOC (State of Charge, remaining energy) can be computed directly from current integration and a voltage lookup. SOH (State of Health, remaining capability) is fundamentally about capacity and resistance; capacity can only be measured accurately by one complete, slow full charge–discharge, so online it can only be inferred from indirect signals such as rising internal resistance, voltage-plateau drift, and temperature-rise features. Online SOH estimation therefore carries an inherent error band and must not be treated as exact; it needs periodic offline calibration. Below we explain why it is hard and what paths exist beyond a full charge–discharge.
1. First, separate them: SOC and SOH are not the same
SOC answers "how much charge is left now" — a relative quantity in the 0–100% range. SOH answers "how much capability is left" — a degrading quantity that usually falls from 100%. Both are written as percentages, but their physics differ completely: SOC fluctuates on a second scale (it changes as you charge or discharge), while SOH declines slowly over months and years. Conflating the two is the first and most common mistake on site. Many sites treat the SOH reading and the SOC reading as numbers of the same precision, and end up mistaking a trend-like health figure for a capacity they can actually settle against — the root of a chain of later misjudgments.
2. Why SOC is directly measurable but SOH is not
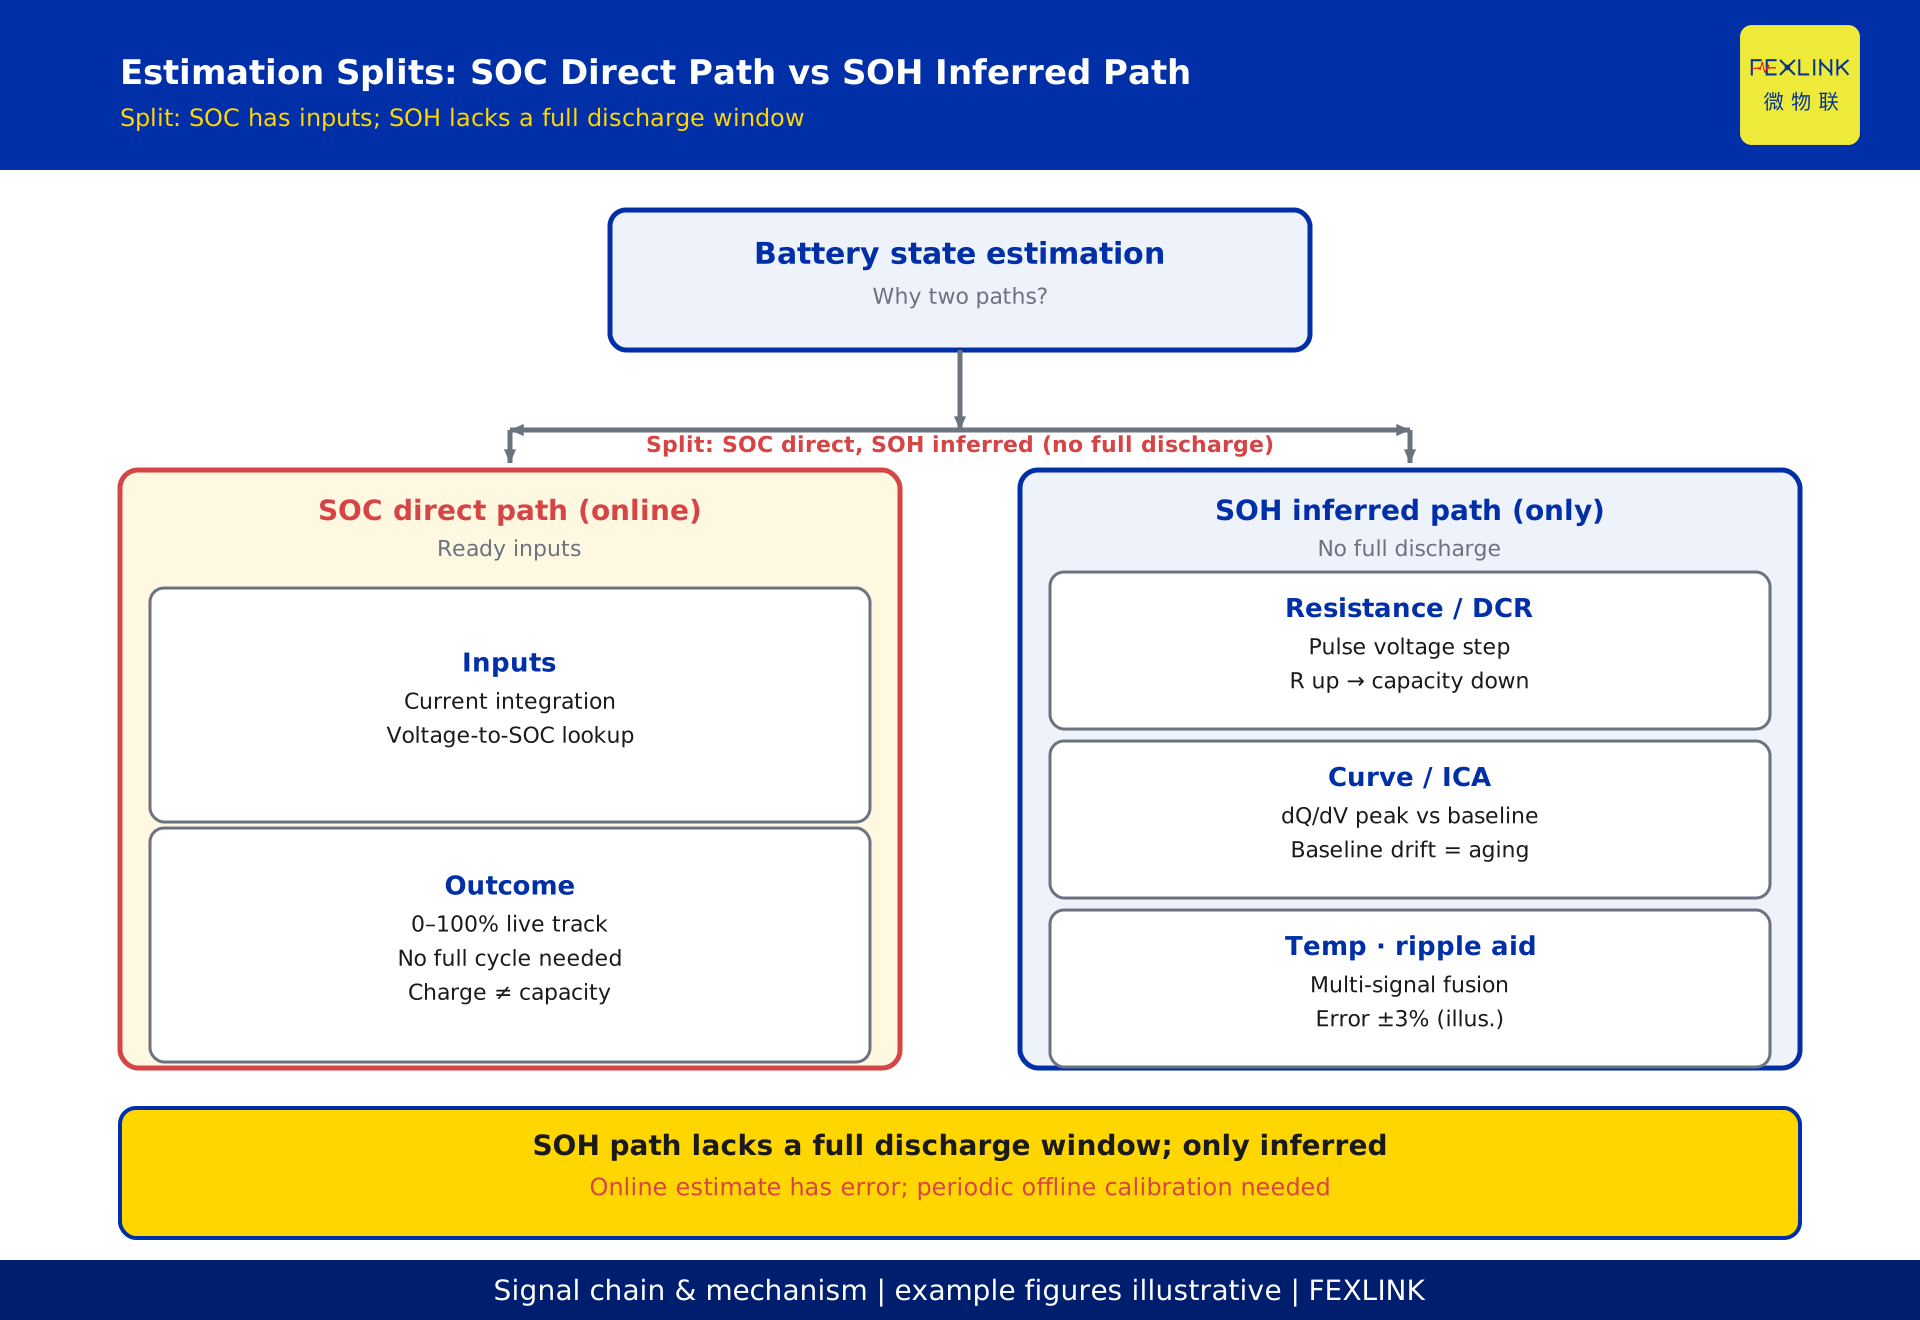
SOC can be obtained online directly because it has two ready-made observation entries. One is current integration (coulomb counting): integrate the charge/discharge current over time to track energy, then correct it with a voltage lookup. The other is the roughly monotonic relation between terminal voltage and SOC across most of the range, letting you estimate SOC from voltage in reverse. Neither entry requires emptying and refilling the cell. That is also why the SOC reading is available in real time on almost every battery-management system and tends to enjoy higher user trust.
SOH's core indicators are "available capacity" and "internal resistance." By definition, available capacity is the energy you can draw from full to empty; the cleanest way to measure it accurately is one complete, slow full charge–discharge — which is exactly the thing that needs a shutdown, time, and dedicated equipment. In other words, SOH's definition carries the gene of "offline calibration"; online there is no complete discharge window, so it cannot be measured directly.
3. Capacity fade and resistance growth: two ends of one rope
Falling capacity and rising resistance are two faces of the same aging process. As active material is lost, the SEI film thickens, and available lithium ions drop, the capacity the cell can deliver shrinks while its ohmic and polarization impedance grows. Empirically the two are strongly correlated: the more resistance rises, the harder capacity falls. It is precisely this relation that lets engineering use "measure how resistance changes" to infer "has capacity dropped" — the premise on which online SOH estimation rests. But stress this: it is a correlation, not an identity; the SOH inferred from resistance is an estimate, not a measured capacity.
4. Indirect signals observable online
Since capacity cannot be measured directly, online you can only extract signals from the charge–discharge process without emptying the cell. Common categories:
- Internal resistance / DC resistance (DCR): estimate ohmic and polarization impedance from the voltage step under a pulse current; rising resistance is a strong aging signal.
- Voltage-plateau drift: the terminal voltage at a given SOC shifts downward overall with age, or the charge/discharge curve changes shape; comparing the live curve against the factory baseline reveals aging.
- Incremental capacity analysis ICA (dQ/dV) and differential voltage DV: differentiate capacity with respect to voltage; aging produces peak shifts and peak-height drops at specific voltages — an effective way to identify aging mechanisms.
- Temperature-rise features: faster temperature rise or changed thermal inertia under the same duty also serves as an auxiliary signal.
- Ripple / high-frequency electrical features: ripple or harmonics in certain frequency bands change with age — a finer observation dimension.
Used alone, none of these signals is stable enough; in practice they rely on multi-signal fusion.
5. Common online estimation algorithms
Online SOH estimation that is deployed in practice is essentially a combination of a few "model + data" ideas:
- Resistance method: build an empirical resistance–capacity relation and infer SOH by estimating resistance online. Simple and real-time, but sensitive to duty and temperature.
- Voltage-curve / ICA method: compare the live charge/discharge curve or dQ/dV peak features against the baseline to estimate aging. Demands high data quality (sampling rate, noise).
- Model method (equivalent-circuit / physics model + filtering): use state estimators such as EKF or UKF to estimate capacity and resistance together as state variables, exploiting long-run operational data for continuous correction.
- Data-driven / fusion: feed the above signals to an empirical or lightweight learning model for fused estimation, supervised by historical calibration.
Whichever class, the output is an SOH estimate "with uncertainty," not an exact capacity value.
6. Where does the online error come from
Error mainly comes from four sides: (1) the observation signals themselves carry noise, and measurement errors in voltage, current, and temperature are amplified; (2) duty is incomplete — unlike a lab that controls temperature, rate, and a full discharge, on-site charge/discharge is fragmented; (3) temperature coupling — many signals vary with temperature, and without decoupling it contaminates the estimate; (4) model mismatch — empirical relations drift with cell chemistry and aging path. So online SOH typically carries an uncertainty of several percentage points (exact figure depends on algorithm and calibration) and is only fit for trend and warning use, not as a precise basis for capacity settlement. To show the order of magnitude with an illustrative value: a pack rated 100 Ah, after some operation, gives an online SOH of about 92% (illustrative, not measured) with an error band of about ±3 percentage points (illustrative) — the number only serves to show "there is an error band"; the actual figure depends on the on-site equipment and calibration.
7. Why periodic offline calibration is mandatory
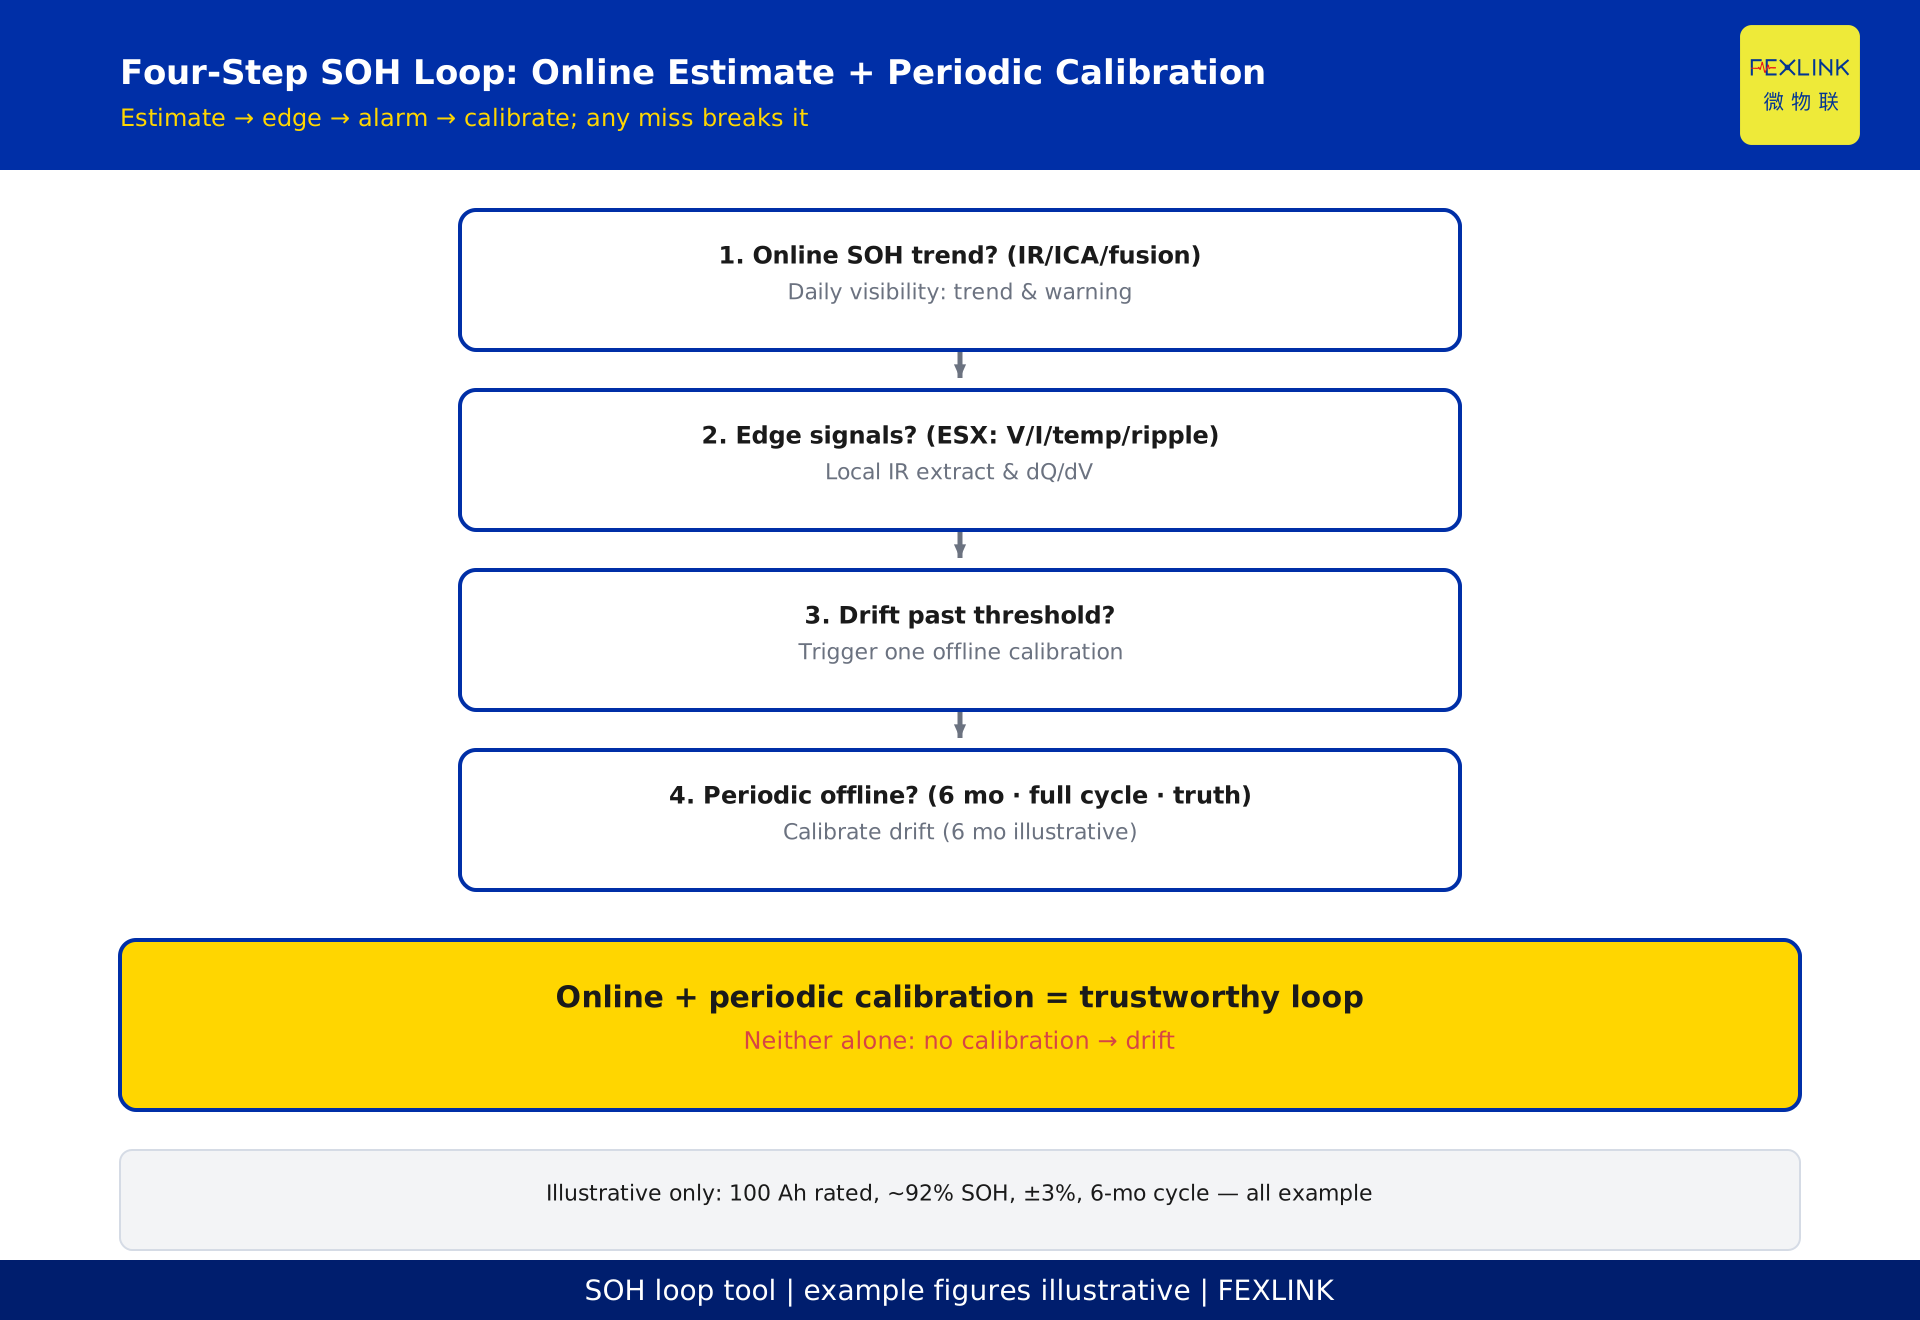
Since online is "inferred" and carries error, you need a "truth" to calibrate it; that truth is the measured capacity from an offline full charge–discharge. The practice: at intervals set by the maintenance procedure (exact period per the site's maintenance rules and equipment manual; below we use 6 months as an illustrative period), perform an offline capacity calibration, convert the measured capacity back into SOH, and use it to correct the online estimate's offset and drift. Without this step, the online estimate slowly floats and biases over time until even the trend becomes untrustworthy. The conclusion: online estimation handles "visible day to day," offline calibration handles "periodic truth anchoring," and neither can be omitted.
8. Deployment: how to get the signals at the edge
To keep collecting these signals without an extra shutdown, the key is to put acquisition and preliminary computation close to the cells. A typical approach is to deploy the ESX smart edge-computing gateway at the battery-cluster or battery-rack side; it acquires the high-frequency voltage, current, temperature, and ripple of each branch, performs local resistance extraction, dQ/dV computation, and SOH estimation, then pushes the estimate and alarms to the monitoring platform. This lets operators see the live SOH trend and trigger one offline calibration when the deviation exceeds a threshold. Only then do "online estimation + edge computing + periodic calibration" form a closed loop.
9. Frequently Asked Questions (FAQ)
Q: Can we skip offline calibration and rely purely on online estimation?
Not advised. Online estimation inherently carries an error band and drifts; without an offline measured capacity as calibration, even the long-term trend becomes distorted. Offline calibration provides the "truth anchor" and is an indispensable link in the loop.
Q: If SOC is accurate, is SOH accurate too?
No. SOC is a second-scale fluctuating relative quantity; SOH is a slowly changing degrading quantity, and their observation entries differ. An accurate SOC only means "charge tracking" is fine; it does not mean "capacity aging" is computed correctly.
Q: The resistance method is simple — is it enough?
The resistance method has the best real-time performance, but resistance and capacity are correlated, not equivalent, and it is sensitive to temperature and duty. Used alone its error is large; it usually needs to be combined with multi-signal fusion or a model method.
Q: How large is the online SOH error, and can it be used for capacity settlement?
Online SOH typically carries an uncertainty of several percentage points (depends on algorithm and calibration); it is positioned for trend and warning and should not be used directly as a precise basis for capacity settlement or warranty determination.
Q: Can we trust vendor claims about "special-frequency electrical features identifying aging / thermal runaway"?
That is a vendor-disclosed capability direction (e.g., ripple or harmonics in certain bands changing with age and thermal runaway) — it is enterprise disclosure, not a conclusion verified by this article; whether to adopt it should rest on the actual product and on-site validation, and it should not be written directly into conclusions or selection criteria.
Scope and limitations
- This article focuses on why SOH online estimation is hard and what indirect paths exist; it does not replace the original text of standards such as GB/T 36276 "Lithium-ion batteries for power storage." That standard governs cell-body performance and safety; its specific test items, methods, and limits follow the currently effective version.
- The online-estimation error band, calibration period, and example capacity and SOH figures cited here (e.g., 100 Ah rated, online SOH about 92%, error ±3 percentage points, 6-month calibration period) are all illustrative values constructed to explain the point and represent no real customer, project, or test data; actual figures depend on on-site equipment, algorithm calibration, and maintenance rules.
- The ESX smart edge-computing gateway is introduced to illustrate the "edge acquisition and local estimation" logic; its specific specifications, interfaces, and selection follow the latest product knowledge base and selection manual, and this article is not a procurement recommendation.
- The algorithms listed in Section 5 (resistance method, ICA/dQ-dV method, model method, fusion) are a summary of common industry ideas, not an implementation note for any specific product or patented method; actual results depend on sampling quality, temperature compensation, and calibration.
- The statement that "special-frequency electrical features are used for aging and thermal-runaway early warning" is enterprise disclosure (a vendor capability direction), not a conclusion verified by this article; this article cites no real customer cases, test data, energy-savings rates, accuracy rates, or rankings.
Frequently Asked Questions
Why SOH Is Harder to Estimate Online Than SOC
One-line conclusion: SOC (State of Charge, remaining energy) can be computed directly from current integration and a voltage lookup