 FEXLINK Research Institute

The short answer
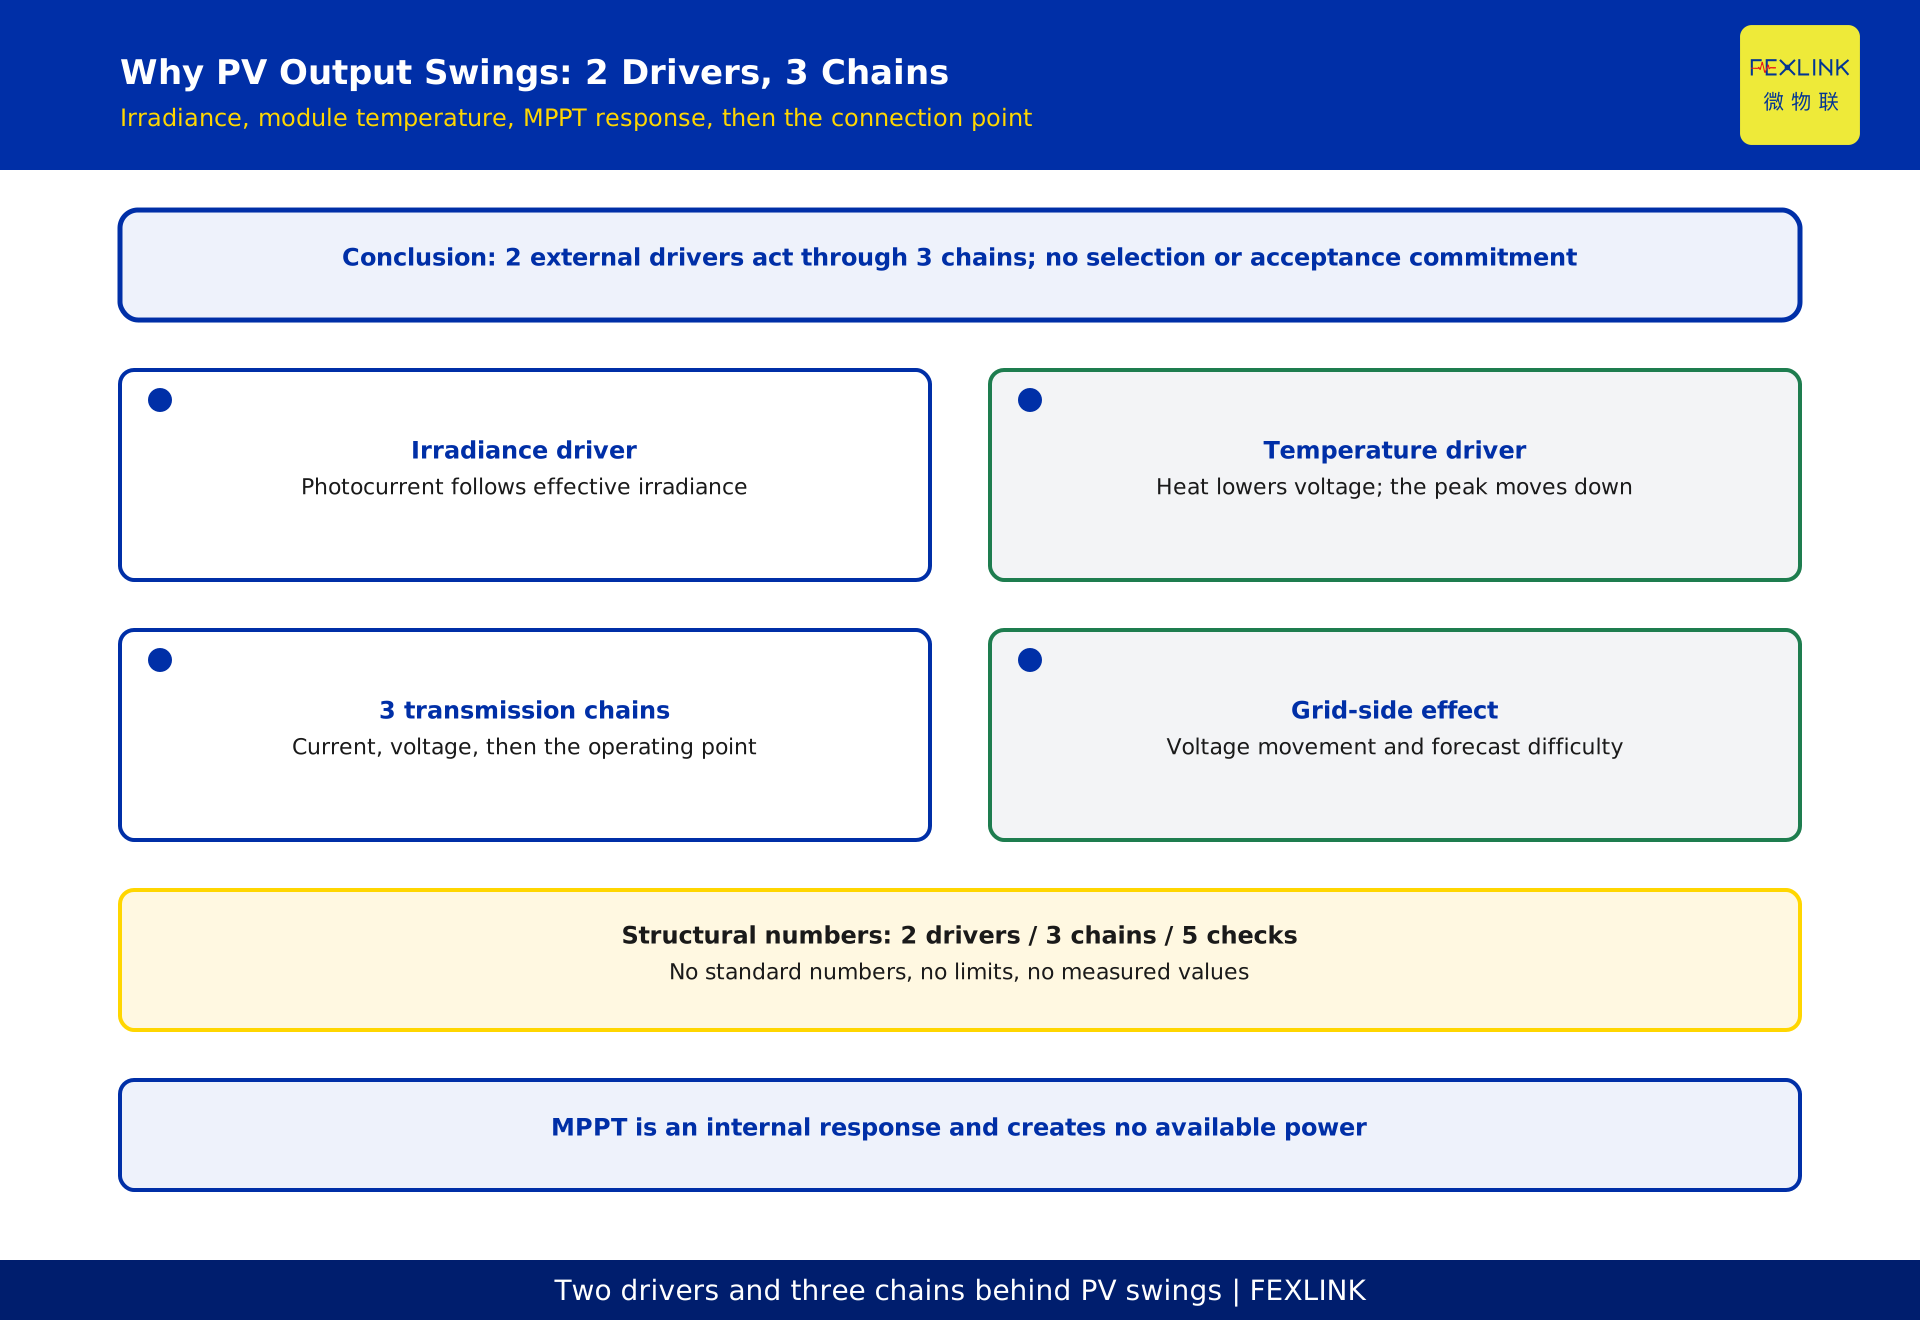
PV output swings come from 2 external drivers and one internal response. Irradiance sets how much photocurrent the cells can generate; module temperature sets how much power the same irradiance can deliver; MPPT keeps searching for the maximum power point on a characteristic that both drivers rewrite continuously. A cloud shadow changes the irradiance reaching the module surface abruptly, producing minute-scale drops and rebounds. Rising temperature lowers the open-circuit voltage, so the strongest irradiance of the day need not coincide with the highest output. These 3 transmission chains explain the shape of the curve. Once that fast variability passes through the inverter into the connection point, it becomes the source of distribution-network voltage fluctuation and of the difficulty inherent in power forecasting. This article deals with mechanism only and closes with a 5-step attribution checklist. It contains no standard numbers, limits, measured values or engineering constants; every conclusion constitutes no selection or acceptance commitment.
Separate the slow trend from the fast swings
Confusion about an output curve usually comes from reading two kinds of change as one. The first is the smooth daily profile driven by the sun's position: continuous and broadly predictable, well described by a slowly moving baseline. The second is the fast variability layered on top. When a shadow crosses the array, irradiance changes sharply within a short interval and the curve shows steep drops and recoveries with irregular spacing and inconsistent depth.
The slow trend follows geometry; the fast component comes from local atmospheric disturbance and is what stresses the connection point and any forecast. Treating a rebound as a trend invites the conclusion that the plant has improved.
The first step in attribution is therefore to set a timescale. Mark every segment that departs clearly from the envelope, noting its boundaries and whether fall and recovery are symmetrical.
The 2 external drivers and the MPPT response
Only 2 quantities act on the module from outside: incident irradiance and the module's own temperature. The first determines how many photocarriers are generated; the second determines the voltage the device can offer under given illumination. Tilt, soiling and shading mostly act indirectly by shifting one of these two.
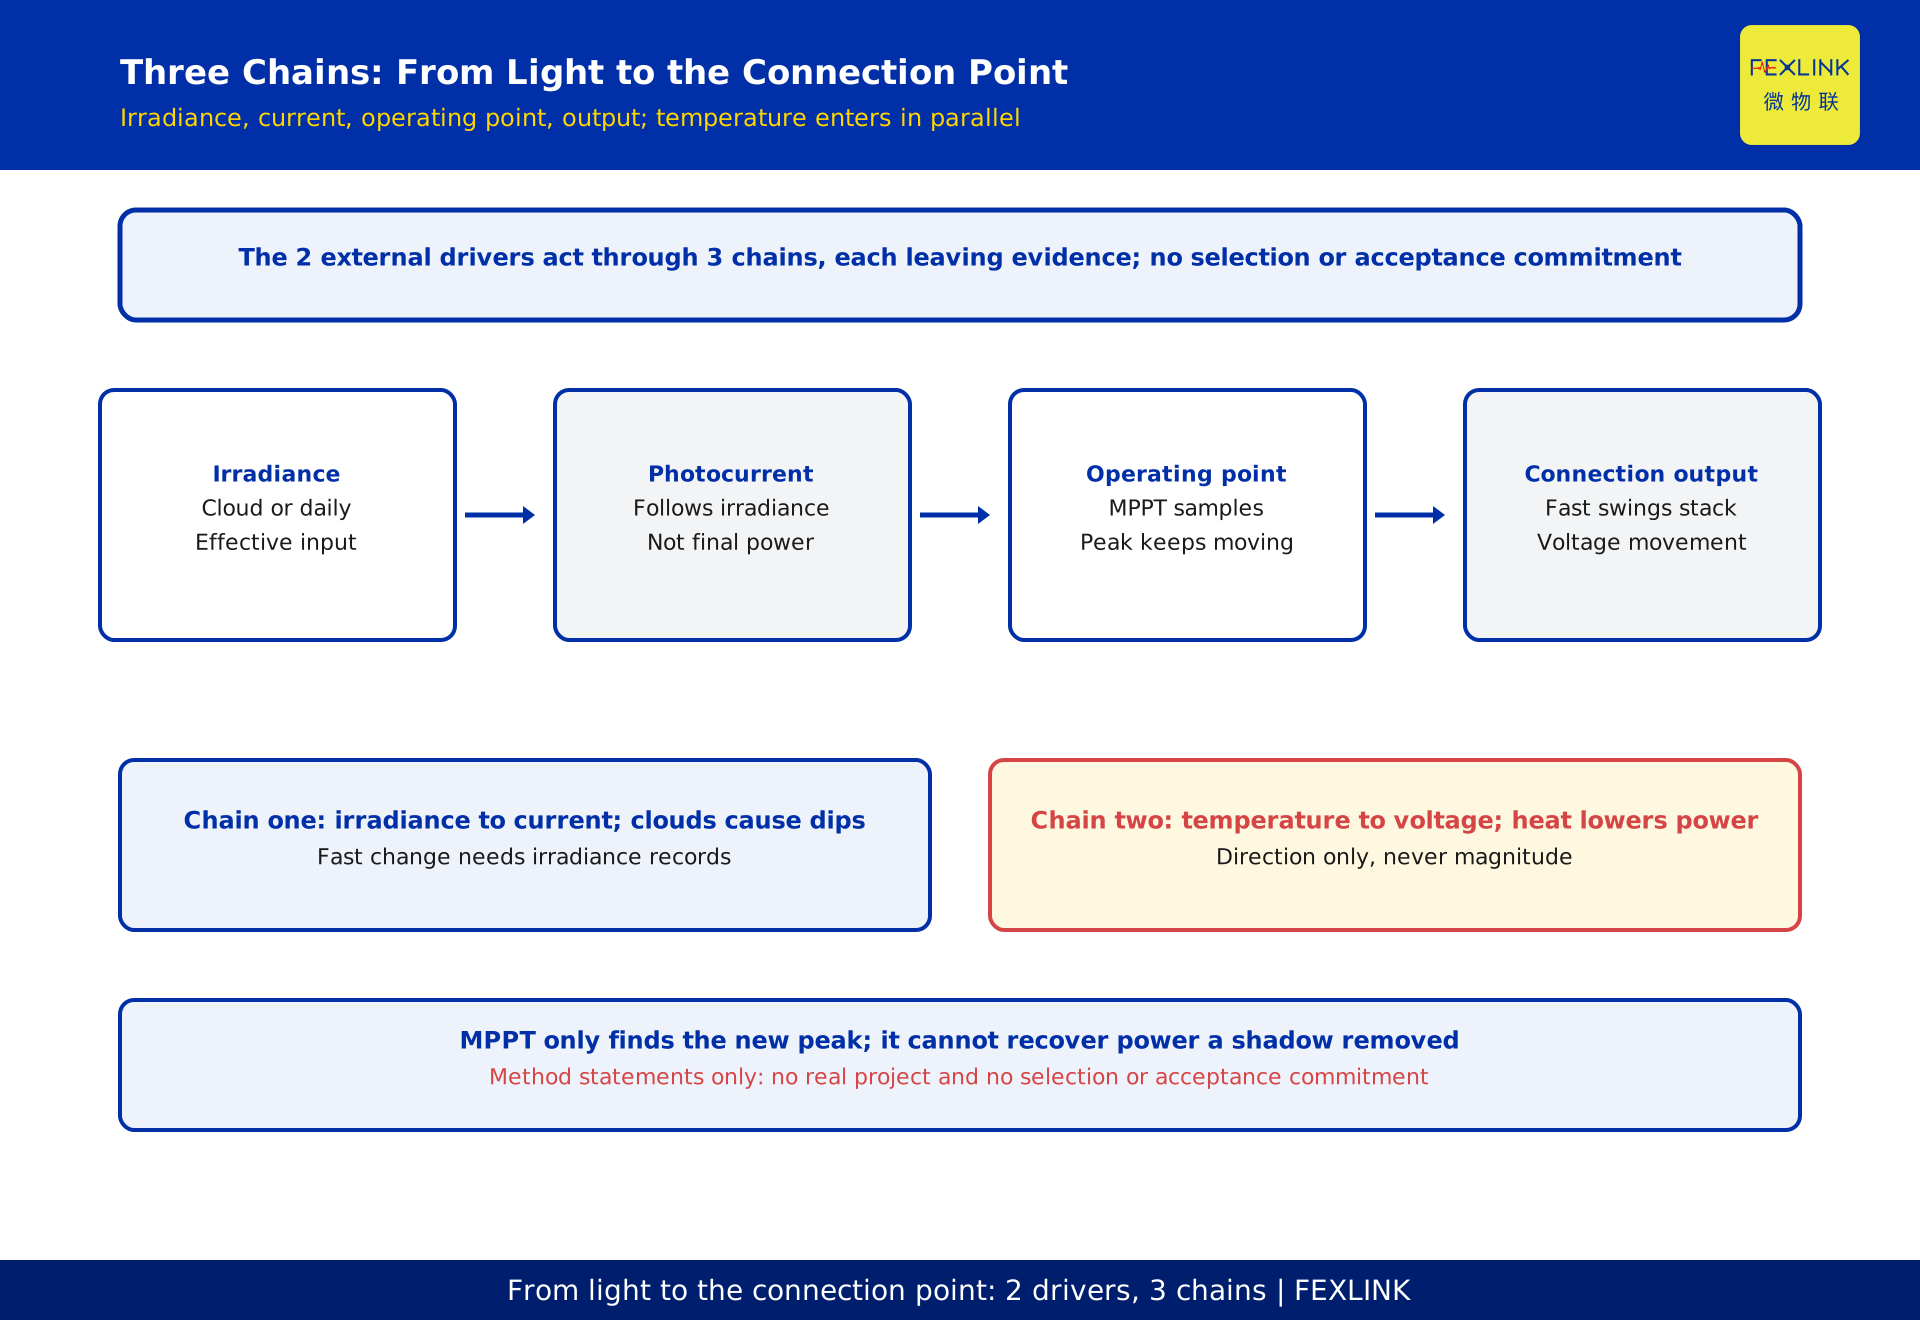
MPPT is not a third driver but an internal response. It changes neither the weather nor the temperature, and creates no available power; it decides only which operating point to take on the characteristic that exists at that instant. The skeleton of this article is therefore 3 transmission chains: irradiance alters photocurrent and hence output; temperature alters open-circuit voltage and peak position and hence output; together they rewrite the characteristic and MPPT adjusts the operating point towards the moving peak.
Chain one: how irradiance becomes cell current
A PV cell works through the photovoltaic effect in a semiconductor junction: incoming photons excite carriers and produce photocurrent. For a fixed device structure, stronger effective irradiance on the module surface raises photocurrent and with it the short-circuit current.
The common error is to treat irradiance as a single reading. What matters is the fraction landing on the cells; clouds, obstructions, angle of incidence and surface condition all make sky irradiance differ from what the module receives. With modules in series and parallel, uneven lighting means total output is not a simple scaling of one module. Current and power must be kept apart: delivered power also depends on operating voltage. Chain one translates light into available current, without promising that output changes in the same proportion. This constitutes no selection or acceptance commitment.
Why cloud cover produces minute-scale drops
Cloud shadow has wide coverage, a fairly sharp boundary and rapid movement. As it sweeps across an array, effective irradiance over the shaded area falls from near clear-sky conditions to a much lower level within a short interval, then rises again, so the curve shows almost vertical edges rather than a gentle slope. Depth depends on coverage, cloud thickness and array layout; duration on the shadow's passage.
Two details matter. Falls and recoveries are rarely symmetrical, and the recovery often contains smaller reversals. Deciding whether a drop came from cloud cover therefore rests not on shape but on whether irradiance moved at the same time, whether the change covered multiple strings, and whether output returned to roughly the same slow baseline. These are attribution tests, not device specifications; a site judgement needs contemporaneous records. This article gives no thresholds or amplitude values and constitutes no selection or acceptance commitment.
Chain two: why module temperature lowers output
As module temperature rises, semiconductor behaviour changes and open-circuit voltage falls markedly. Short-circuit current rises only slightly, by far less than the voltage falls. Since power is the product of the two, maximum deliverable power declines and the peak moves downward on the characteristic. The direction is unambiguous: at a given irradiance, a hotter module delivers less power.
Only the direction is given here, not the magnitude. Temperature coefficients, backsheet temperatures and power-loss ratios are product and site quantities that must come from supplier documentation and on-site measurement; this article quotes, estimates and reuses none of them. A module absorbs and sheds heat over time, so warming and cooling lag behind irradiance, and the same irradiance reading can correspond to different module temperatures on the rising and falling parts of the day. An output curve is therefore sampled from two time trajectories, not copied from irradiance alone. This is a qualitative account of publicly established device physics and constitutes no selection or acceptance commitment.
Why midday is often not the daily peak
If irradiance were the only variable, the peak would broadly follow solar elevation. But midday is also when module temperature has accumulated to its highest level: irradiance pushes output up while temperature drags it down through lower voltage. When the second effect offsets enough of the first, the day's highest output can fall before or after midday.
Thermal lag makes the offset more likely. In the morning irradiance climbs quickly while the module has not yet heated, so the penalty is weak; in the afternoon irradiance eases back while the module remains hot, so the penalty persists. This is qualitative only, with no clock time, magnitude or universal rule. Whether an offset appears depends on local climate, mounting, ventilation and array orientation, and must be settled from contemporaneous site records.
Chain three: MPPT tracking a moving peak
A module's current-voltage characteristic is not fixed: irradiance and temperature both reshape it, and the point of maximum power moves with it. MPPT adjusts the operating point of the power-electronics stage so the system keeps approaching that moving peak.
The operative word is available. MPPT decides where to sample the curve; it does not decide how high the curve is. When cloud cover suppresses irradiance, the ceiling on available power moves down with it, and even the fastest tracking can only find the new peak on the new curve. It cannot recover power the shadow removed. Reading MPPT as a stabiliser is the most common misreading of this chain. Adjusting the point requires sensing and iteration, so under rapid change it briefly departs from the ideal peak. This article compares no algorithms, quotes no tracking efficiency or response time, evaluates no implementation, and constitutes no selection or acceptance commitment.
Mapping the 3 chains and the grid-side effect
The first three chains compress into a checklist. The final column describes what should be visible in site records, not a device specification.
| Chain | External change | What shifts in between | Output behaviour | Observable evidence |
|---|---|---|---|---|
| Irradiance to current | Cloud shadow or solar position | Photocurrent follows effective irradiance | Steep fast change or slow envelope | Irradiance and output move together |
| Temperature to voltage | Module heat gain and loss | Open-circuit voltage falls as temperature rises; peak moves down | Output suppressed at equal irradiance | Temperature and output move oppositely |
| Characteristic to sampling | Characteristic is rewritten | Operating point follows the moving peak | Brief departure, then settling | Operating-point record tracks conditions |
| Transfer to connection point | Fast output variation injected | Power and voltage at the connection point swing | Voltage fluctuation and forecast error | Contemporaneous records align |
Once variability reaches the connection point, its nature changes from a device matter to a network matter. Fast-changing injected power shows up as voltage movement there; without a common time reference across irradiance, temperature, operating point and connection-point power, a later investigation cannot tie a dip to a cause. The ZSA embedded multi-function smart meter plays the role of a connection-point observation record at this stage; its integration must be reviewed against site circuits and metering requirements. Every table entry is a mechanism comparison and constitutes no selection or acceptance commitment.
Damping the swings: a 5-step attribution checklist
Be clear first about what can be smoothed. Storage acts downstream of the connection point, charging and discharging to flatten the net power the grid sees. Forecasting improves the expectation of future variability so dispatch can leave headroom. Neither alters irradiance, temperature or the peak position, and neither prevents a shadow. Forecasting methods and storage sizing belong to separate articles; this one gives no metrics and makes no selection recommendation.
Here is a practical way to tie a curve back to its causes. Step one, set the timescale: mark segments departing from the slow envelope, with boundaries and symmetry. Step two, separate the drivers: use contemporaneous irradiance records to decide whether irradiance, temperature or both are involved. Step three, match the chains: check whether each intermediate quantity moved in the predicted direction. Step four, audit the observation chain: confirm irradiance, temperature, operating point and connection-point power share one time reference and can be cross-indexed; the ZSA embedded multi-function smart meter supplies the connection-side record here, and has attribution value only once aligned with the other points. Step five, close and re-verify: set aside any segment that does not fit, add the missing point or fix alignment, then repeat the attribution.
The output of these 5 steps is a cause list with evidence locations, not a configuration conclusion, and constitutes no selection or acceptance commitment. Site judgements must be made by qualified personnel against contemporaneous records and project documents, and confirmed by an independent party. All deliverables remain pending review; the generator does not self-approve.
Frequently asked questions (FAQ)
Q: If the sun is strongest at midday, why is the highest point often elsewhere?
Irradiance and temperature rise together but pull in opposite directions, and module warming lags behind irradiance, so the peak can shift. Contemporaneous site records decide the actual case.
Q: A cloud only blocks the sun briefly, so why does the curve fall so deeply?
A shadow covers the array's illuminated surface, so effective irradiance and photocurrent fall together. With modules in series and parallel, total output is not a linear reduction of one shaded point. The test is whether irradiance moved at the same time and output returned to the same slow baseline.
Q: Can MPPT recover the variability caused by cloud cover?
No. MPPT selects a point on the current characteristic; it does not change how high that characteristic is. Cloud cover lowers the ceiling on available power, so tracking only finds the new peak.
Q: Once storage is installed, does the variability disappear?
The net power at the connection point can be smoothed, but module-level output still follows irradiance and temperature. Neither storage nor forecasting changes the mechanism; sizing belongs to a separate article.
Q: Can inverter readings alone tell whether a swing came from irradiance or temperature?
Not enough information. Both drivers appear as a change in output, so irradiance, temperature and operating-point records must be read together with a consistent time reference. This article offers an attribution method and constitutes no selection or acceptance commitment.
Scope and limitations
This article is for PV operations staff and energy managers. It explains why distributed PV output swings: the 2 external drivers (irradiance and module temperature), the 3 transmission chains (irradiance to current, temperature to voltage, characteristic to sampling), MPPT as an internal response, and how fast variability reaches the connection point, with a 5-step attribution checklist. It is not a comparison of forecasting methods, an error-metric account, a storage sizing guide or a hardware configuration guide.
No standard number, standard name, clause, limit, compliance determination, measured value, engineering coefficient or product performance figure appears here. Every mechanism is a qualitative account of publicly established PV device physics: direction and causality only, never magnitude. The comparison table and the checklist are statements of method and represent no real product, project or customer; every conclusion constitutes no selection or acceptance commitment. The ZSA embedded multi-function smart meter appears only as a connection-side observation role, with no specifications and no recommendation. Practical judgement and acceptance must be carried out by qualified personnel against contemporaneous site records and project documents, and confirmed by an independent party. All deliverables remain pending review; the generator does not self-approve.
Frequently Asked Questions
Why PV Output Swings
PV output swings come from 2 external drivers and one internal response