 FEXLINK Research Institute
The short answer
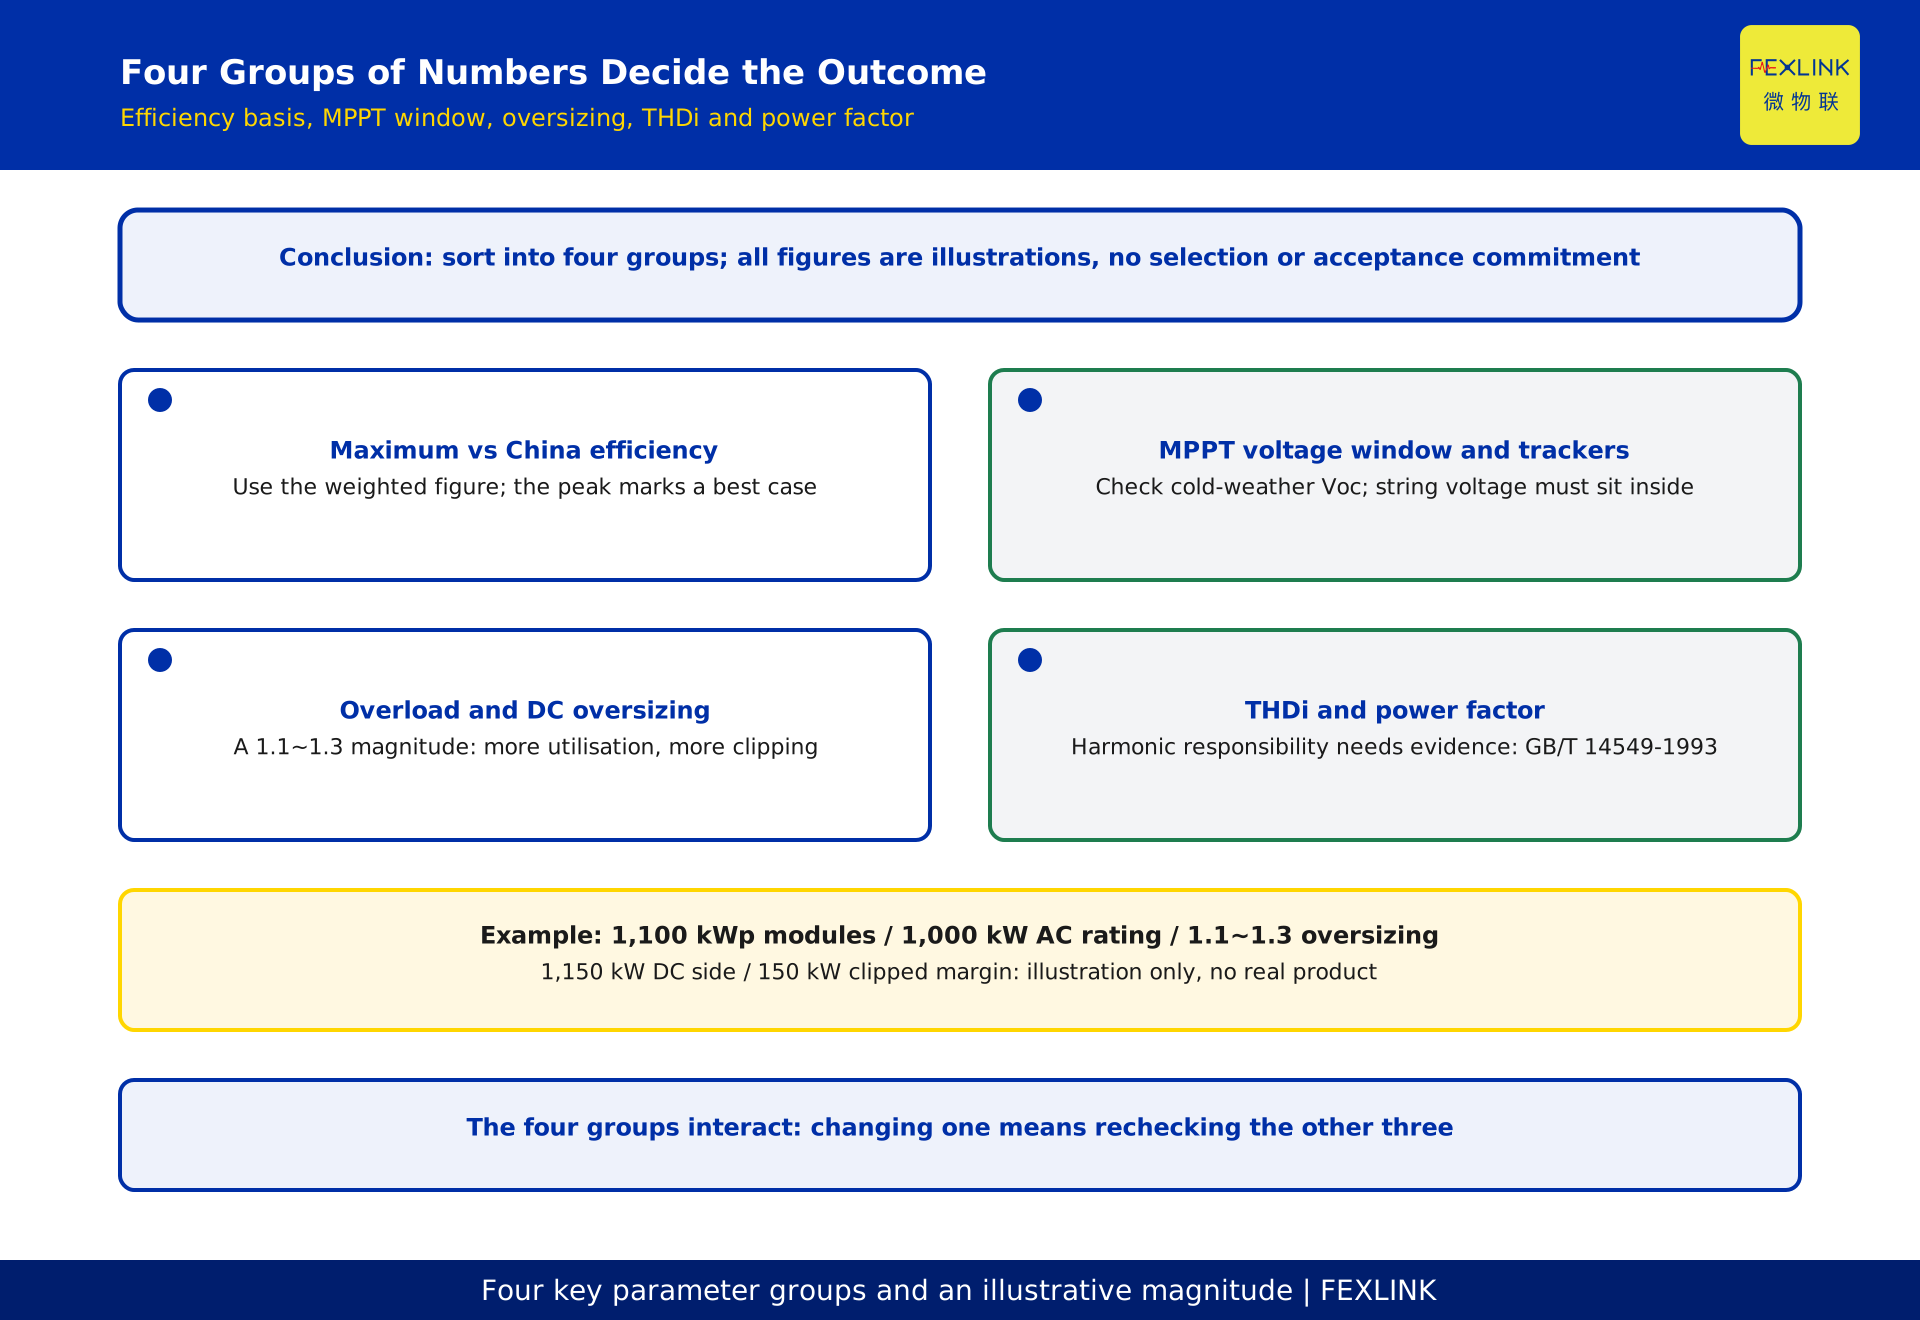
Only four groups of numbers on an inverter spec sheet change a project outcome. Maximum efficiency and China efficiency set the basis for estimating long-term yield. The MPPT voltage window and tracker count decide whether module strings can be matched. Overload capability and the DC oversizing ratio decide how much of the equipment investment is used. THDi and power factor decide power quality at the point of common coupling and how harmonic responsibility is allocated. The test: does each number change yield, matchability, utilisation or grid-side responsibility? This article uses one constructed example - 1,100 kWp on the DC side, 1,000 kW rated AC output, an oversizing ratio of 1.1, against a common magnitude of 1.1~1.3 times. Every figure is a magnitude illustration only: it represents no real product, project or customer and constitutes no selection or acceptance commitment. Actual values come from the current standard text, vendor evidence, measured data and local utility requirements.
Why a spec sheet hides the important numbers
The problem is not the count but the flattening. Performance figures cover efficiency and losses; matchability figures cover the DC voltage window, maximum input current and MPPT tracker count; capacity figures cover rated output, overload capability and the oversizing ratio; power quality figures cover THDi, power factor and harmonics. Units are mixed - kW on the AC side, kWp on the module side - and test conditions are omitted, so the load point behind an efficiency figure often goes unstated. Group first: assign each item to yield, matchability, utilisation or grid-side responsibility; anything fitting none does not enter the comparison, and anything fitting one must have its test conditions and evidence format supplied.
Group one: maximum efficiency and China efficiency
Maximum efficiency is the peak conversion efficiency measured under laboratory or optimum conditions - a ceiling of devices and topology, not a description of where the unit runs. China efficiency is a composite built by weighting efficiencies at different load levels according to a typical solar resource distribution; European and California efficiency belong to the same family and differ only in the regional irradiance distribution supplying the weights (source: public industry primers on weighted efficiency). They are not two notations for one quantity.
For yield the weighted value explains more; putting a peak into a yield calculation assumes the unit sits at its optimum all year. Ask for both the efficiency curve and the weighting convention - load points, weights, test conditions; a single number is not enough to enter a comparison.
Why a weighted efficiency tracks real yield better than a peak
Irradiance rises and falls through the day, so an inverter spends most of its time away from its optimum load level, and the operating point is usually away from where the peak was measured. A peak describes one point on a curve; yield is the integral along the whole trajectory.
A weighted efficiency divides output into several load bands, multiplies each band's efficiency by its share of time under typical irradiance, and sums them. Not exact for one project, but it accounts for a unit behaving differently at different loads. Two models with identical peaks can therefore separate over a year if their low-load behaviour differs. The test: require the efficiency curve plus the load points and weights, compare only when both are supplied, and never use a lone peak for yield calculations. No specific efficiency figure is given here; actual values come from vendor evidence and measurement.
Group two: MPPT voltage window and tracker count
The MPPT voltage window is the DC range in which the inverter can hold a string at maximum power point tracking. Tracker count decides whether strings with different orientations, shading or commissioning phases can be tracked independently.
Check both ends: as temperature falls, module open-circuit voltage rises, so string open-circuit voltage at the extreme low temperature must not exceed the inverter's maximum DC voltage; as temperature rises, operating voltage falls, so it must not drop below the lower edge of the MPPT window. Recompute both with project temperatures and module coefficients. Tracker count matters because of mismatch: tying dissimilar strings to one tracker forces a compromise point, while more trackers let each string find its own maximum power point. The test: obtain the window, maximum DC voltage, maximum input current per tracker and the temperature-coefficient check sheet, then recompute. A model that fails is excluded.
Group three: overload capability and DC oversizing
The DC oversizing ratio is module installed capacity divided by rated AC capacity (source: common PV system design practice); the common magnitude given in the registry is 1.1~1.3 times. Modules rarely produce at nameplate, so oversizing raises utilisation; the cost is midday clipping, thermal derating and stress. Overload capability is the ability to briefly exceed rated AC output - a different thing.
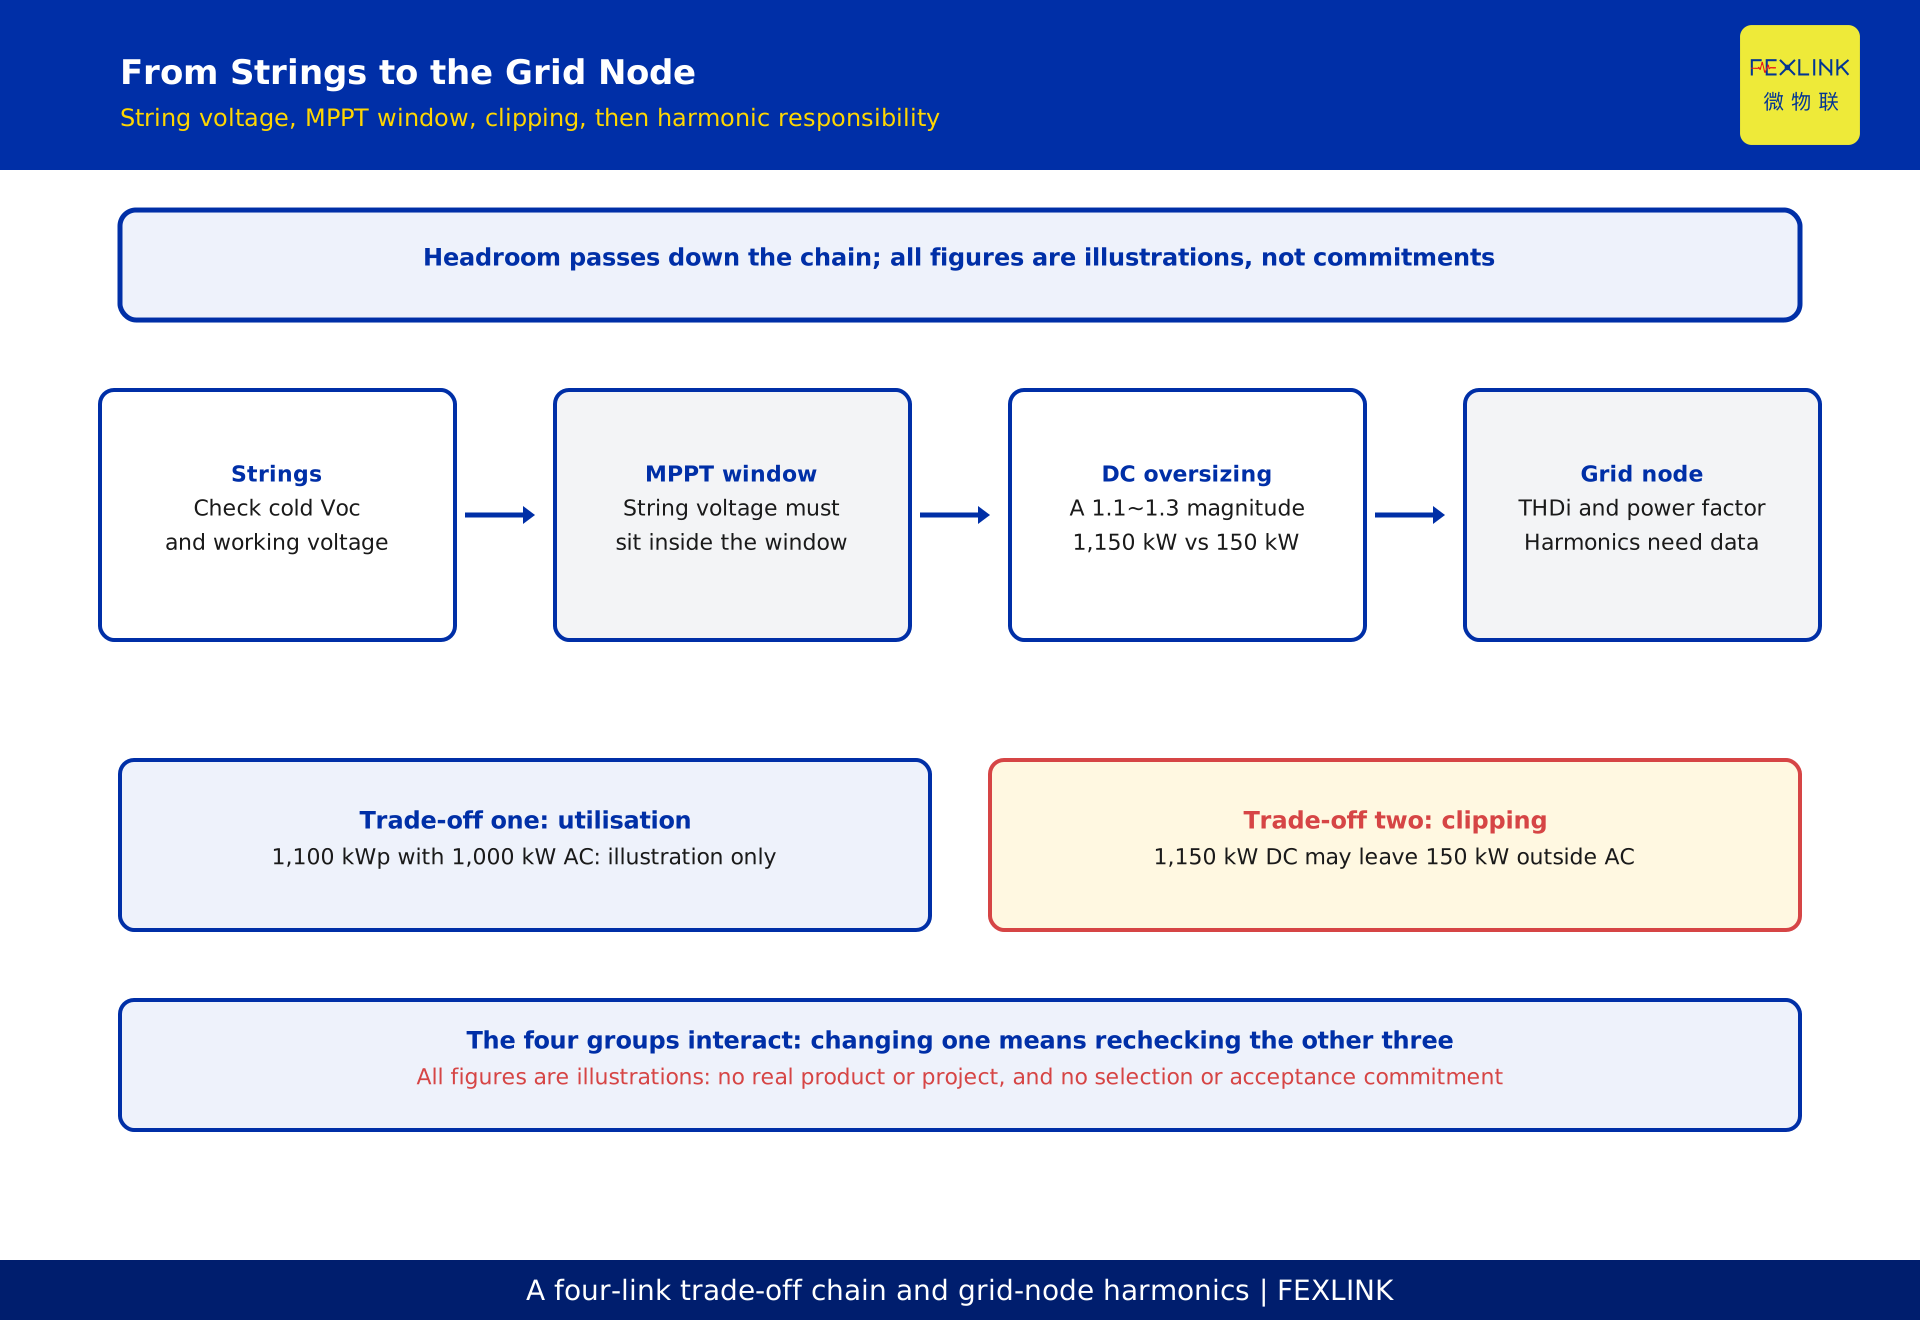
A constructed example (figures are magnitude illustrations, not a real project and not a product commitment): 1,100 kWp on the DC side, 1,000 kW rated AC output, so the ratio is 1.1; at one moment 1,150 kW is available on the DC side while the AC side is held at 1,000 kW, and the 150 kW difference is the power clipped in that interval. Raising the ratio from 1.1 to 1.3 may lengthen full-load hours, but clipping hours, thermal derating and stress grow with it.
The test is not "what ratio is right": estimate annual clipping hours from typical-year hourly irradiance and module data, compare the energy gain from extra modules against clipping loss plus equipment stress, and proceed only if the gain is positive.
Group four: THDi and power factor
THDi is total harmonic current distortion at the point of common coupling; power factor expresses the relation between active and reactive power. Together they describe how clean the injected current is. They do not change yield, but decide power quality and harmonic responsibility.
GB/T 14549-1993, "Quality of electric energy supply - Harmonics in public supply network", is the current national standard commonly cited here (source: the standard information page of the National Standard Full-Text Open System). This article cites only its name, number and current status: no specific harmonic voltage limit, no harmonic current allowance, no clause number, and no compliance judgment; applicable limits come from the current standard text and local utility requirements. Make harmonic responsibility observable: record harmonics and operating condition at the point of common coupling. That is the role of the ESE power quality monitor here. The test: require the vendor to state the THDi test conditions and the adjustable power factor range. A lone value with no conditions is evidence pending.
How the four groups pull against each other
These are not independent scores but one trade-off chain. Push the oversizing ratio up and DC-side available power reaches the AC rating more often, so clipping hours lengthen; clipping shifts the load band and the weighted-efficiency basis. In the constructed example, 1,150 kW available against 1,000 kW of AC output and a 150 kW difference is the most visible link.
The MPPT window and tracker count decide whether strings deliver available power steadily: a narrow window or too few trackers stacks mismatch loss onto the oversizing ledger. Order therefore matters - fix window and tracker count from module data, fix oversizing and clipping from hourly irradiance, return to weighted efficiency, then align the monitoring convention. Skip a step and attractive numbers never reach the yield calculation.
A magnitude table: what to check for each parameter
The table compresses the four groups; the magnitude column states conventions, not product values.
| Parameter group | Magnitude or convention to check | What it changes | Evidence to request |
|---|---|---|---|
| Maximum and China efficiency | Efficiency curve plus weighting convention, not a single peak | Yield estimate | Efficiency at each load point, weights, test conditions |
| MPPT voltage window and tracker count | Window edges plus tracker count | Module matchability and mismatch loss | Maximum DC voltage, voltage window, temperature-coefficient check sheet |
| Overload capability and DC oversizing | 1.1~1.3 times, with clipping from hourly irradiance | Utilisation and clipping loss | Rated AC output, overload curve, clipping strategy |
| THDi and power factor | Test conditions and adjustable range, not a single value | Power quality and harmonic responsibility | Test conditions, adjustable range, monitoring convention |
The 1.1~1.3 times figure and the example values of 1,100 kWp, 1,000 kW, 1,150 kW and 150 kW are illustrations - not product parameters, not limits, and no selection or acceptance commitment. Actual values come from the current standard text, project documents, vendor evidence and measured data.
From spec sheet to selection: what evidence to request
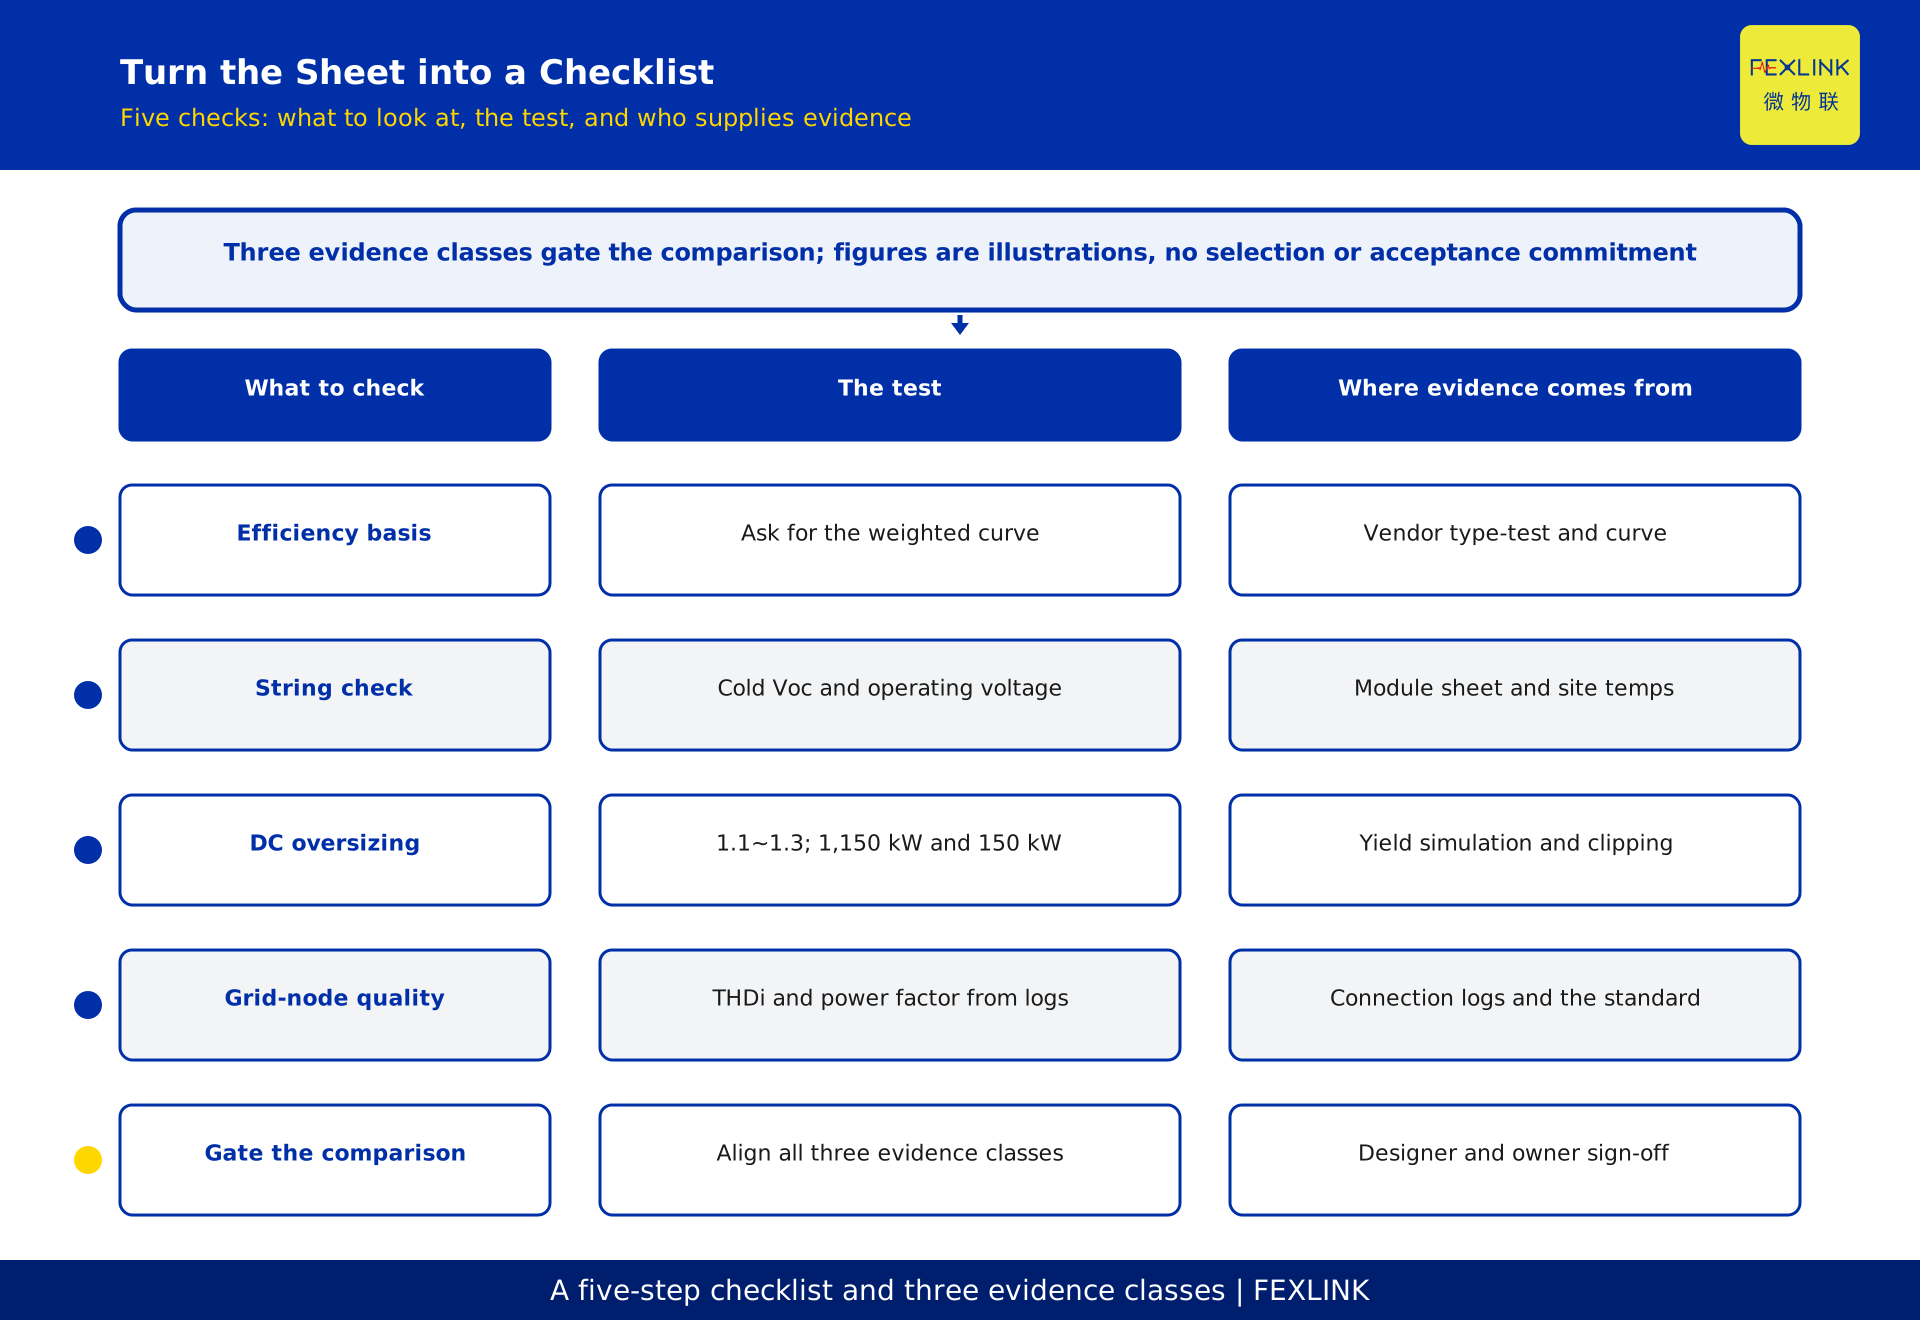
One concrete recommendation: gate the comparison on three classes of evidence, and mark any model missing one as evidence pending rather than ranking it. For efficiency, require the curve and the weighting convention - load points, weights, test conditions; without any one, the model does not enter the yield comparison. For matchability and capacity, require the MPPT voltage window, maximum DC voltage, maximum input current per tracker, the temperature-coefficient check sheet, the overload curve and the clipping strategy, and have the designer recompute once; a model that fails is excluded. For power quality, require the THDi test conditions, the adjustable power factor range and the monitoring convention.
One more test: when two models differ only in single-point peak efficiency while weighting conventions and evidence completeness match, prefer the one with the complete evidence chain - a peak difference cannot bridge an evidence gap. On a commercial rooftop PV project, a review of these three classes found both suppliers offering only a single peak figure and a verbal "it generally matches"; the team requested evidence first. Write the evidence list into the enquiry.
Frequently asked questions (FAQ)
Q: Does a higher maximum efficiency guarantee higher energy yield?
No. Maximum efficiency is a peak at the optimum operating point, and the unit spends most of its time elsewhere; yield depends more on weighted efficiency and low-load behaviour.
Q: Is more DC oversizing always more economical?
No. The 1.1~1.3 times range is only a common magnitude. Oversizing raises utilisation but adds clipping, derating and stress. In the constructed example, 1,150 kW available against 1,000 kW of AC output leaves a 150 kW difference as the cost. The test is energy gain minus clipping loss, not the ratio itself.
Q: Can extra MPPT trackers recover shading losses?
They reduce series mismatch; they do not remove shading. More trackers let strings with different orientations and shading track independently, while shading inside a string still needs string design and layout. Check both temperature ends first.
Q: If THDi is printed on the spec sheet, does the point of common coupling comply?
No. A printed THDi is a value under specific test conditions, and power quality at the point of common coupling also depends on grid background, other equipment and wiring. GB/T 14549-1993 is the current standard cited here; this article gives no specific limit, no clause number and makes no compliance judgment. Determination requires the current standard text, local requirements and measurement.
Q: Can these figures be used directly for selection or acceptance?
No. The 1,100 kWp, 1,000 kW, 1.1~1.3 times, 1,150 kW and 150 kW in this article are magnitude illustrations constructed to explain the trade-off logic. They represent no real product, project or customer and constitute no selection or acceptance commitment. Actual values come from the current standard text, vendor evidence and measured data. All deliverables remain pending review; the generator does not self-approve.
Scope and limitations
This article is for PV designers, selection engineers and electrical engineers. It sets out what four groups of numbers on an inverter spec sheet change - maximum efficiency and China efficiency, MPPT voltage window and tracker count, overload capability and DC oversizing, THDi and power factor - and which evidence to request. It is not a checklist for monitoring devices, reverse-power-flow mechanisms, MPPT tracking algorithms or grid-export modes.
Only the name, number and current status of GB/T 14549-1993 are cited. No specific harmonic voltage limit, harmonic current allowance, clause number or compliance judgment is provided. The 1,100 kWp, 1,000 kW, 1.1~1.3 times, 1,150 kW and 150 kW figures and the table are magnitude illustrations constructed to explain the trade-off logic; they represent no real product, project or customer and constitute no selection, settlement or acceptance commitment. The ESE power quality monitor appears only as an observability role. Design, selection, grid connection and acceptance must be carried out by qualified personnel under the current standard text, project documents, vendor evidence, measured data and local utility requirements, and reviewed independently. All deliverables remain pending review; the generator does not self-approve.
Frequently Asked Questions
Reading PV Inverter Spec Sheets
Only four groups of numbers on an inverter spec sheet change a project outcome