 FEXLINK Research Institute
The short answer
Source-grid-load-storage integration is not "add another PV array or another battery." It is treating the power source, the distribution grid, the adjustable load and the storage as one whole that can be optimized together. The old model could only do "supply follows demand" — generation passively chases consumption, producing as much as is used. Integration upgrades that to a two-way interaction: supply follows load, load follows supply, and storage buffers between them. The difference is not whether you own the equipment; it is whether the four links are optimized as one system.
1. What "supply follows demand" actually means
Break the four Chinese characters apart. Source is the generation side. Grid is the transmission and distribution side. Load is the consumption side — the parks and factories. Storage is, naturally, the storage. "Supply follows demand" describes the basic operating logic of power systems for decades: the load decides how much electricity is needed, and the source generates that much.
In this logic the consumer is the independent variable and the generator is the dependent variable. When factories start shifts and air-conditioning peaks during the day, the grid pushes generation up; when load drops at night, units ramp down. The generation side is forever chasing the load, rather than the load helping the generation.
2. Why the traditional model could only do "supply follows demand"
The root cause is a single, narrow set of control levers. Power sources used to be dominated by large central plants. Those plants can ramp, but load fluctuates in small, fast, widely scattered steps across thousands of sites. In an era without scaled storage and without flexible commercial and industrial load, the grid could only operate on a one-way rule: load rises, generate more; load falls, generate less.
The more important point is that the generation side was passive. It could only watch the load and chase it. It could not store midday surplus PV for the evening, and it could not ask part of the load to step aside during the evening peak. Source, grid, load and storage were islands, each dispatched on its own, with no one in the middle saying "what is optimal for the whole right now."
3. The four links and the role each one plays
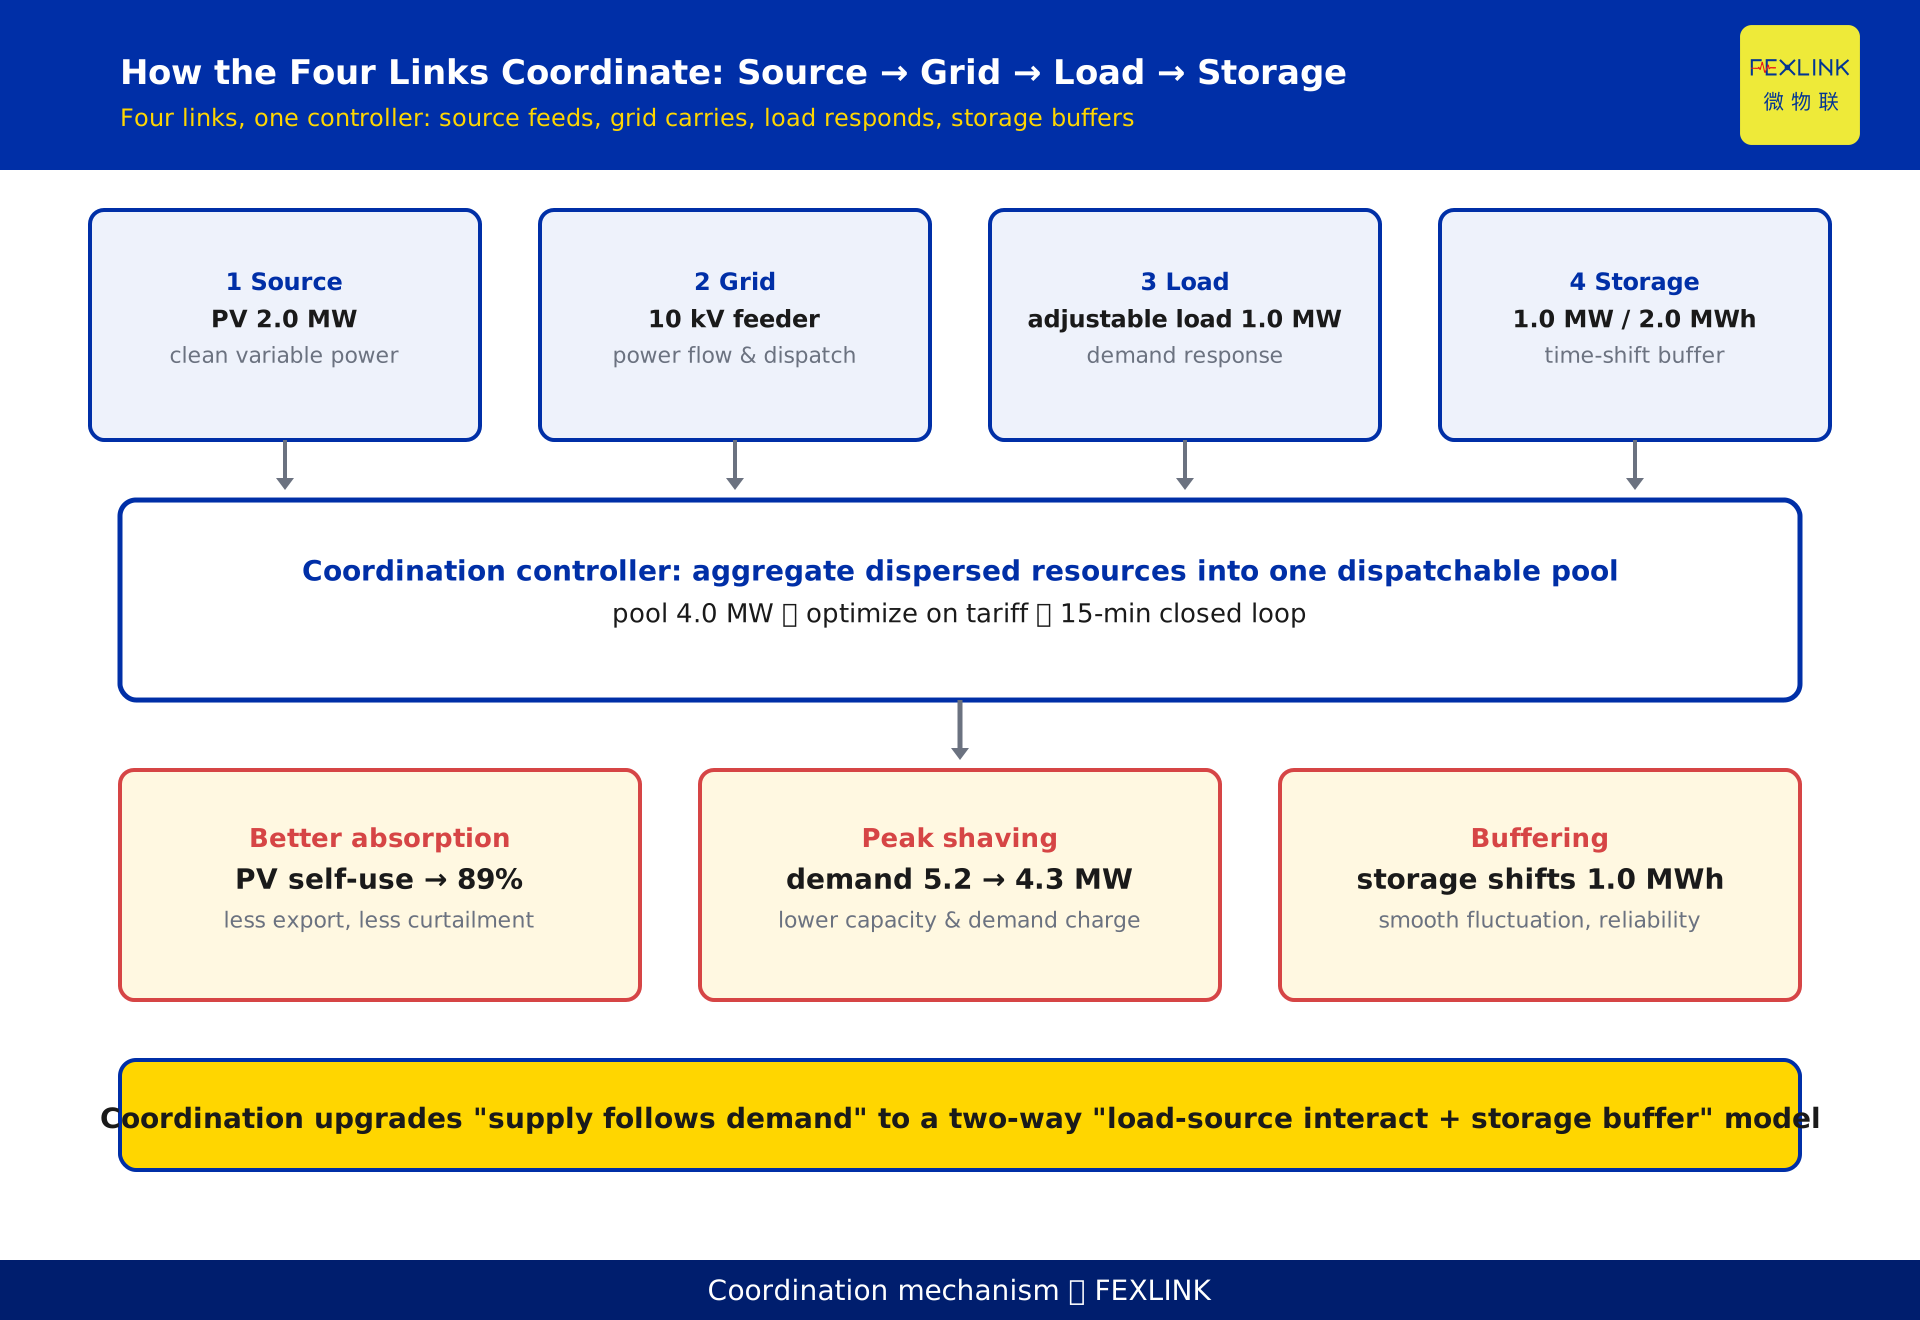
Integration gives each of the four islands a complementary job and then coordinates them. Take a constructed example site (for illustration only, representing no real customer): 2.0 MW of distributed PV, a 10 kV feeder, 1.0 MW of adjustable load, and 1.0 MW / 2.0 MWh of storage.
- Source provides clean, dispatchable-variable power. Distributed PV outputs during the day and varies with sun and wind — cheap, but capricious.
- Grid is the power-flow channel and the dispatch interface with the external grid. The 10 kV feeder is both the park's intake and its export path for surplus or support.
- Load is the part of consumption that "understands dispatch commands" — shiftable production steps, deferrable HVAC and pumps — able to respond to demand response and shave the evening peak.
- Storage performs time-shift and buffering: it banks midday surplus and moves it to the evening, smoothing fluctuations on both sides.
Once these four roles are dispatched as one, they stop being separate boxes and become four pieces on the same board.
4. What it means when "load follows source" also holds
The traditional model has only one direction: supply follows demand. The essence of integration is making the second direction true as well. When PV is abundant, prices are low and green power is plentiful, the load side actively moves interruptible or shiftable consumption into that window to absorb it. When load hits the evening peak, storage discharges to fill the gap and adjustable load steps down.
In other words, "supply follows load" and "load follows supply" hold simultaneously inside the same system, with storage buffering in the middle. That is the entire meaning of "two-way interaction": the system moves from the one-way "generate as much as is used" to a two-way "source and load move toward each other while storage catches the difference."
5. Integration is not "install a PV array plus a battery"
This is the easiest trap. A standalone PV array is just one more source: at noon it over-produces, and what you cannot use is exported cheaply or curtailed, so self-use stays low. A standalone battery is just one more charge-discharge vessel: without adjustable load to pair with and without unified dispatch, it shifts no value — it merely stores and releases.
The key to integration is not "do you have the equipment" but "are the four links optimized as one whole." Equipment is parts; coordination is the model. The numbers below make that distinction concrete.
6. The difference in one constructed example
The figures below come from a constructed example site created to explain the mechanism, representing no real customer; actual projects must be verified on site.
| Metric | Old "supply follows demand" | Integrated |
|---|---|---|
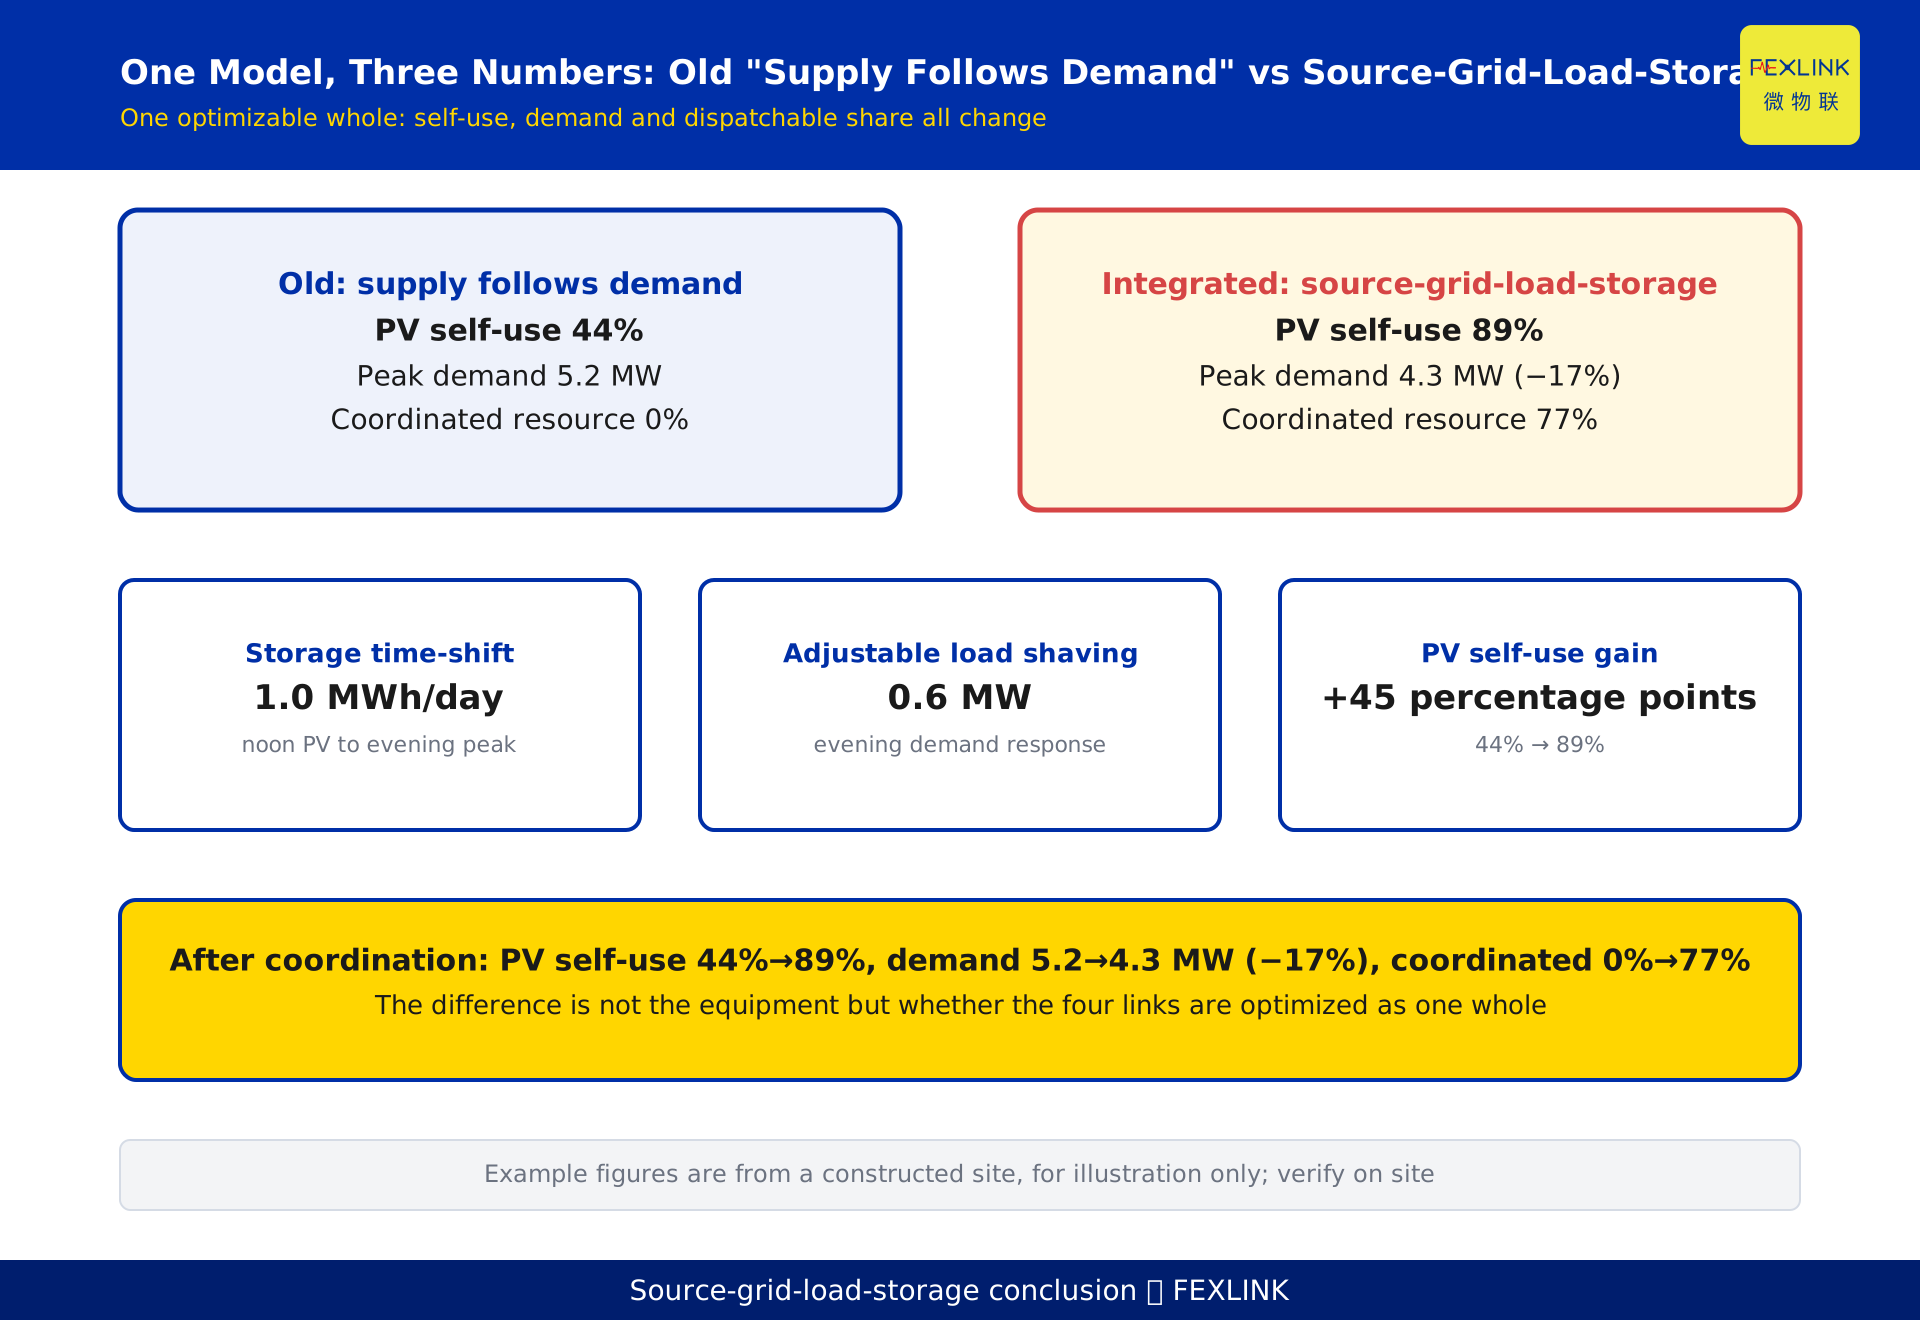
| PV self-use rate | 44% | 89% |
| Peak demand | 5.2 MW | 4.3 MW (−17%) |
| Coordinated resource share | 0% | 77% |
Where does the gap come from? Three levers:
- Storage time-shift of 1.0 MWh per day: move midday PV surplus to the evening peak instead of exporting or curtailing it.
- Adjustable-load shaving of 0.6 MW: respond to demand response in the evening peak and actively push part of the load down.
- PV self-use gain of 45 percentage points: from 44% to 89%, less export and less curtailment.
Doing any one of these alone is unremarkable. What is remarkable is that they are computed together, in the same optimization table, by the same controller. That is the real difference between integration and "just add a PV array or a battery."
7. The coordination controller: tying the four links into one rope
What actually ties the four links together is the source-grid-load-storage coordination controller. It aggregates the dispersed resources on the source, grid, load and storage into one dispatchable resource pool — in this constructed site, a pool of 4.0 MW of dispatchable resources, optimized on the tariff curve, running a 15-minute closed loop.
The controller delivers three quantifiable results:
- Better absorption: PV self-use rises from 44% to 89%, with less export and less curtailment.
- Peak shaving: peak demand falls from 5.2 MW to 4.3 MW, directly cutting capacity and demand charges.
- Buffering: storage shifts 1.0 MWh, smoothing fluctuations on both sides and protecting reliability.
"Optimize on the tariff" is not guesswork. It means reading the time-of-use price curve and deciding, period by period, whether to discharge, shed load or charge right now — then closing the loop against measurements within 15 minutes.
8. The three concrete accounts for the user side
For the park or factory energy manager, integration settles three clear accounts:
- Absorption account: PV self-use rises from 44% to 89%. Power that used to be sold cheaply or curtailed stays inside your own plant, and green-power absorption becomes clean and auditable.
- Electricity-cost account: peak demand falls from 5.2 MW to 4.3 MW, so the basic charge (by capacity or by demand) drops; add time-of-use arbitrage and demand-response revenue, and the cost structure improves markedly.
- Reliability account: storage, as a buffer, steps in during external voltage swings, short outages or internal load spikes, protecting critical processes from shock.
These three accounts are not marketing language. They are three physical and financial quantities that can be measured and audited.
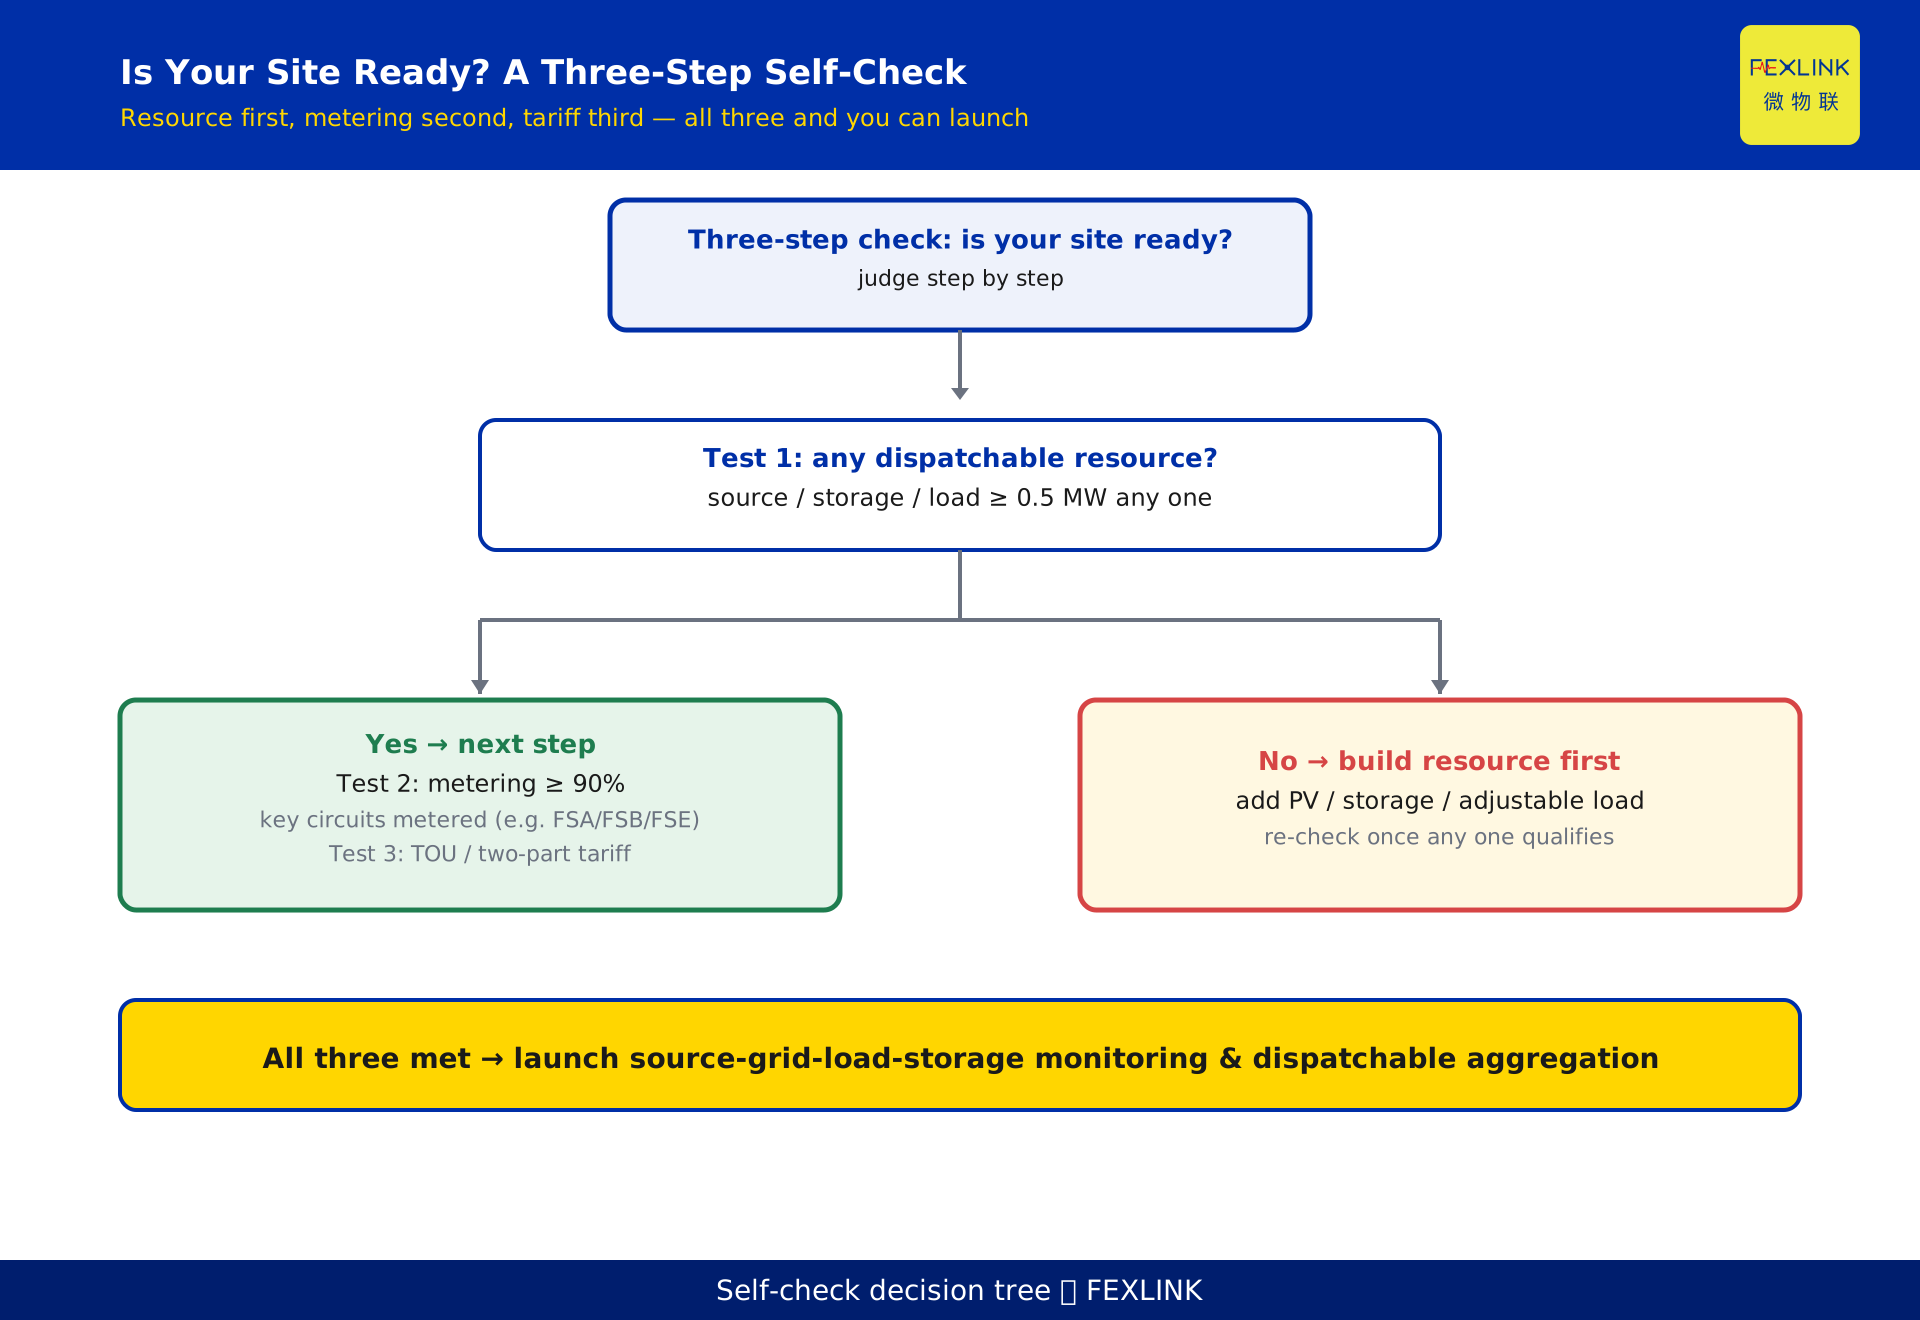
9. A three-step self-check: is your site ready?
Not every park should start immediately. Run a three-step self-check — judge step by step, no need to do it all at once:
- Test 1: any dispatchable resource? If source, storage or load reaches at least 0.5 MW on any one link, you can start.
- Test 2: enough metering? Key circuits need a metering coverage of at least 90%. Key circuits must actually be measured — for example, with FEXLINK FSA/FSB/FSE multi-element electrical measurement and control units that capture energy, voltage, current and power on the main circuits, so the controller has visible data to optimize with.
- Test 3: the right tariff structure? The park should be on time-of-use or two-part tariffs, with a wide enough peak-valley spread for dispatch to have room.
When all three are met, you can launch "source-grid-load-storage monitoring and dispatchable resource aggregation": monitor first, aggregate the dispatchable resources next, and optimize the dispatch last. If any test fails, fix that one first — add PV, storage or adjustable load, and re-check once any link qualifies.
10. Frequently asked questions (FAQ)
Q: Is source-grid-load-storage integration the same thing as a microgrid?
No. A microgrid emphasizes how power forms a local system and whether it can run islanded, focusing on the balance of sources and loads inside one electrical boundary. Integration emphasizes how the four links coordinate and optimize, and it can sit inside a microgrid or inside a grid-connected park or a single factory's energy system. They are different dimensions and may overlap, but they are not the same.
Q: Our park already has PV and storage installed — are we already "integrated"?
Probably not. Having the equipment is not the same as having the model. If PV, storage and load run independently with no unified dispatch, you only have "three devices coexisting," not "four links optimized together." The hard test of integration is whether a coordination controller aggregates the dispatchable resources into a pool, optimizes them on the tariff curve, and runs a closed loop. Without that step, more equipment is still islands.
Q: When the controller dispatches, will it forcibly shut down production load?
It will not. Adjustable load means the part of consumption that "understands dispatch and does not compromise process safety" — deferrable HVAC, off-peak auxiliary steps, shiftable non-critical pumps. The controller moves elastic load into cheaper or greener periods while protecting production; it does not cut power to halt output. Which loads are adjustable must be confirmed circuit by circuit on site and governed by project documents.
Q: Is it worth doing for a small park with very stable load and no obvious peak-valley spread?
Start with Test 1 and Test 3. If you have neither 0.5 MW-class dispatchable resources nor a time-of-use or two-part tariff that creates a price spread, the optimization has too few cards to play and the return may not justify the spend. The realistic move for such parks is to first improve metering coverage and map the load curve, then launch aggregated dispatch once dispatchable resources and a price spread are in place.
Q: How should I read the "≥90%" metering threshold, and why stress key circuits?
The 90% is the metering coverage of major energy-consuming circuits, not "every socket in the plant must have a meter." The point is to fully measure the key circuits that dominate total consumption and are adjustable and controllable. Only when the controller can "see" their energy, power and operating state can it make optimization decisions. Filling the key-circuit measurement with FSA/FSB/FSE-class multi-element units is often cheaper than metering the entire plant.
Scope and limitations
- The source-grid-load-storage integration discussed here applies to parks and factories that have some distributed generation, adjustable load or storage, and operate under time-of-use or two-part tariffs. A purely flat-tariff site with minimal load and no dispatchable resource has limited optimization room and should build resources first.
- All figures in this article (PV self-use 44% to 89%, peak demand 5.2 to 4.3 MW, coordinated resource 0% to 77%, storage shift 1.0 MWh/day, adjustable-load shaving 0.6 MW, aggregated dispatchable resource 4.0 MW, 15-minute closed loop, and the 0.5 MW and 90% thresholds) come from a constructed example site created to explain the mechanism. They represent no real customer or project and constitute no performance promise for any project; actual metrics must be derived from on-site survey and measurement.
- Specific models and parameters of the FEXLINK FSA/FSB/FSE multi-element electrical measurement and control units follow the latest selection manual and product knowledge base; this article is not a selection or procurement recommendation.
- This article cites no specific standard number, clause number or limit value. Where the project location has current standards for source-grid-load-storage, grid connection or metering, those current standards and project documents govern.
- The controller's dispatch boundary, the adjustable-load list and the tariff structure must all be confirmed circuit by circuit on site and governed by project documents and the local utility's practice. This article is a conceptual analysis and a model portrait, not an engineering implementation plan.
- All deliverables for this article are DRAFT_PENDING_REVIEW; the generator does not self-approve and an independent review is required before publication.
Frequently Asked Questions
What Source-Grid-Load-Storage Integration Actually Means
Source-grid-load-storage integration is not "add another PV array or another battery." It is treating the power source, the distribution grid