 FEXLINK Research Institute
The short answer
Whether commercial and industrial (C&I) storage actually makes money comes down to one sentence: daily revenue ≈ peak–valley spread × energy cycled per day × operating days per year, minus round-trip efficiency losses, battery degradation and O&M. It only works where the local time-of-use spread is wide enough (a constructed example uses above 0.70 CNY/kWh) and the battery completes two full charge–discharge cycles a day. With one cycle a day, revenue is cut in half and payback stretches to around 10 years, which rarely motivates owners.
1. A plain arithmetic of one arbitrage account
When the facilities team recommends storage and the owner asks "how long until it pays back," they are asking the arbitrage account: charge when tariffs are low, discharge when high, keep the difference. The account has four parts — spread, capacity, cycles, days — yet each can shrink.
Below is a worked example with numbers constructed to illustrate the method:
- Usable storage capacity: 1000 kWh (1 MWh), with a 500 kW PCS, i.e. a 2-hour system.
- Round-trip efficiency (PCS + battery): 90%.
- Time-of-use tariffs (constructed): peak 1.05 CNY/kWh, mid 0.65 CNY/kWh, valley 0.35 CNY/kWh; peak–valley spread 0.70 CNY/kWh.
- Operating days: 300 per year (after maintenance, downtime and extreme weather).
- System investment: 1,500,000 CNY (1.5 million), estimated at 1.50 CNY/Wh.
- Annual O&M: 30,000 CNY (30k).
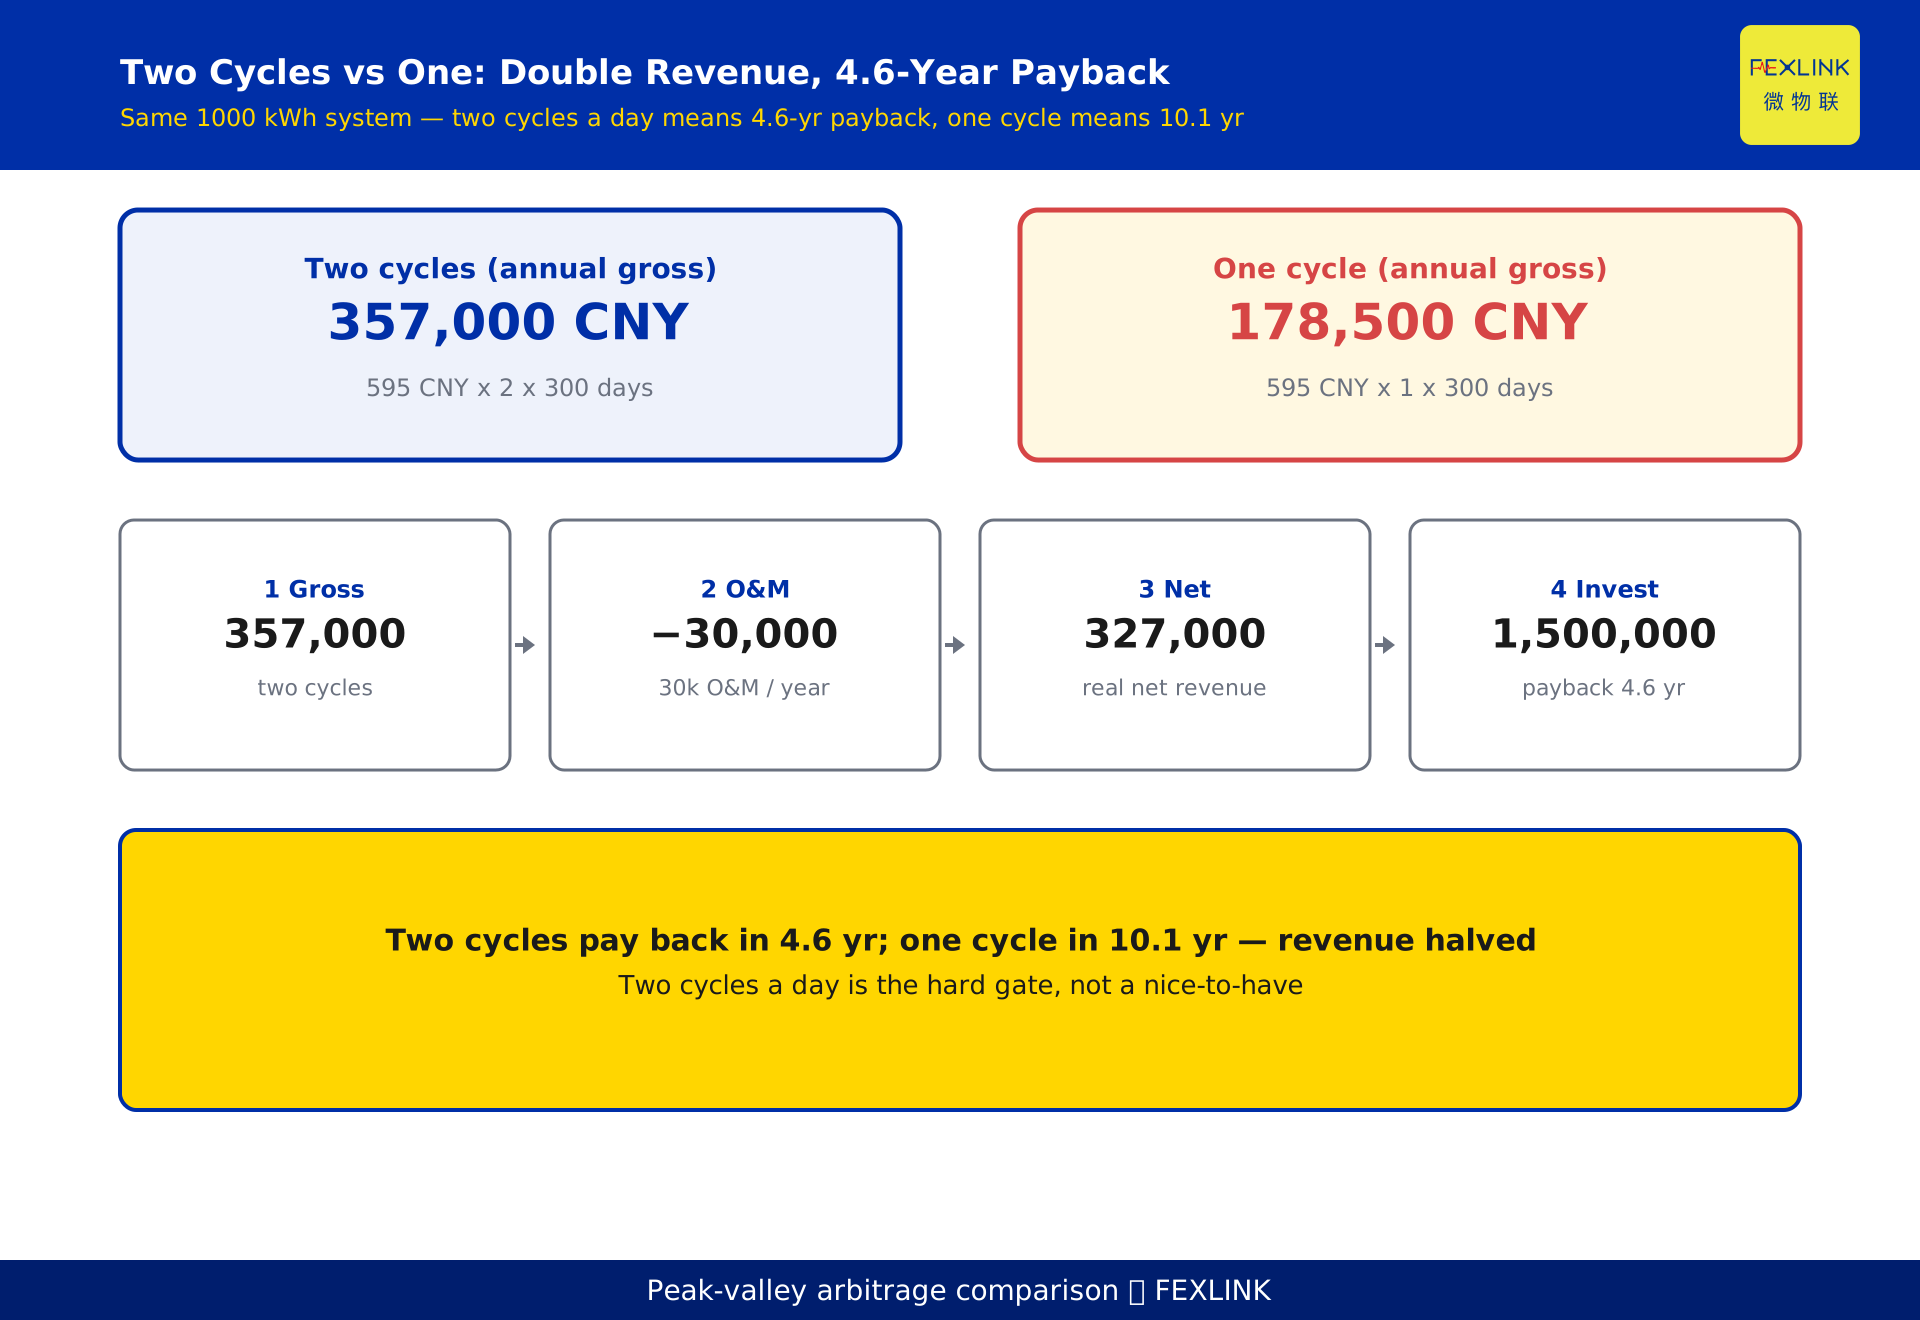
One cycle yields 595 CNY gross; two cycles a day gives 1190 CNY/day and 357,000 CNY/year gross. After subtracting 30k O&M, net annual revenue is 327,000 CNY; dividing by the 1.5 million investment gives a payback of about 4.6 years — the whole arithmetic.
2. The peak–valley spread is the ceiling
The peak–valley spread is the ceiling of the account. It comes from the local grid's time-of-use tariff sheet, not the storage equipment: each day is split into peak, mid and valley bands, prices published by provincial grid companies. Storage only moves energy from cheap bands to expensive ones; the upside is capped by the spread.
So judging a site starts with the spread, not equipment price. If the spread is thin, no efficiency or cycle count can fill the fixed investment. This article sets a constructed threshold of 0.70 CNY/kWh as a ruler for scale; the real threshold must be re-derived from local tariffs and system cost.
Some provinces add sharp-peak and deep-valley bands — wider spread but shorter windows. Sum the spread band by band; a vague "average price gap" hides the truth.
3. Two cycles a day vs one: the revenue doubles
Whether the same 1000 kWh system completes two full cycles a day is the revenue watershed.
Two cycles: a daytime "valley charge, peak discharge" plus a nighttime repeat gives 1190 CNY/day and 357,000 CNY/year gross.
One cycle: charge once at night, discharge once in the day, gives 595 CNY/day and 178,500 CNY/year gross — exactly half.
After the same 30k O&M, one cycle yields 148,500 CNY net, payback 1,500,000 ÷ 148,500 ≈ 10.1 years — a horizon that rarely motivates plant owners. So "two cycles a day" is the hard test of whether this track runs at all, needing two chargeable valley bands, two dischargeable peak bands, and a PCS strong enough to fill and empty the battery in those windows.
4. How much does round-trip efficiency eat?
The 595 CNY/cycle margin already assumes 90% round-trip efficiency, yet many miss this cut.
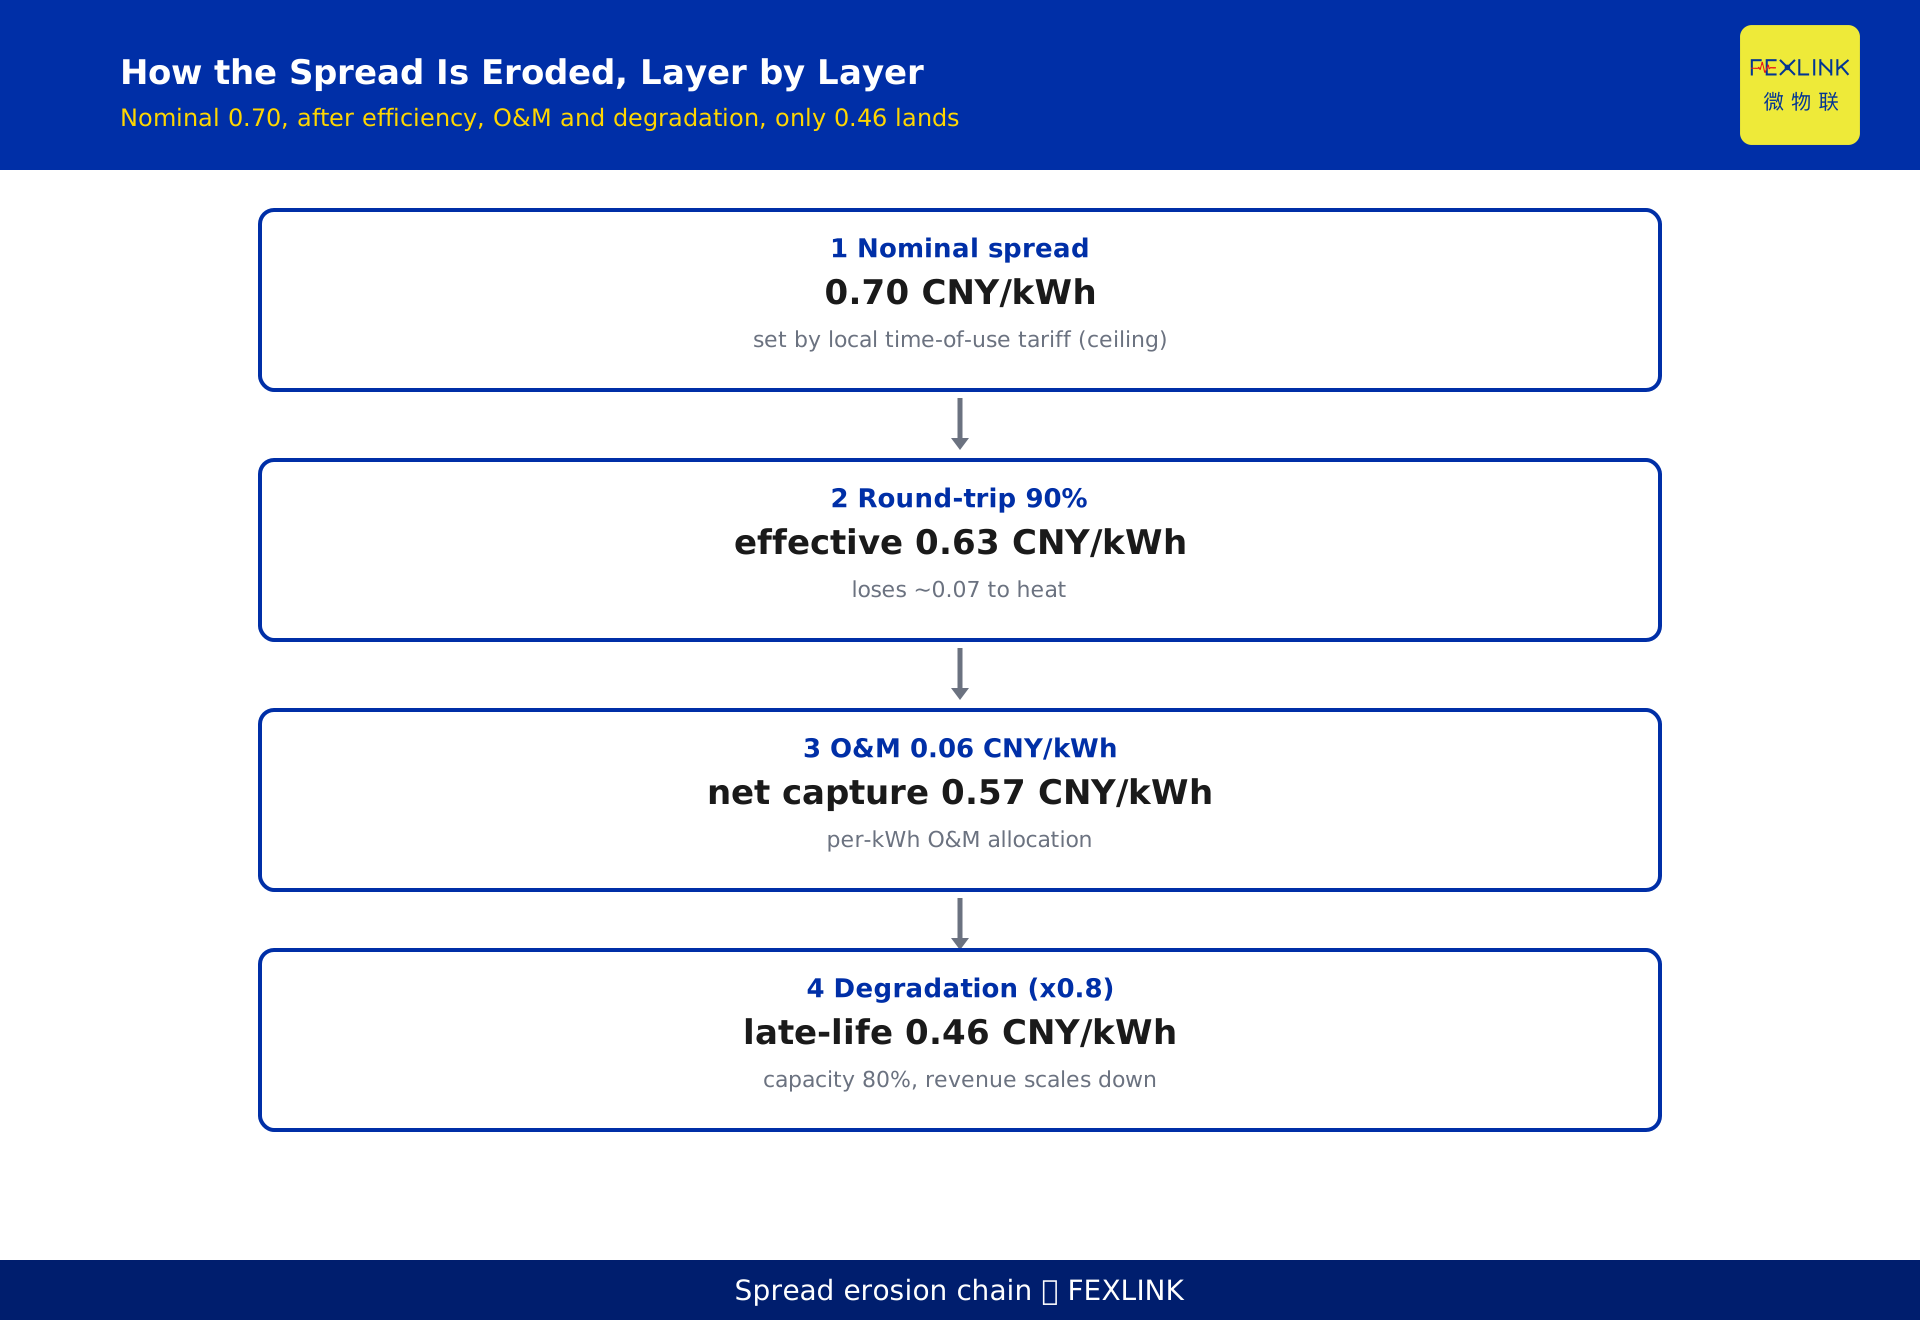
A 90% round-trip efficiency means: charge 1000 kWh in the valley, only 900 kWh come out at peak; the missing 100 kWh became heat in the PCS inverter and battery resistance. Industry PCS single-stage efficiency is 96%–98% and lithium round-trip 90%–95% (public information); multiplied, system-level efficiency lands in 85%–95%.
On the spread: a nominal 0.70 CNY/kWh, after 90% efficiency, leaves an effective 0.63 CNY/kWh — about 0.07 eaten by conversion, roughly one tenth of the spread.
5. Battery degradation and cycle life
Batteries do not stay at full capacity. As cycle life ends, usable capacity declines year by year — life is measured in cycle count (lithium iron phosphate reaches several thousand cycles, per public information / vendor disclosure). GB/T 36276, "Lithium-ion batteries for power storage," is the national standard specifying their performance and testing (cited by number; specific limits follow the current edition).
The revenue impact is twofold. Capacity fade cuts daily energy: at 80% end-of-life capacity, two cycles still move only 80% of original energy, so annual revenue scales down 20%. Second, cycle life sets run years before retirement: 6000 cycles at two a day is about 8 years, one a day about 16 — the shorter life carries more payback pressure.
So cycle life is not a "spec" but a revenue discount line: it decides recovery years and whether late years get clipped by degradation.
6. A reusable back-of-envelope table
Compressing the previous sections into one table leaves four core variables: peak–valley spread, system capacity, daily cycle count, and operating days. The following is a constructed illustration of scale:
| Variable | Constructed value | Note |
|---|---|---|
| Peak–valley spread | 0.70 CNY/kWh | Set by local tariff; the ceiling |
| System capacity | 1000 kWh | Sets energy per cycle |
| Round-trip efficiency | 90% | Costs ~10% of spread per cycle |
| Daily cycles | 2 / 1 | Two cycles double revenue |
| Operating days | 300 / year | After maintenance and downtime |
| Net annual (two cycles) | 327,000 CNY | 357k gross − 30k O&M |
| Net annual (one cycle) | 148,500 CNY | Revenue halved |
| System investment | 1.5 million CNY | At 1.50 CNY/Wh |
| Payback | 4.6 yr / 10.1 yr | Two cycles / one cycle |
Read the table in order: confirm the spread is thick enough, then two full cycles a day are achievable, then divide net annual revenue by investment to read payback. If any link collapses, the verdict flips from "invest" to "be cautious."
7. Decision advice: four tests before you invest
This article is the accounting view of return; KD-0553 (whether to add and whether EMS is worth it) is a separate line that discusses the energy-management brain on top. The increment here is the full arbitrage account plus the "two cycles a day" test.
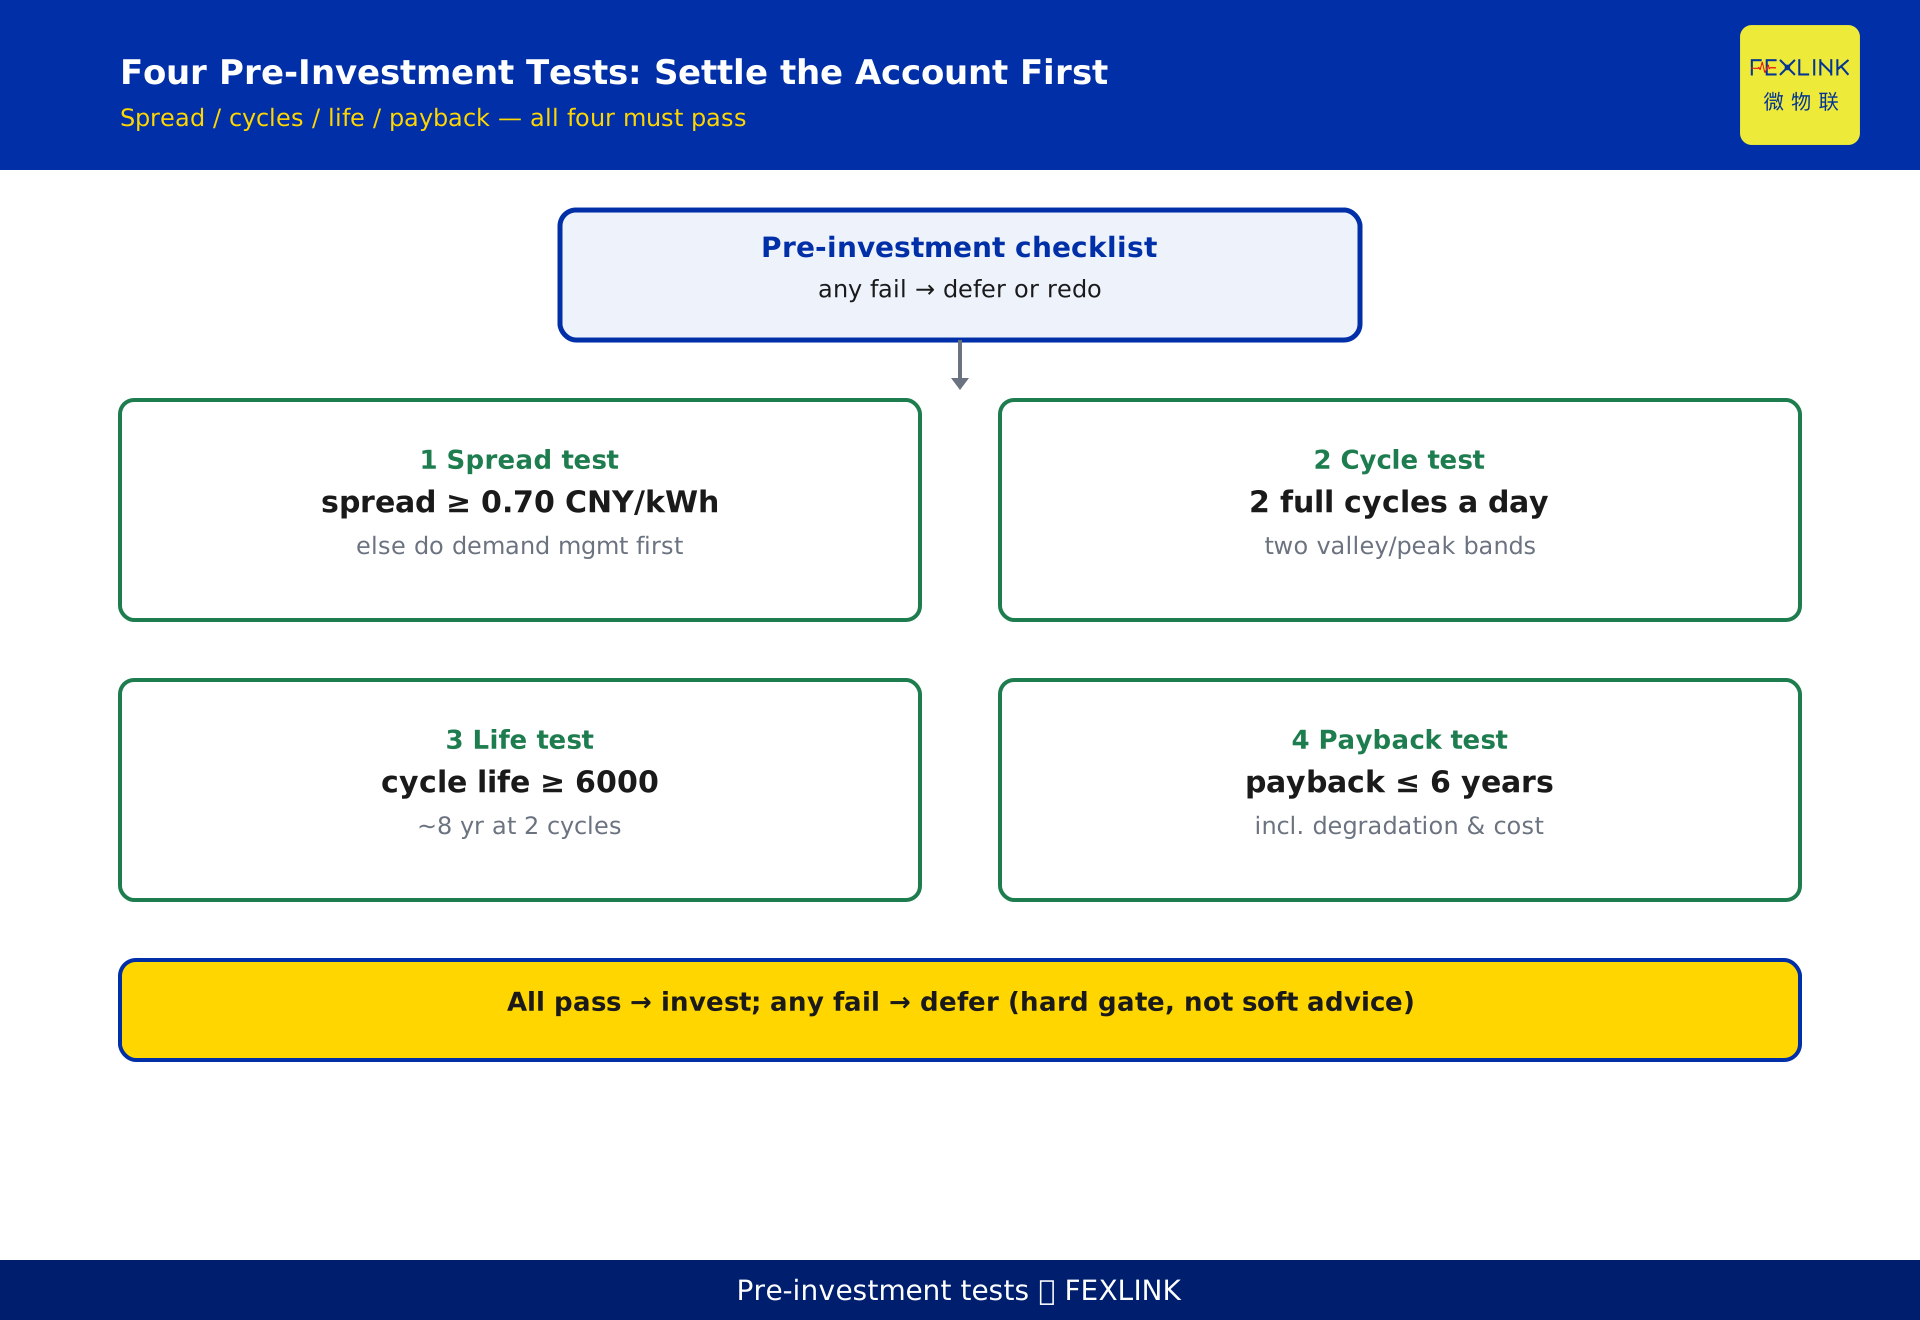
Give the owner a clear checklist — pass all four before investing, no "it depends":
- Spread test: local peak–valley spread ≥ 0.70 CNY/kWh (constructed threshold; recompute from local tariffs). Below the line, the margin cannot cover fixed investment; prioritize demand management over storage.
- Cycle test: able to complete 2 full cycles a day (≥2 chargeable valley bands, ≥2 dischargeable peak bands, PCS matched). If not, revenue is halved and must be recomputed.
- Life test: battery cycle life ≥ 6000 cycles (per current GB/T 36276). If short, late-life revenue is eaten by degradation and payback lengthens.
- Payback test: including degradation and capital cost, payback ≤ 6 years. Beyond that, defer or shrink capacity.
All four pass → invest; any one fails → do not invest or redo the plan. This is a hard gate, not soft advice.
8. How it lands on site: the role of the ESX edge gateway
With the account clear, landing it depends on control. Peak–valley arbitrage demands charging and discharging in the right 15-minute windows — a real-time on-site decision, not a monthly back-office report.
The ESX Intelligent Edge Computing Gateway takes on two jobs: it reads local tariff bands and battery state-of-health (SOH) in real time, and drives the PCS to charge in valley bands and discharge in peak bands by strategy, dynamically lowering per-cycle energy as the battery degrades so the system completes two cycles a day without harming cells. It turns the section 7 checklist from paper into the daily charge–discharge rhythm; without it, the account leaks through missed spread windows.
9. A desensitized engineering example
At a park distribution room with two feeds and fluctuating monthly bills, the energy team built a table from local tariffs: peak 1.05, valley 0.35, spread 0.70, about 300 days, planning 1000 kWh / 500 kW storage.
The first pass computed only "capacity × spread × days," yielding 350k gross and a 4-year payback; the owner approved. The team finished the account: 90% efficiency cut gross to 357,000; minus 30k O&M, net 327,000; critically, the schedule had only one usable valley and one peak band per day, so it is really one cycle — net 148,500, payback 10 years.
The conclusion reversed: assuming two cycles badly overstated the case. Under the real basis, do not invest yet; instead discuss "load shifting + demand management" to pull the peak down. No real customer or place is used; the numbers are constructed to show the need to "settle the account before deciding."
Frequently Asked Questions (FAQ)
Q: How many times a day can storage charge and discharge?
It depends on tariff bands and PCS power. If a location has two valley bands and two peak bands with matched power, two cycles are possible; most areas allow only one. Two cycles yield roughly twice the revenue of one and are the hard test of whether the investment can run.
Q: What does 90% round-trip efficiency actually mean?
Charge 1000 kWh in the valley and only 900 kWh are truly usable at peak; about 100 kWh is lost in inversion and battery resistance. It compresses the nominal 0.70 CNY/kWh spread to an effective 0.63 CNY/kWh, eating about a tenth.
Q: The battery degrades after a few years — how is revenue counted?
Bounded by cycle life, end-of-life usable capacity may fall to 80%, scaling daily moved energy to 80% and clipping late-life revenue. In the estimate, convert "cycle life × daily cycles" into usable years, then read payback.
Q: How wide a peak–valley spread makes storage worth it?
This article sets the constructed threshold at 0.70 CNY/kWh; the real threshold must be recomputed from local tariffs and system cost. The spread is a ceiling — when thin, no equipment efficiency can fill the fixed investment.
Q: After the account is clear, should we also add an EMS?
That is a different question, covered in KD-0553. This article only makes the arbitrage account clear; whether EMS is worth it depends on whether its extra benefits (dynamic strategy, multi-objective optimization) cover its own cost, which is outside this article's conclusion.
Scope and limitations
- The peak–valley arbitrage revenue model applies to general commercial/industrial and large industrial users on time-of-use tariffs; users on a single flat rate have no arbitrage space and the method does not apply.
- All energy, tariff, capacity, investment, O&M and payback figures are constructed examples to illustrate the method and do not represent any real customer, project or region; actual estimates must use locally published time-of-use tariffs, site survey and equipment selection.
- The 0.70 CNY/kWh spread, 1.50 CNY/Wh capacity price and 6000-cycle life are constructed thresholds for scale only and are not investment or selection advice; specific values follow current standards and field measurement.
- The cited GB/T 36276 "Lithium-ion batteries for power storage" is a standard-number reference; specific performance limits and test methods follow the current valid edition, and quantitative conclusions must be re-checked after any revision.
- PCS efficiency 96%–98% and lithium round-trip efficiency 90%–95% are ranges from public information and industry consensus; actual values vary by vendor and operating condition and follow product manuals and measurement.
- The described functions of the ESX Intelligent Edge Computing Gateway follow the latest selection manual and product knowledge base; this article is not procurement advice.
- This article is the accounting view of "how to calculate the return" and is an independent neighbor of KD-0553 (whether to add EMS); whether to deploy an EMS is outside this article's conclusion.
Frequently Asked Questions
Does C&I Storage Actually Make Money
Whether commercial and industrial (C&I) storage actually makes money comes down to one sentence: daily revenue ≈ peak–valley spread × energy cycled per