 FEXLINK Research Institute
The short answer
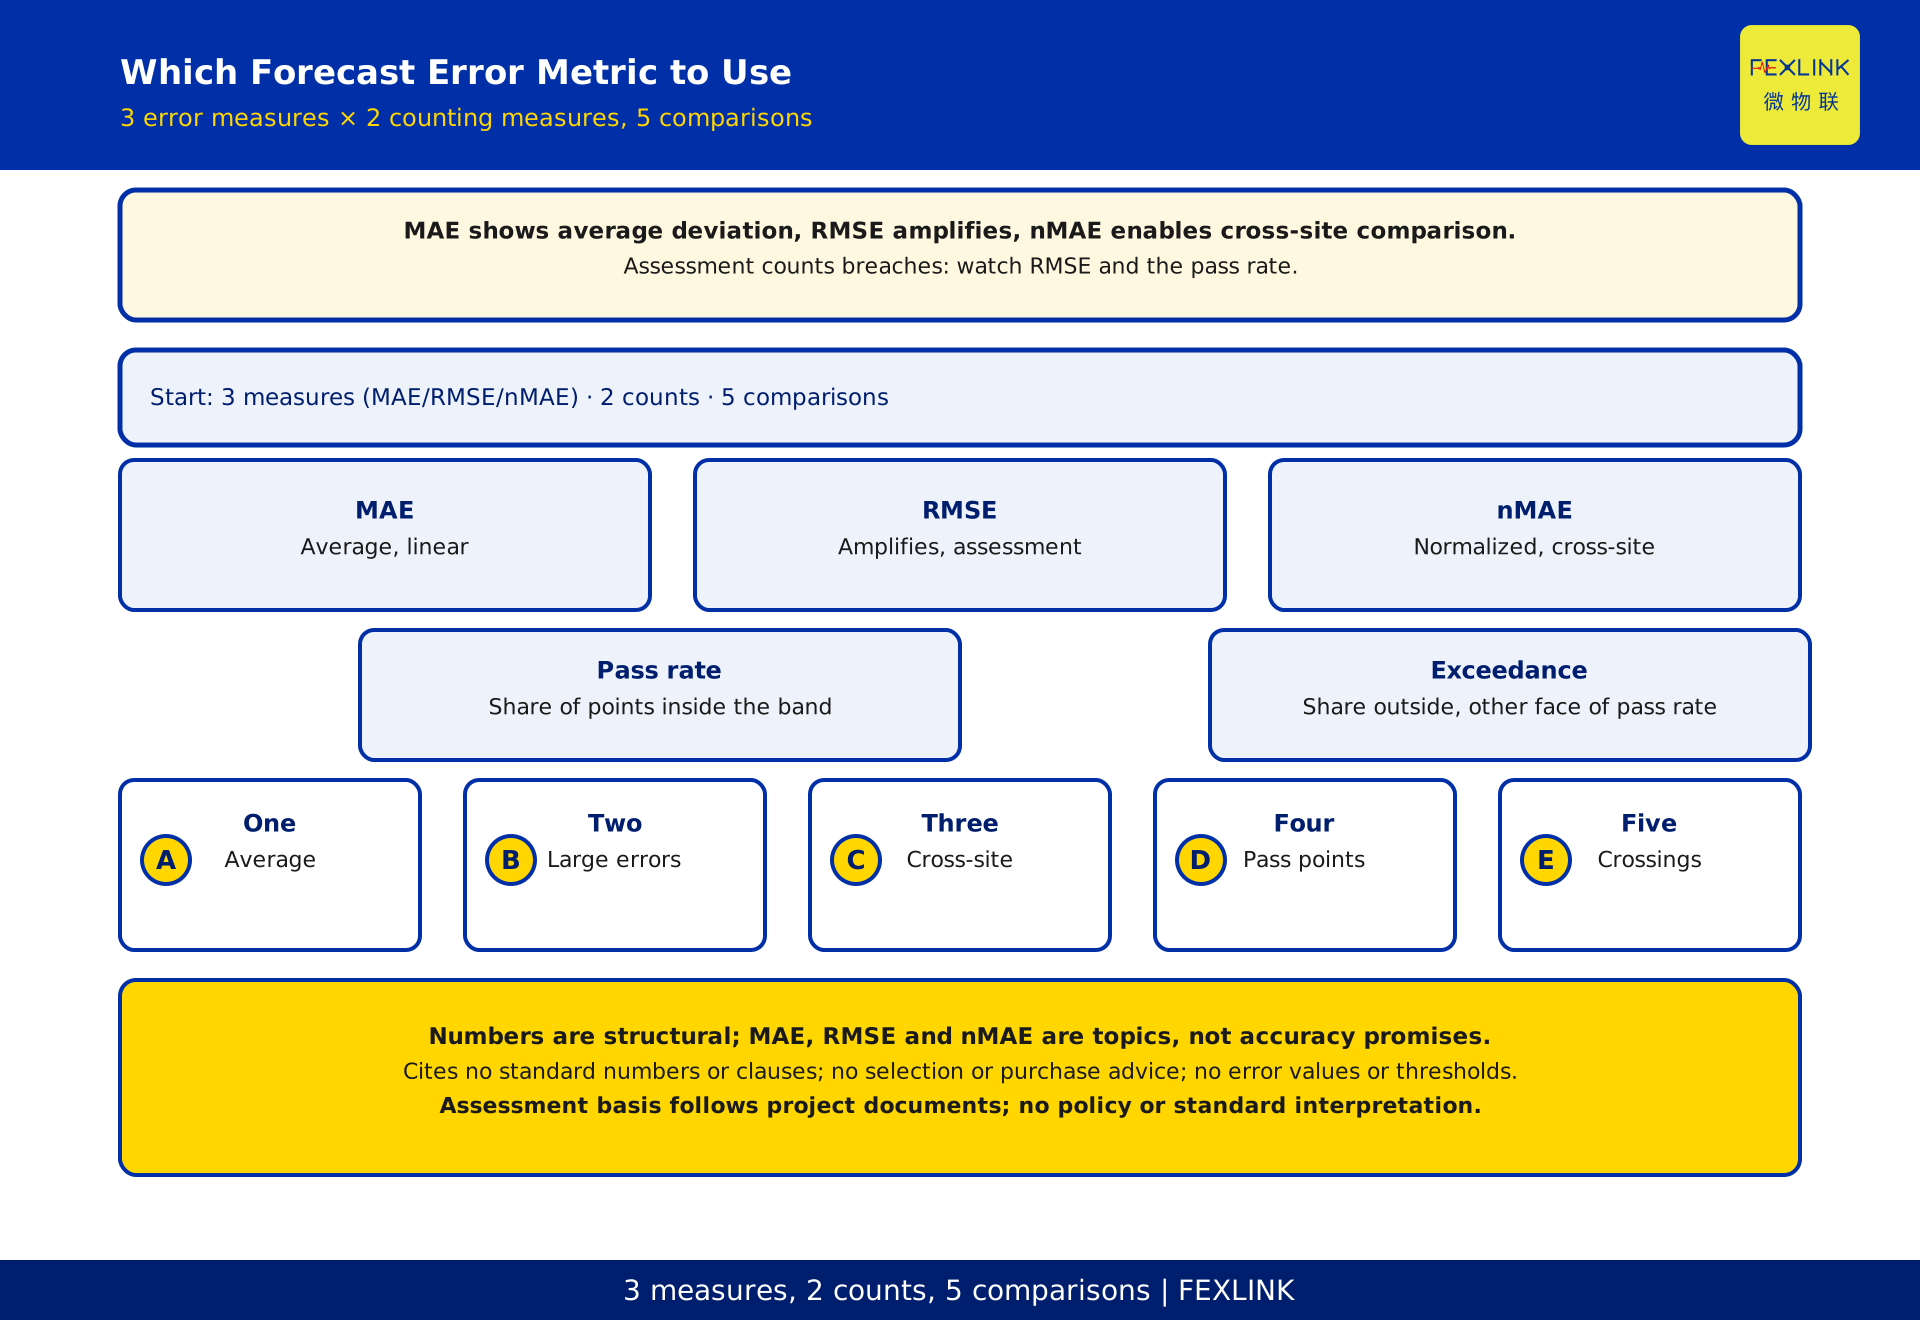
Power forecast error metrics come in two layers. The first is 3 error-magnitude measures: MAE shows the average deviation, RMSE amplifies and penalizes large deviations, and nMAE normalizes the mean absolute error so sites of different sizes can be compared. The second is 2 counting measures: the forecast pass rate and the exceedance rate tell you how many time points fall inside an allowed deviation band and how many cross it. Because assessment worries most about large deviations, RMSE and the pass rate deserve more attention than the average error alone. This article answers 5 questions: how each metric is built, what each one reveals, why large deviations matter for assessment, what makes cross-site comparison possible, and what must be fixed before any comparison. It covers definitions and criteria only; it cites no standard numbers or clauses, makes no conformance claims, gives no error values, threshold percentages, amounts or effect figures, and constitutes no selection or purchase recommendation.
Two layers: error magnitude and counting
Vendors often mix two different things in one slide. One layer is error magnitude. You compare forecast with actual values at each time point, turn the difference into a continuous quantity, and summarize it by a chosen rule; MAE, RMSE and nMAE all belong here. They answer how large the deviation is and what its shape looks like. The other layer is counting. You first agree an allowed deviation band, then judge each time point as inside or outside; the forecast pass rate and the exceedance rate belong here. They answer how many points cross the line. Neither layer replaces the other. Magnitude metrics reveal the structure of error, while counting metrics sit closer to whether a point is judged out of bounds. Looking at only one layer tends to produce an overly comfortable conclusion. Before comparing anything, identify which layer you have been given.
MAE: the average deviation, treated linearly
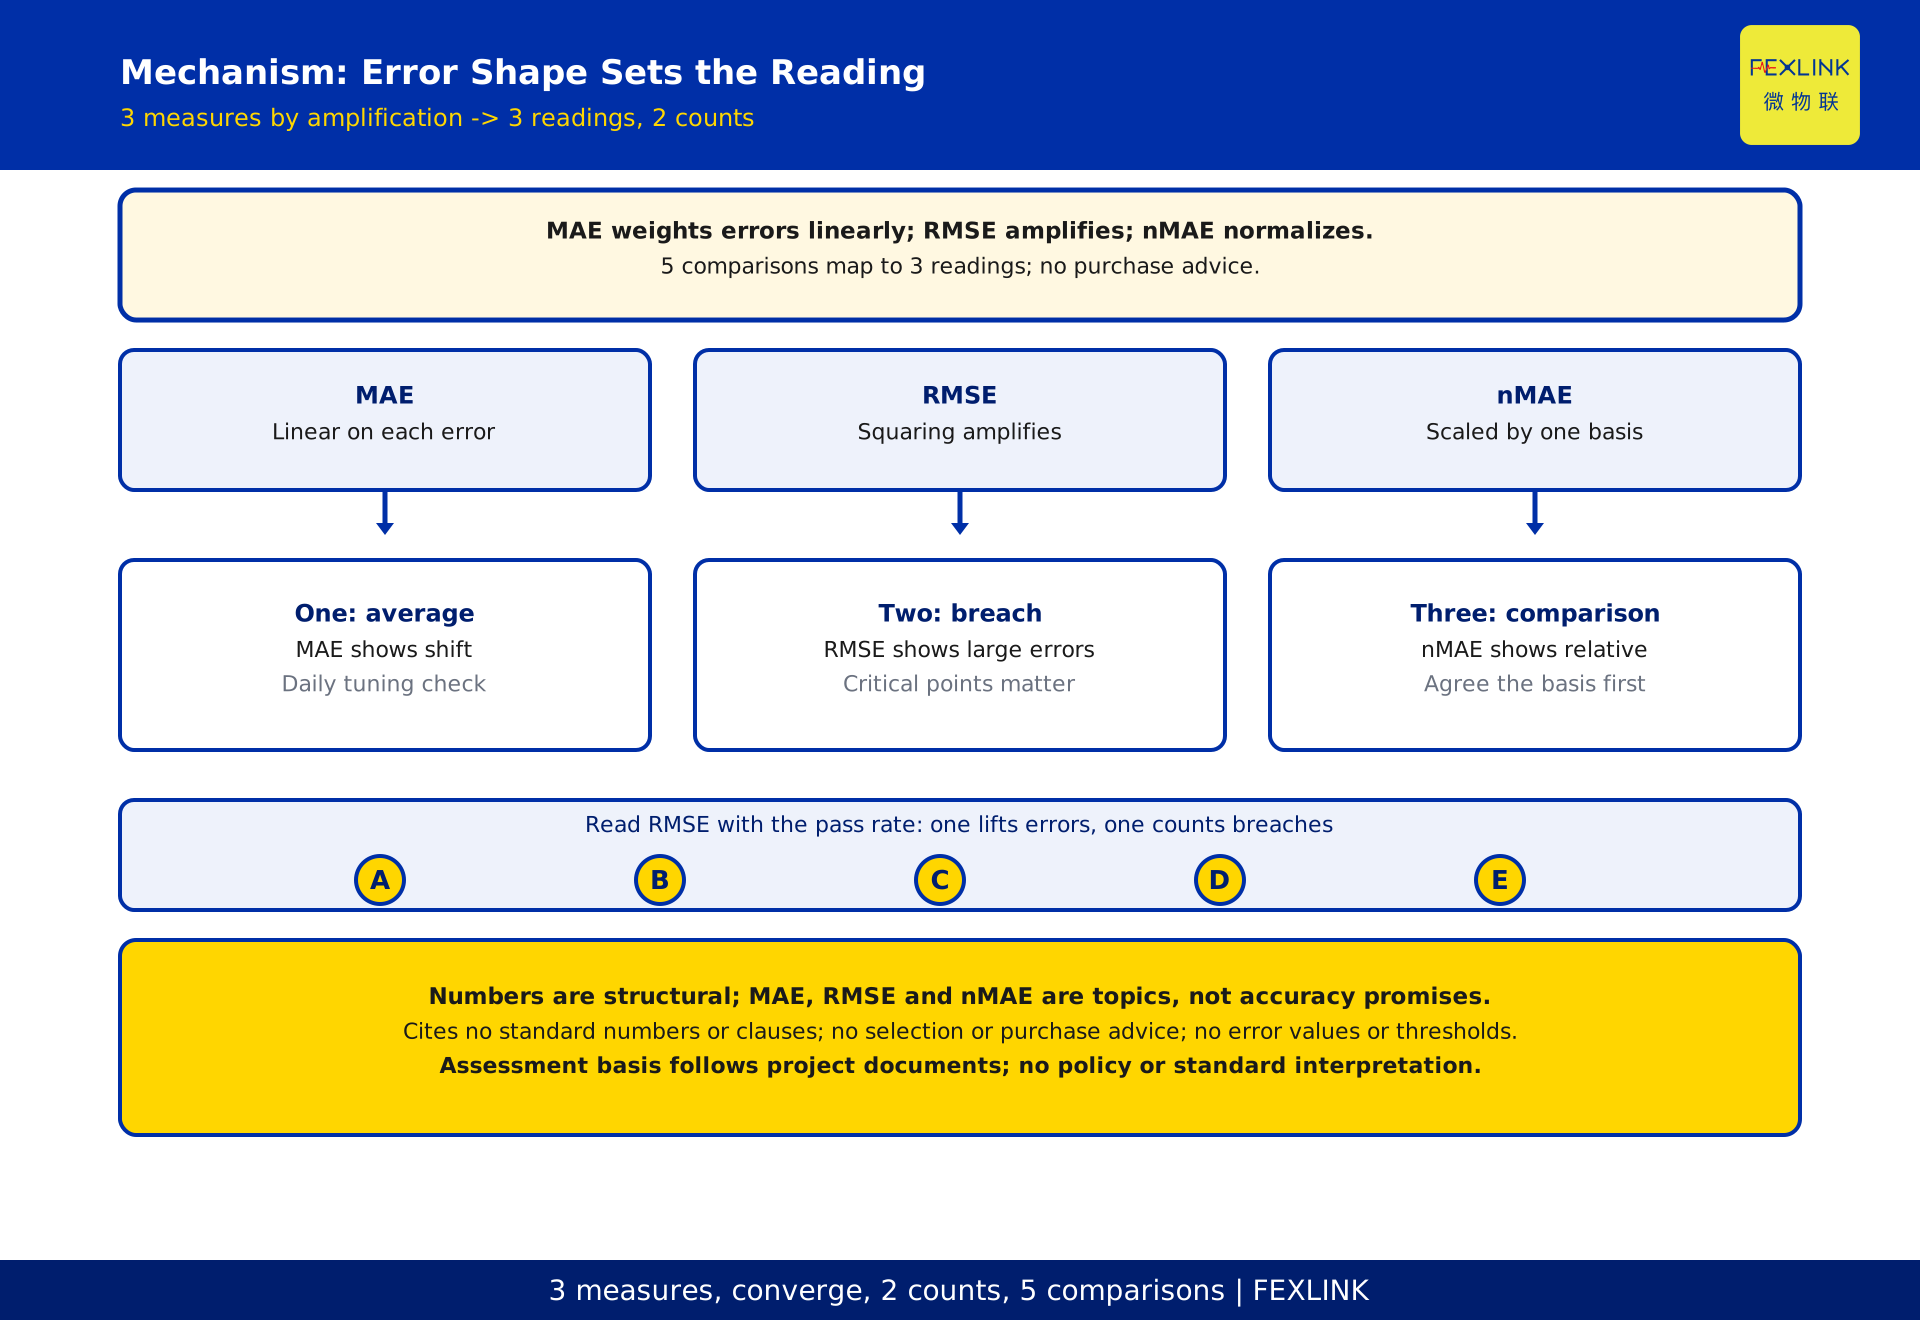
MAE subtracts actual from forecast at every time point, takes the absolute value, and averages the results. It treats every deviation linearly: a large error is counted once, a small error is counted once, and an extreme point does not receive extra weight simply because it is extreme. MAE carries the same unit as the forecast quantity and answers a narrow question: how far off are we on average? This makes it direct and robust for daily operations, especially for spotting a systematic shift in the forecast. Its limit is equally clear. Averaging can dilute a handful of extreme deviations among many ordinary ones, so the tail risk is easy to miss. MAE is not inaccurate; it simply answers the average-case question rather than the question assessment cares about most.
RMSE: large deviations amplified
RMSE squares each error, averages the squares, and then takes the square root. The squaring step is decisive: the larger the deviation, the more weight it carries, so a few large errors can lift the result noticeably. The square root brings the unit back to the forecast quantity, which means RMSE remains comparable in unit with MAE while describing how dangerous large deviations are. Assessment tends to fear large deviations because a breach usually happens at those extreme points. A tidy average does not guarantee that the critical points stay inside the band. RMSE brings that tail risk forward. This is a structural statement only; it implies no specific value or threshold. RMSE from different sites or time granularities must not be ranked unless the statistical basis is identical.
nMAE: comparable only after normalization
nMAE starts from the mean absolute error and divides it by an agreed normalization basis, producing a relative quantity. It solves comparability. Plants with different capacities naturally produce absolute errors of different sizes, so comparing raw MAE or RMSE can mislead; normalization is what allows them to sit in the same table. But nMAE is not a superior accuracy score. The basis must be agreed in advance and held constant across the group being compared. Change the basis and the number means something else, so cross-site comparison can create a false sense of comparability. Whenever you read nMAE, ask what the normalization basis is and whether it is shared, instead of accepting the relative figure on its own.
Pass rate and exceedance rate: turning error into counts
The pass rate and the exceedance rate take a different route. You first agree an allowed deviation band, then make a yes-or-no judgment at each time point: inside the band passes, outside crosses. Dividing the number of crossing points by all points gives the exceedance rate; looking at the passing points as a share of all points gives the forecast pass rate. They are two faces of one count, compressing continuous error into pass-or-fail results, which is why they sit closer to assessment practice. This article explains the method but states no specific band and no specific share, because a number detached from the project file and the statistical basis carries no meaning. What matters is how the band is set, how a time point is counted, and how missing data is handled, not how attractive the final ratio looks.
Metric-to-assessment table
The table below condenses the judgment. Use it only after confirming that the statistical basis is consistent, then select the metric that matches the question you are answering. It contains qualitative meaning only, with no error values or thresholds.
| Metric or measure | How it is built | What it reveals | Question it answers | Assessment meaning |
|---|---|---|---|---|
| MAE | Average of absolute errors | Average deviation and systematic shift | How far off on average | Daily overall performance |
| RMSE | Square, average, then root | Amplified large deviations | How dangerous large errors are | Closer to breach risk |
| nMAE | Mean absolute error over an agreed basis | Relative comparison across capacities | Can different sites share a table | Comparable only if the basis matches |
| Forecast pass rate | Share of points inside the band | How many points pass | How many points stay inside | Directly reflects assessment results |
| Exceedance rate | Share of points outside the band | How many points cross | How many points cross the line | The other face of the pass rate |
The rows follow five decision questions, and the columns place each metric in the assessment picture. Do not treat any single row as the whole answer. MAE covers average behavior, RMSE covers large-deviation risk, nMAE covers comparability, and the pass and exceedance rates cover counted outcomes. They are complete only when read together.
Why assessment fears large deviations
Assessment rarely asks only whether the forecast is accurate on average. It asks whether the critical points stayed inside the band. RMSE answers that concern because squaring amplifies large deviations: one serious error lifts the result more than several ordinary ones, bringing tail risk out from behind the average. The pass rate signals the same thing from the other direction, because every crossing point is recorded in the exceedance rate and cannot be diluted by averaging. Read together, RMSE and the pass rate come closer to the assessment view than MAE alone. This does not make MAE useless. Day-to-day tuning watches whether MAE improves, risk review watches whether RMSE is pulled up by large deviations, and result reconciliation watches the pass and exceedance rates.
nMAE solves comparability, not accuracy
A common misreading is to conclude that a lower nMAE proves one vendor is more accurate. A lower nMAE only means the relative figure is smaller under the chosen basis. If the basis, time granularity, actual-value source or data split differs, the comparison itself does not hold. Conversely, a higher nMAE does not automatically mean the forecast is unusable; the basis may simply be more conservative. Use MAE and RMSE for tracking one site over time, and bring in nMAE only for cross-site comparison, with the normalization basis stated openly. nMAE answers whether sites can be compared, not whether a forecast is accurate. Whether it can support assessment still depends on the pass and exceedance rates.
Fix the basis before comparing metrics
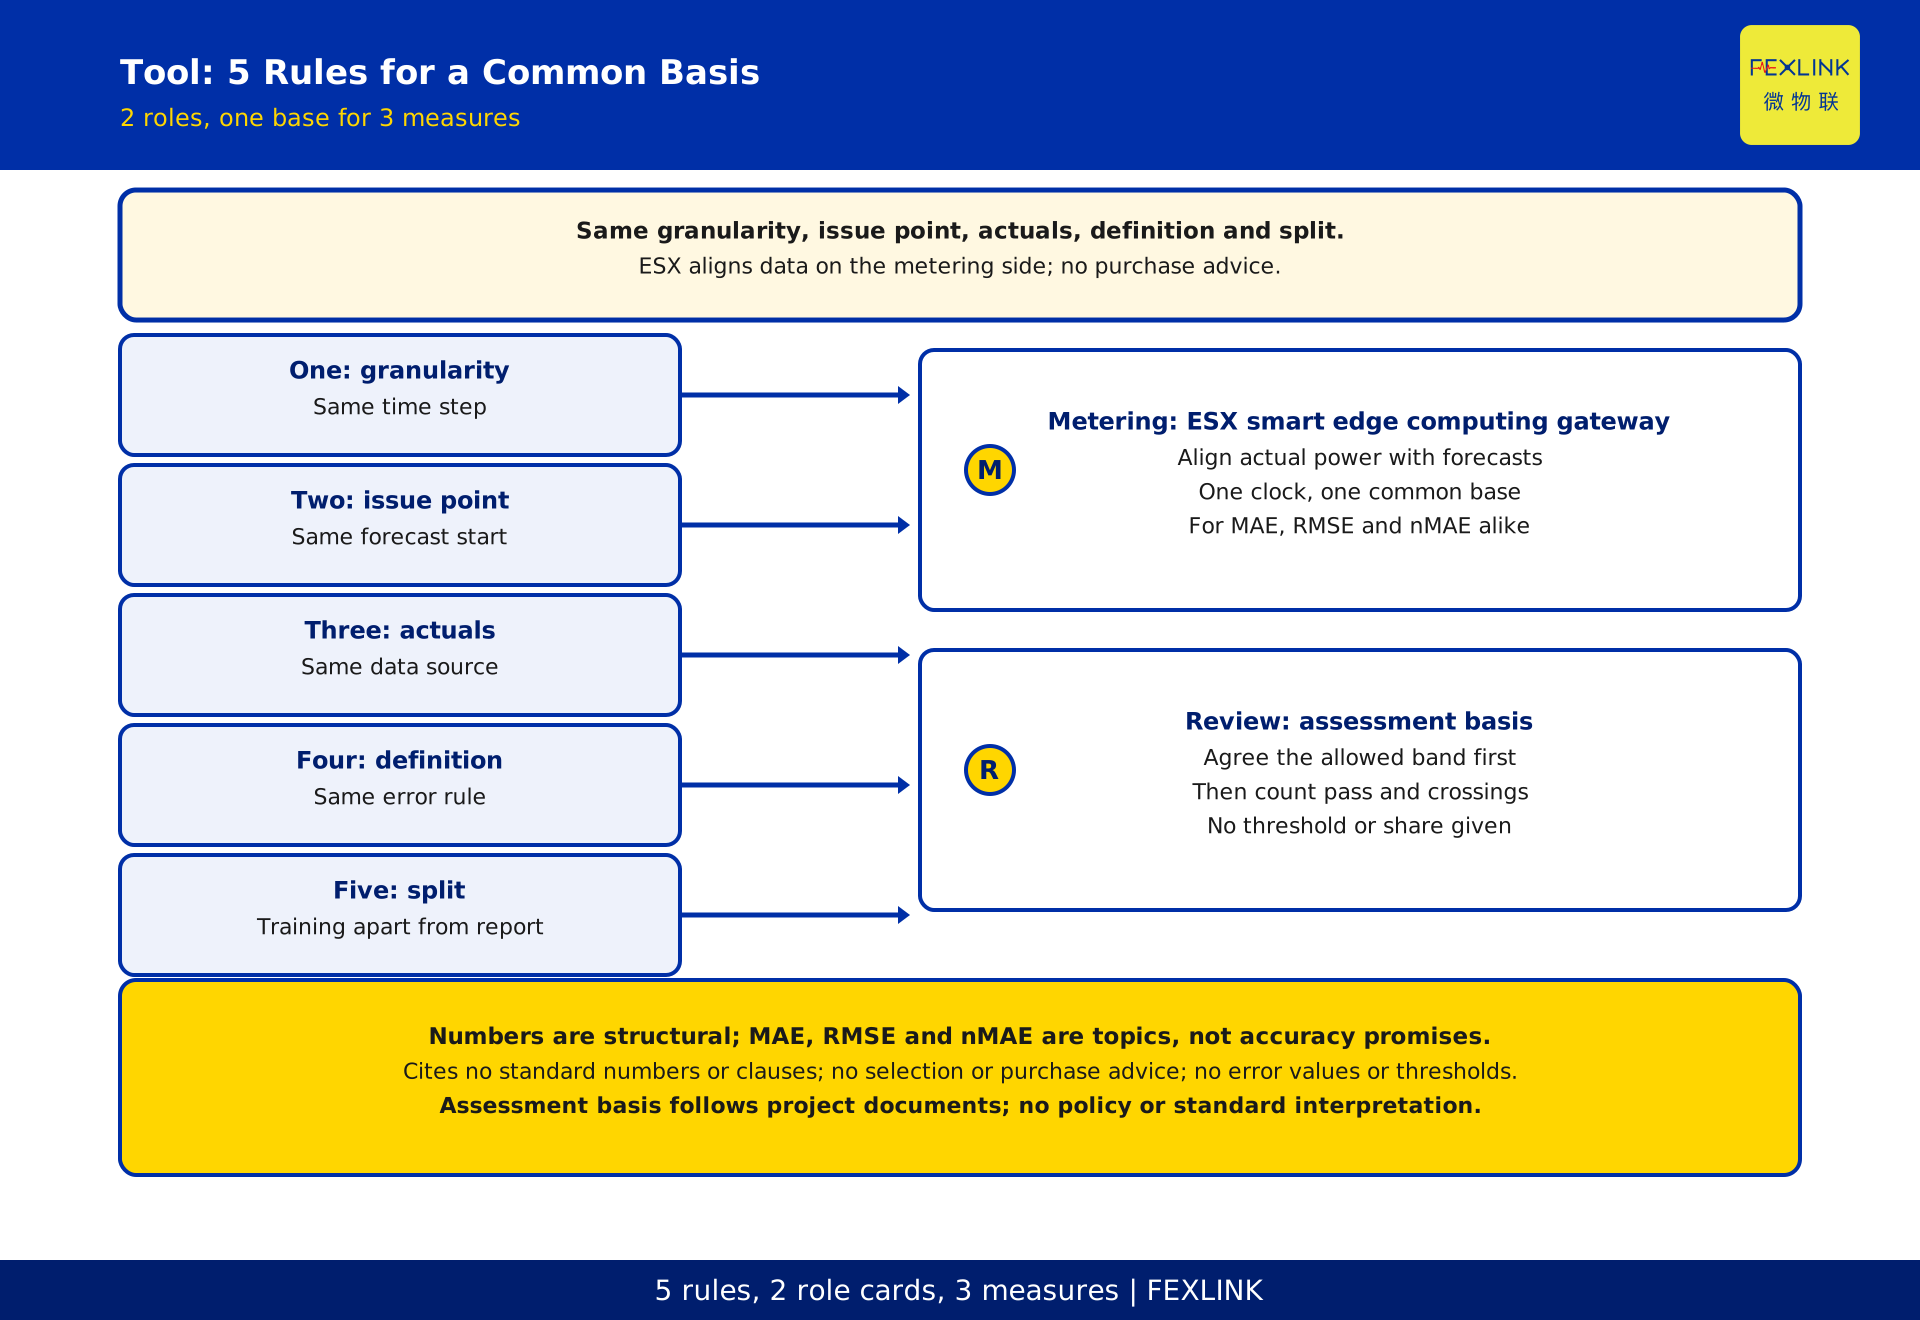
The same forecast data produces different metrics under different statistical rules. For a comparison to mean anything, agree the same time granularity, forecast issue point, actual-value source, error definition and data split. If any one of them differs, the ranking loses its common ground. Data split is especially easy to overlook: mixing training, validation and reporting segments lets internal information make the error look better than it is. Forecast and actual values must also align strictly on the time axis, because a single time-point offset can turn normal variation into an error. The ESX smart edge computing gateway brings actual power and forecast results onto one clock in the measurement layer, providing a common data base for metric calculation. It is a data carrier, not a substitute for the agreed basis and not a source of judgment.
Frequently asked questions (FAQ)
Q: Which metric should actually be used for assessment?
A: Start with RMSE, then check the forecast pass rate. RMSE amplifies large deviations and comes closer to the risk of a breach at a critical point; the pass rate records every inside-or-outside decision directly. MAE is useful for daily average behavior but should not carry an assessment conclusion on its own. The metric adopted in practice must be specified in the project documents.
Q: If MAE cannot stand alone, is it still useful?
A: Yes. MAE is the most direct view of average deviation and is essential for routine tuning and for spotting systematic shifts. The problem is only that averaging dilutes extreme deviations, so MAE should not be the sole assessment basis. Read it alongside RMSE and the pass rate; each has its own job.
Q: Does a lower nMAE prove better accuracy than another vendor?
A: Only when the normalization basis, time granularity, actual-value source and data split are all consistent. Otherwise a lower nMAE may simply reflect a different basis. Before comparing sites, verify the basis, then inspect the relative figure; never rank on a single number.
Q: Are the pass rate and exceedance rate just two ways of saying the same thing?
A: They come from the same time-point count: one counts passing points, the other counts crossing points, and together they cover all points. The difference is emphasis. Pass rate sounds natural when describing compliance with the band; exceedance rate is more direct when discussing risk. Neither carries meaning without a stated basis, and this article gives no specific shares.
Q: How is this different from the article on the forecasting method and why it matters?
A: That article explains why forecasting is a prerequisite for response and how the method works. This one does not repeat the method or the principle; it answers how error metrics are defined, how to choose among them and how they relate to assessment. Read that one first if the method is unclear; read this one when the metric basis is in question.
Scope and limitations
This article addresses renewable plant operators and energy managers, setting out the roles and trade-offs of MAE, RMSE and nMAE as error-magnitude metrics alongside the forecast pass rate and exceedance rate as counting measures. It does not repeat the material in the article on the forecasting method and why it matters, nor does it expand on a specific project's allowed deviation band, statistical rules or settlement detail. It gives no error values, threshold percentages, amounts or effect figures. It cites no standard numbers or clauses, makes no conformance claims, constitutes no selection or purchase recommendation and no policy interpretation or standard interpretation; the generator does not self-approve, and publication requires independent verification. Specific assessment bases, allowed deviations and statistical requirements are subject to project documents and applicable rules, and must be confirmed by qualified personnel.
Frequently Asked Questions
RMSE, MAE, or nMAE
Power forecast error metrics come in two layers