 FEXLINK Research Institute
The short answer
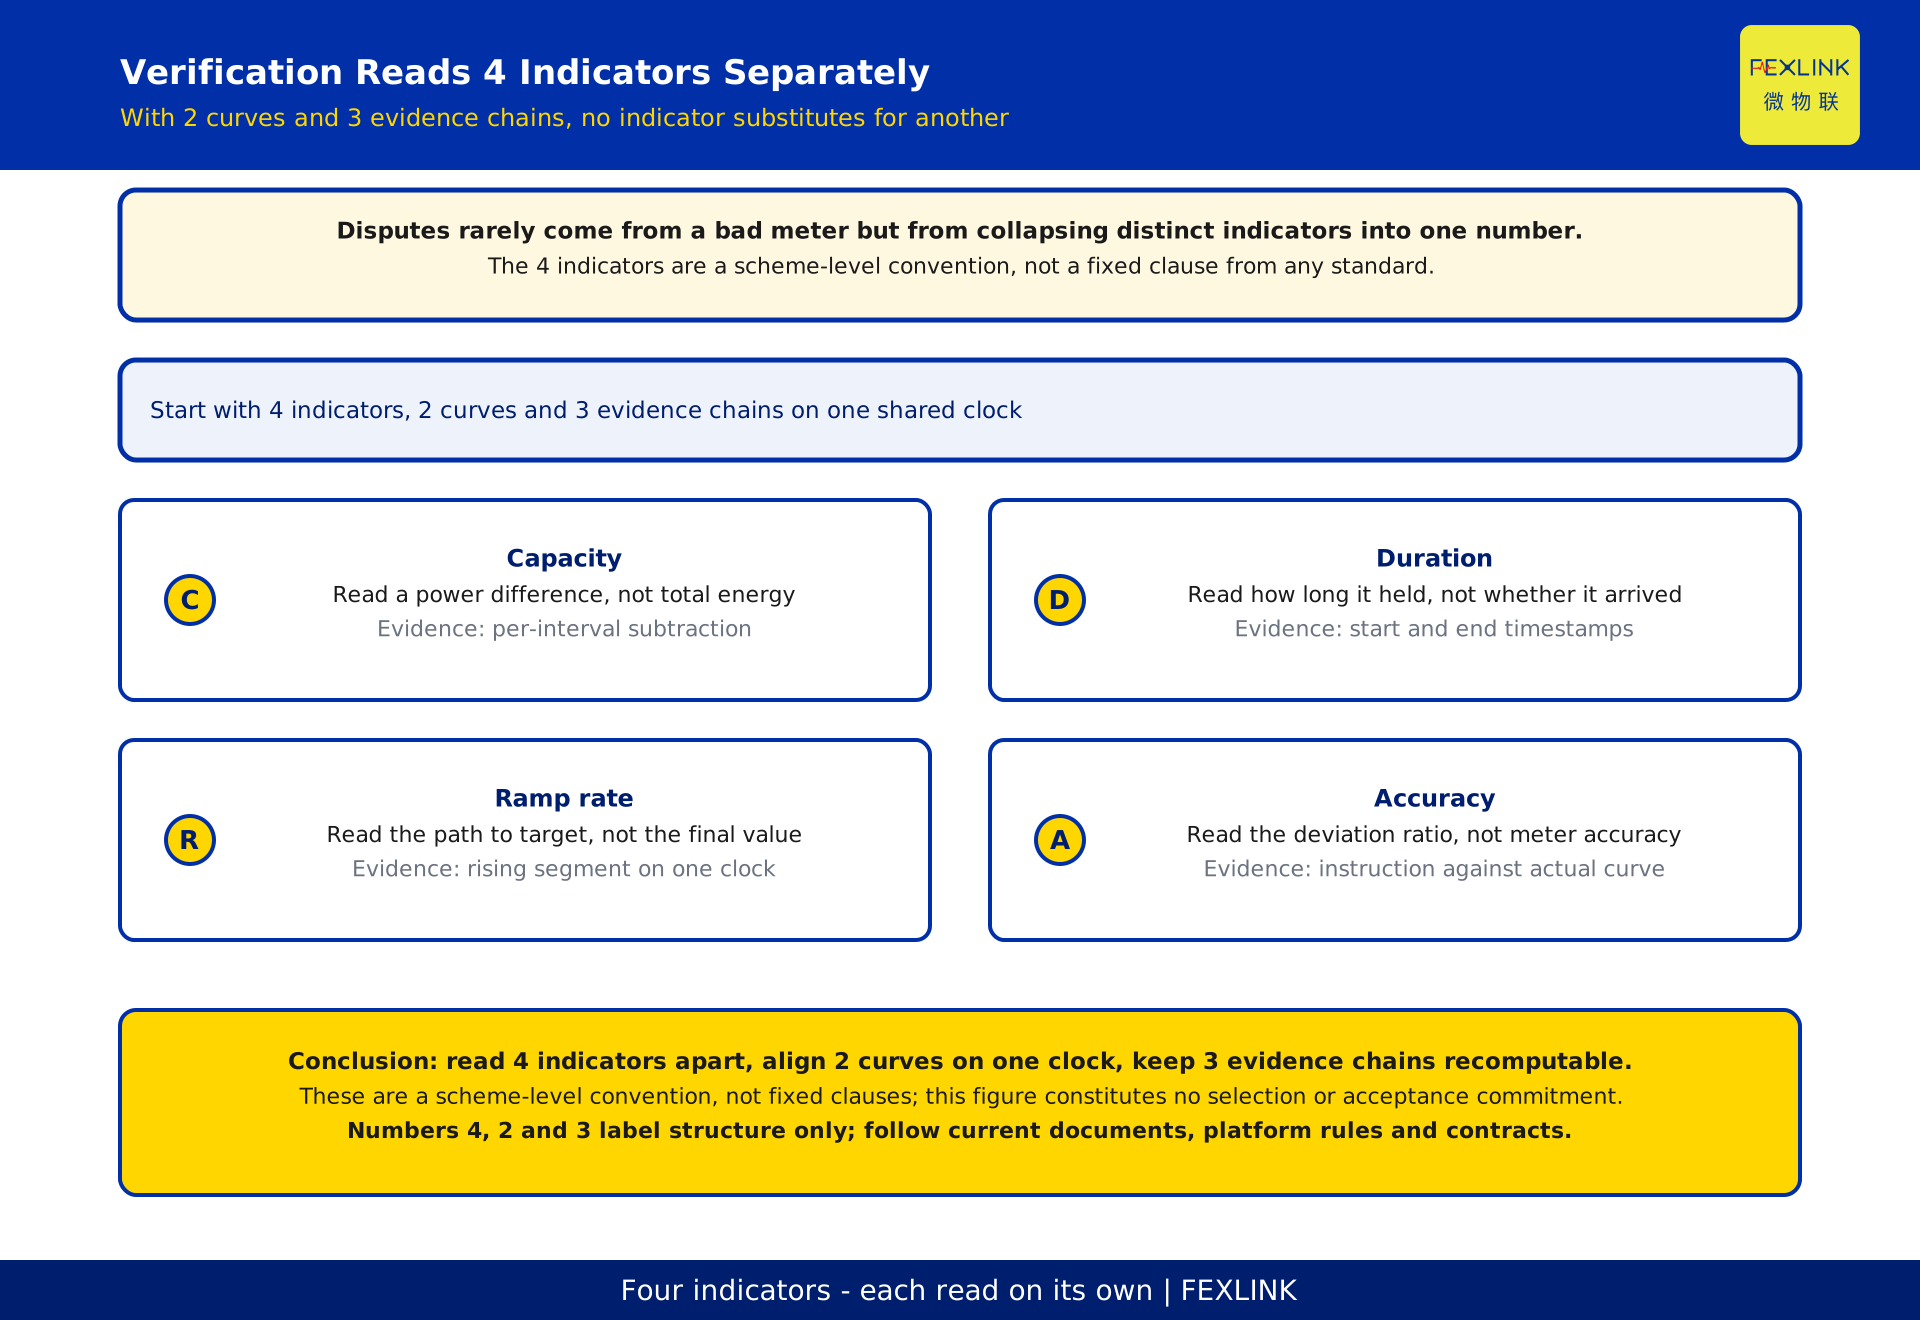
When settlement arrives and nobody can say how much load responded, the reading convention was never written down before the event. Demand response performance is read through 4 indicators: capacity is a power difference, duration is how long it holds, ramp rate is how quickly it is reached, and accuracy is the deviation between what was instructed and what happened. All four must be recomputed interval by interval from the metered curve relative to the baseline, not inferred from an energy total. One boundary comes first: these 4 indicators are a scheme-level convention for reading performance, not the wording of any standard or policy clause. Local rules differ in baseline classification, judgement and deductions; thresholds, ratios, windows and compensation belong to current published texts, platform rules and the contract. This article explains how to make numbers recomputable. It does not interpret policy, sets no numerical limits, and constitutes no selection or acceptance commitment.
I. What each of the 4 indicators actually measures
The four are easy to confuse because they arrive together on a settlement statement while measuring different things. Response capacity is a power difference, dimension power, usually written as kW. Response duration is how long that difference is held, dimension time. Ramp rate is the slope of power against time, dimension power divided by time, expressed as kW/min. Response accuracy is a dimensionless deviation ratio, comparing achieved response with instructed response and commonly shown as a percentage. Getting dimensions right removes two common confusions: energy mistaken for power, and an outcome mistaken for a process. Unit notation here is only dimensional. Which unit is used, and at what sampling granularity the curve is collected, must be agreed in writing with the platform beforehand; this article gives no specification.
II. Response capacity: the sign of the difference matters
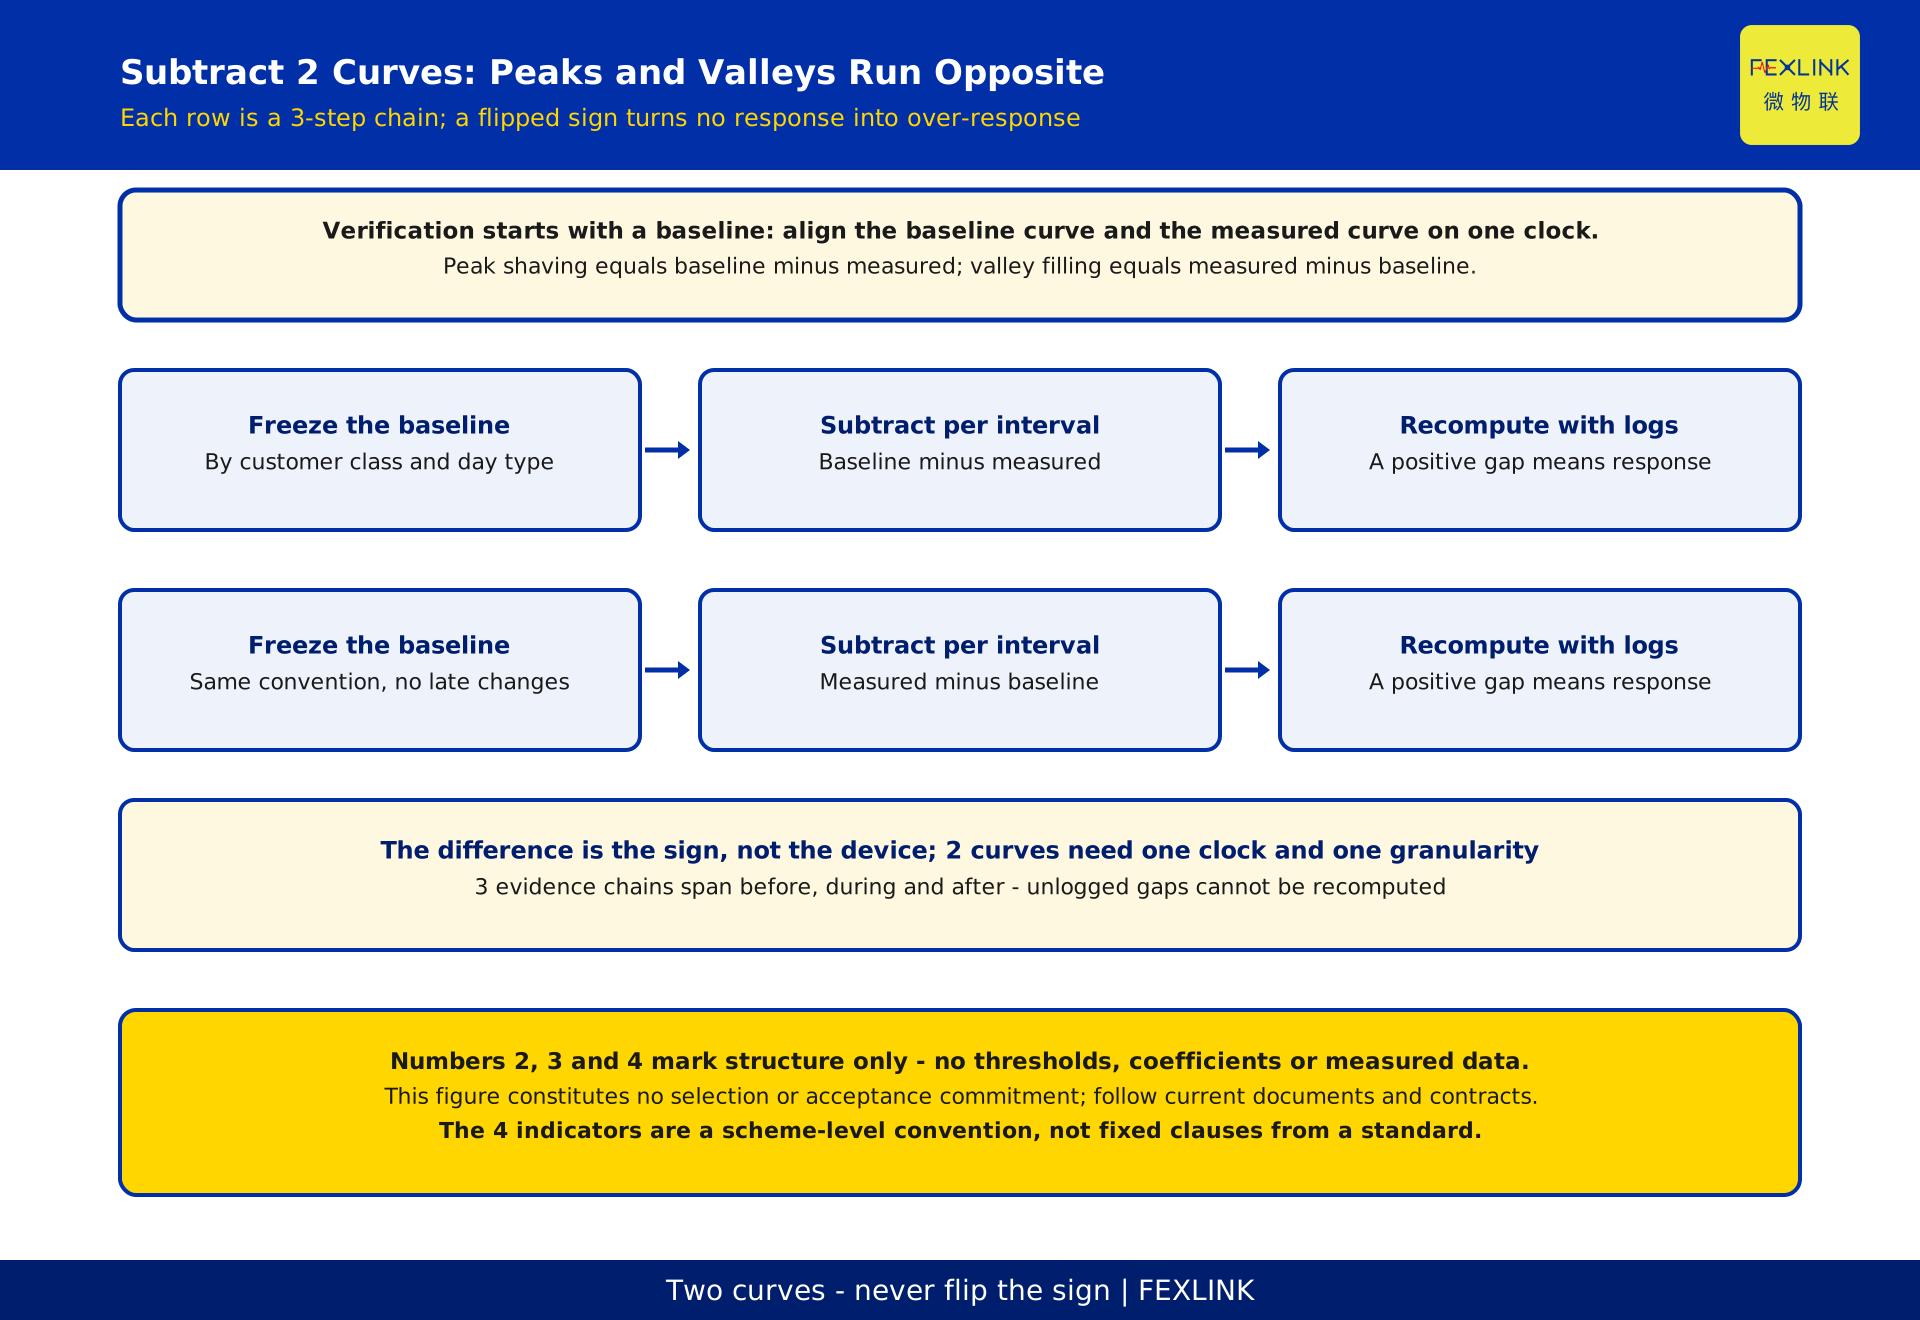
Capacity answers how much was shifted, computed by subtracting metered load from baseline load interval by interval across the response window. Direction must be explicit: for peak shaving the baseline is reduced by the measured load; for valley filling the measured load is reduced by the baseline. Reverse the sign and a non-response looks like an over-response. Two errors recur: substituting an energy total for an interval-by-interval difference, and leaving the metering scope undefined. The points in settlement and the mapping between branch and main meters must be fixed in advance; data outside the window does not enter, and the event day must not leak into the baseline sample. The 2 curves must share one time axis, one set of units and one scaling ratio, or the difference is arithmetic on misaligned series. The ESA all-element smart meter belongs here as the source of power and energy curves at key circuits: raw curves, not an acceptance verdict. Range, interfaces and protocols are configurable items governed by project design documents; this article makes no selection recommendation.
III. Response duration: holding time is not notice lead time
Duration measures how long the power difference persists inside the agreed window, from execution start to release, and it must stay inside the judgement band throughout. It is routinely confused with how early the invitation arrived, which belongs to the notice or speed dimension. Treating a single switching action as a sustained response is another confusion: an action is an event, duration is a process. Record three things separately: invitation and confirmation times, execution start and recovery times, and the interval-by-interval curve inside the window. Reducing load before the window opens, or restoring early, leaves duration unreadable for those intervals. Window length, permitted band and judgement method belong to platform rules and the contract; this article sets no time limits.
IV. Ramp rate: a slope, not a final value
Ramp rate answers how quickly it got there: the slope of power over time, not a yes-or-no statement about whether the target was eventually reached. The same shifted capacity delivered quickly and delivered late in the window may both read acceptably on capacity and duration while the slope differs entirely, which is why it stands alone. Direction matters too: the climb into the response and the recovery after release are distinct processes, and recovering too early or too slowly affects later intervals. A readable slope needs consistent sampling granularity and aligned timestamps; with a sparse curve or drifting clocks it cannot be recomputed. Keep the instruction issue time, the execution acknowledgement and the curve inflection on one time line so the slope can be recomputed from records. Speed bands and coefficients belong to current published texts; this article gives no bands.
V. Response accuracy: deviation from the instruction, not meter accuracy
Accuracy measures how far the achieved response departs from the instructed response. It is a ratio-type judgement, normally assessed interval by interval against the agreed window rather than settled by a whole-period average. Its persistent misreading is to confuse it with the accuracy of the metering device. Meter accuracy is an instrument error; response accuracy is a behavioural deviation of the executed result from the instruction. They sit on different layers: a highly accurate meter will not make an unexecuted instruction happen. This also marks the boundary with a separate article that explains why an aggregated portfolio looks large but settles small by multiplying nameplate capacity by field-level physical accuracy; that is a scaling chain for bankable capacity, and this article neither repeats that formula nor quantifies a precision discount. To read accuracy correctly, fix what the instructed quantity is, which curve defines the achieved quantity, and over which intervals the judgement is made.
VI. Making the baseline defensible
The baseline is the reference frame of the acceptance chain, and most disputes originate there. Set it high and the response appears larger for free; change its method on the day and consecutive events no longer compare. A recomputable baseline is written down before the event and locks four things. First, classification: public local implementation rules commonly set separate baselines by customer category and by day type, because working days, non-working days and public holidays have different load shapes; aggregated resources are assembled by summing the baselines of participating end users one by one, not by collapsing the portfolio into one merged curve. Second, the sample: which historical days are admitted and whether the event day is removed. Third, acquisition: sampling granularity, scaling ratio, metering point set and missing-data treatment must be consistent. Fourth, freezing and change control: the baseline is frozen before dispatch, and later corrections go through a documented review and appeal path with a trace. Together with the alignment requirement for the 2 curves, these items make reduced relative to what recomputable by both sides.
VII. 3 evidence stages: agree, record, recompute
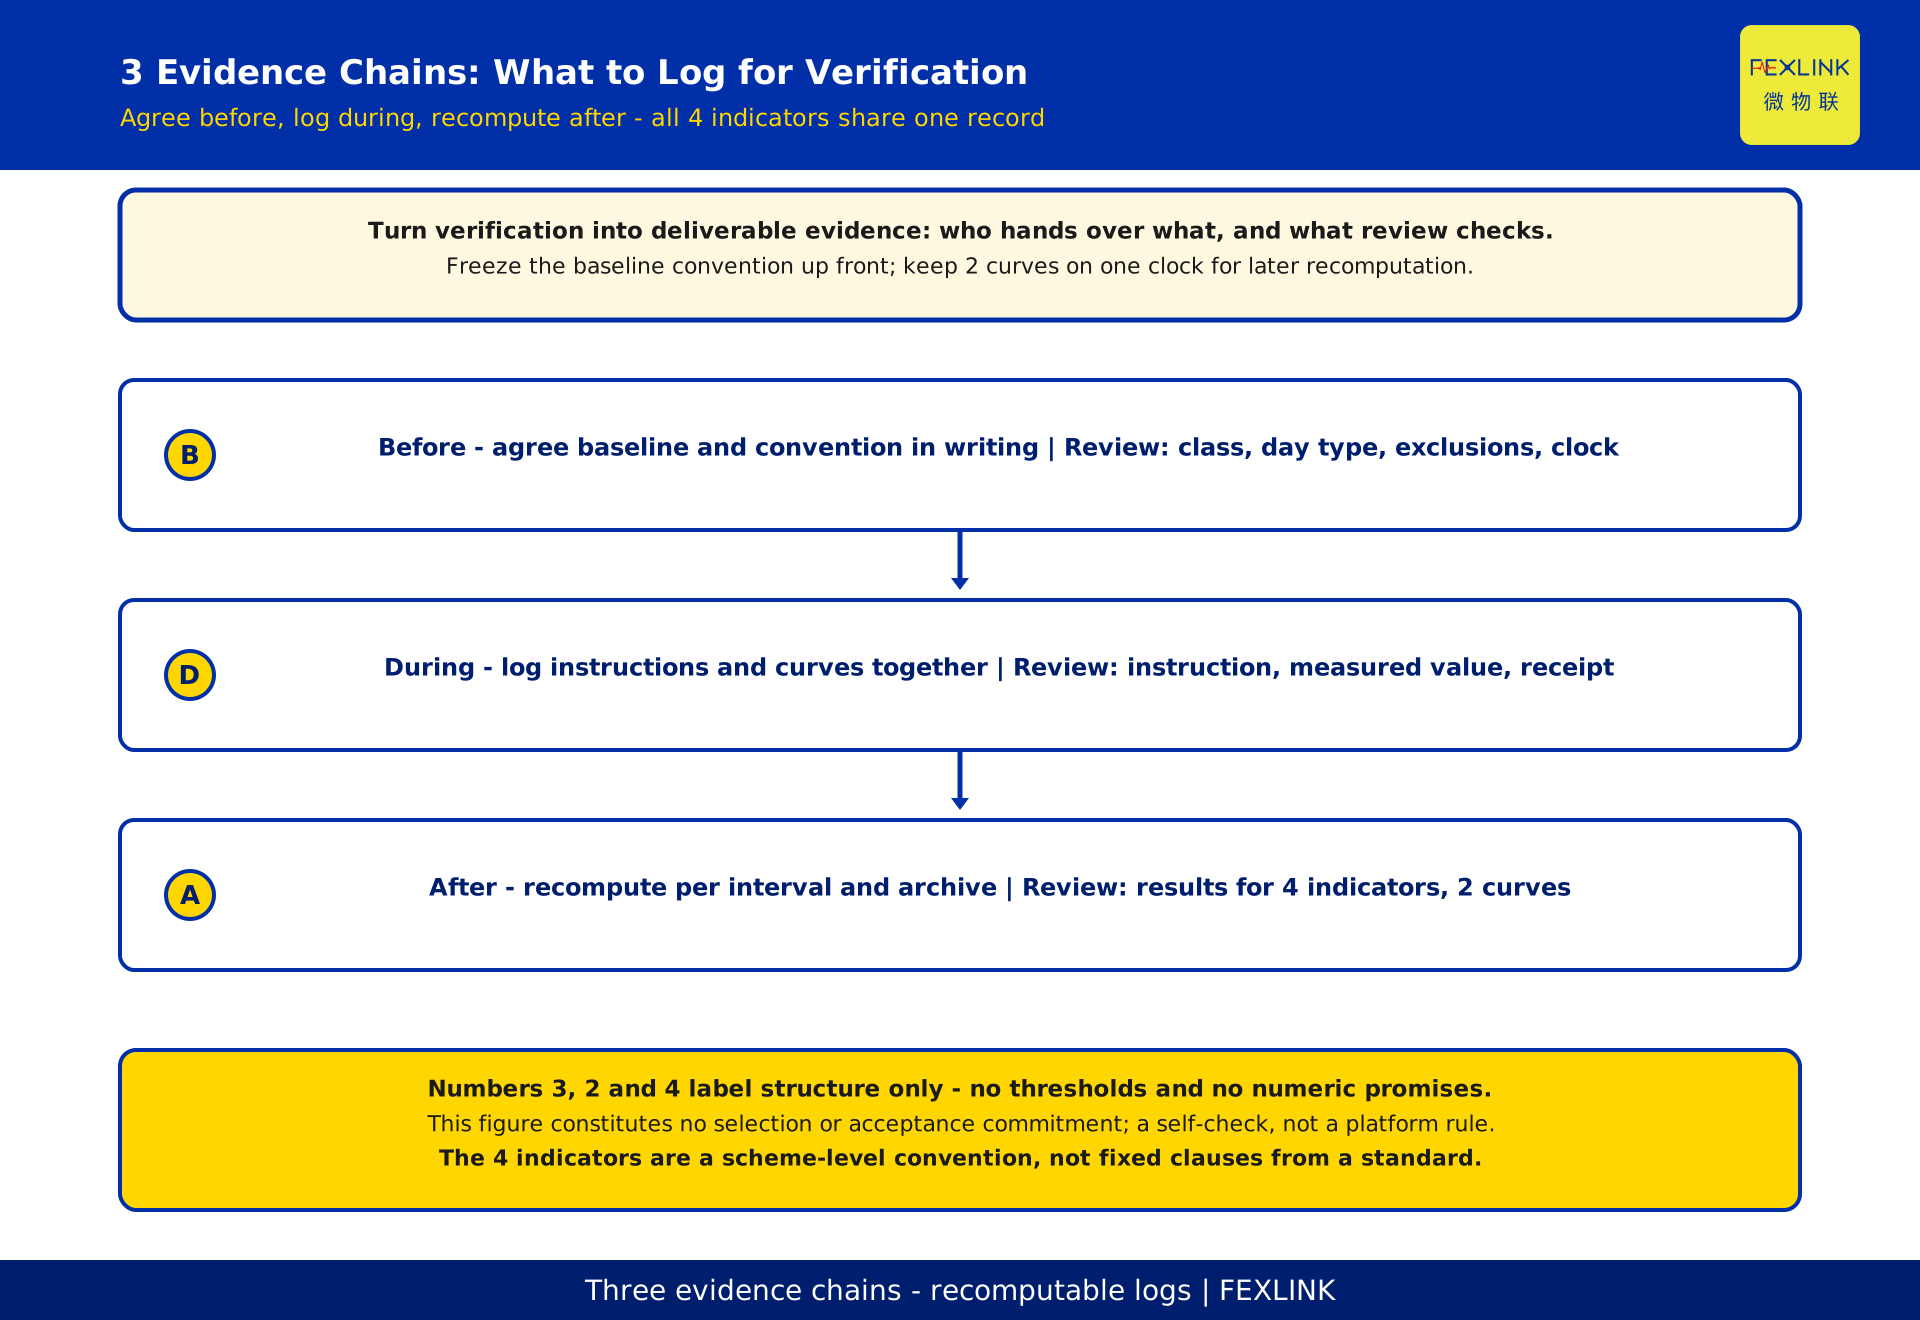
The four indicators are not four isolated reports; they are readings on one evidence chain with 3 stages. The agreement stage delivers the convention document: baseline classification and freezing, metering points and sampling granularity, instructed quantity and judgement window, deduction rules and the dispute path, written and confirmed by both parties. The recording stage delivers raw traces: baseline and measured curves, instruction issue and execution acknowledgements, state snapshots, and anomaly and missing-data logs, archived against a common time base with a retrievable index. The recomputation stage delivers the result: either party applying the same convention to the same raw curves should obtain the same capacity, duration, slope and deviation ratio. Recording is the stage most often skipped; keep only the result and a disagreement becomes unresolvable. Framing evidence as these 3 stages turns acceptance into whether the same records compute back to the same numbers. Detailed completeness requirements belong to platform rules; this article gives no thresholds.
VIII. A working table for the four indicators
The preceding sections collapse into a list that can be assigned and signed off. The table is not a scoring sheet; it asks whether the number can be recomputed from the records and who signs for it.
| Indicator | Common gap | Evidence to add | Who delivers | What acceptance checks |
|---|---|---|---|---|
| Response capacity | Sign reversed, energy total used as power difference | Interval baseline and measured curves | Metering and platform | Consistent convention, recomputable per interval |
| Response duration | Notice lead time mistaken for holding time | Continuous curve inside the window | Owner and platform | Start and end legible, continuous in between |
| Ramp rate | Only the final value read, climb ignored | Instruction timestamp and curve inflection | Platform and edge side | Aligned timeline, recomputable slope |
| Response accuracy | Conflated with metering accuracy | Instruction versus achieved comparison | Platform and owner | Judgement window explicit, convention written |
| Baseline load | Method changed afterwards, event day mixed in | Classification, sample, freeze and change logs | Platform and owner | Frozen in advance, changes traced |
| Time base | Clocks drift across systems | Common timestamps and missing-data logs | Integrator of record | Curves align, gaps explained |
IX. Typical shortfalls and why deductions must follow agreed rules
Falling short is not limited to the load failing to come down. Baseline inflation makes the response look larger; misaligned clocks break the interval-by-interval difference; a partial response leaves duration unreadable; early recovery drops the tail of the window; a gap filled afterwards with an average destroys recomputability; and an aggregated portfolio may report against its full bid even though some end users never responded. These share a plausible result with a broken evidence chain. Deduction logic therefore belongs in rules written in advance: which indicator failed, which interval is judged, and how appeal works are given by the contract and platform rules. This article supplies no ratio, coefficient or band and declares no party compliant. Keep raw records complete so a deduction can be contested. Being connected and being dispatched are different things; this article is about reading numbers, not a revenue promise; the generator does not self-approve.
Frequently Asked Questions (FAQ)
Q: Are capacity, duration, ramp rate and accuracy fixed clauses from some standard?
No. They are a scheme-level convention for reading performance, not the wording of any standard or policy clause. Local implementation rules do specify baseline classification and performance assessment, but the dimensions vary and these four terms are not uniformly one fixed set. Current published texts, platform rules and the contract govern. This article cites no standard number and no policy document number, and constitutes no policy interpretation.
Q: If the baseline and measured curves do not line up in time, can we bridge the gap with an average?
No, and an average should not become a settlement basis. The difference must be taken interval by interval on one shared time axis. Align clocks, log missing data, then apply the rule agreed in advance; a gap filled afterwards erases the process. Raise genuine errors through the published appeal window and archive both versions.
Q: If the response is slow but the target is reached eventually, is that acceptable?
The three readings cannot be merged. Capacity says how much was shifted, duration says how long it held, and ramp rate says how quickly it arrived; reaching the target describes the outcome, not the process. A caller normally judges interval by interval against an agreed window. Keep those three on one time line.
Q: Is response accuracy the same as meter accuracy, and would a better meter improve it?
No. Meter accuracy is an instrument error; response accuracy is a behavioural deviation between the executed result and the instruction. A better meter makes the curve more credible, not the instruction better executed. The separate article on nameplate capacity and field-level physical accuracy explains a settlement scaling chain, not this reading. This article quantifies no precision discount and constitutes no selection or acceptance commitment.
Q: Are there uniform thresholds and coefficients, and is the ESA all-element smart meter mandatory?
This article gives none: thresholds, ratios, time windows, coefficients and compensation rules are set by local implementation rules, platform rules and contracts, and they change. The ESA all-element smart meter corresponds to collecting power and energy curves, timestamps and event logs at key circuits; whether it is used depends on the metering layout and platform requirements. This article provides only a framework of what to agree and which records to keep, and constitutes no selection or acceptance commitment.
Scope and limitations
This article applies to industrial and commercial users, load aggregators and virtual power plant operators who need to turn four performance indicators into recomputable readings and an evidence chain before taking part in demand response. It does not cover residential response or market trading rules, and does not replace any party's connection specification, metering verification requirements or settlement rules. No standard number or policy document number is cited; no threshold, coefficient, ratio, timetable or compensation rule is given; no measured data or case values appear. Those belong to current published texts, platform rules, contracts and vendor documentation. The 4 indicators are a scheme-level convention, not the wording of any standard or policy clause. This article constitutes no policy interpretation or engineering basis, constitutes no selection or acceptance commitment, and the generator does not self-approve. Deliverables remain pending independent review; independent QA, owner acceptance and downstream gates are performed by others, and nothing here is published.
Frequently Asked Questions
How to Verify Demand Response
When settlement arrives and nobody can say how much load responded, the reading convention was never written down before the event