 FEXLINK Research Institute
The short answer
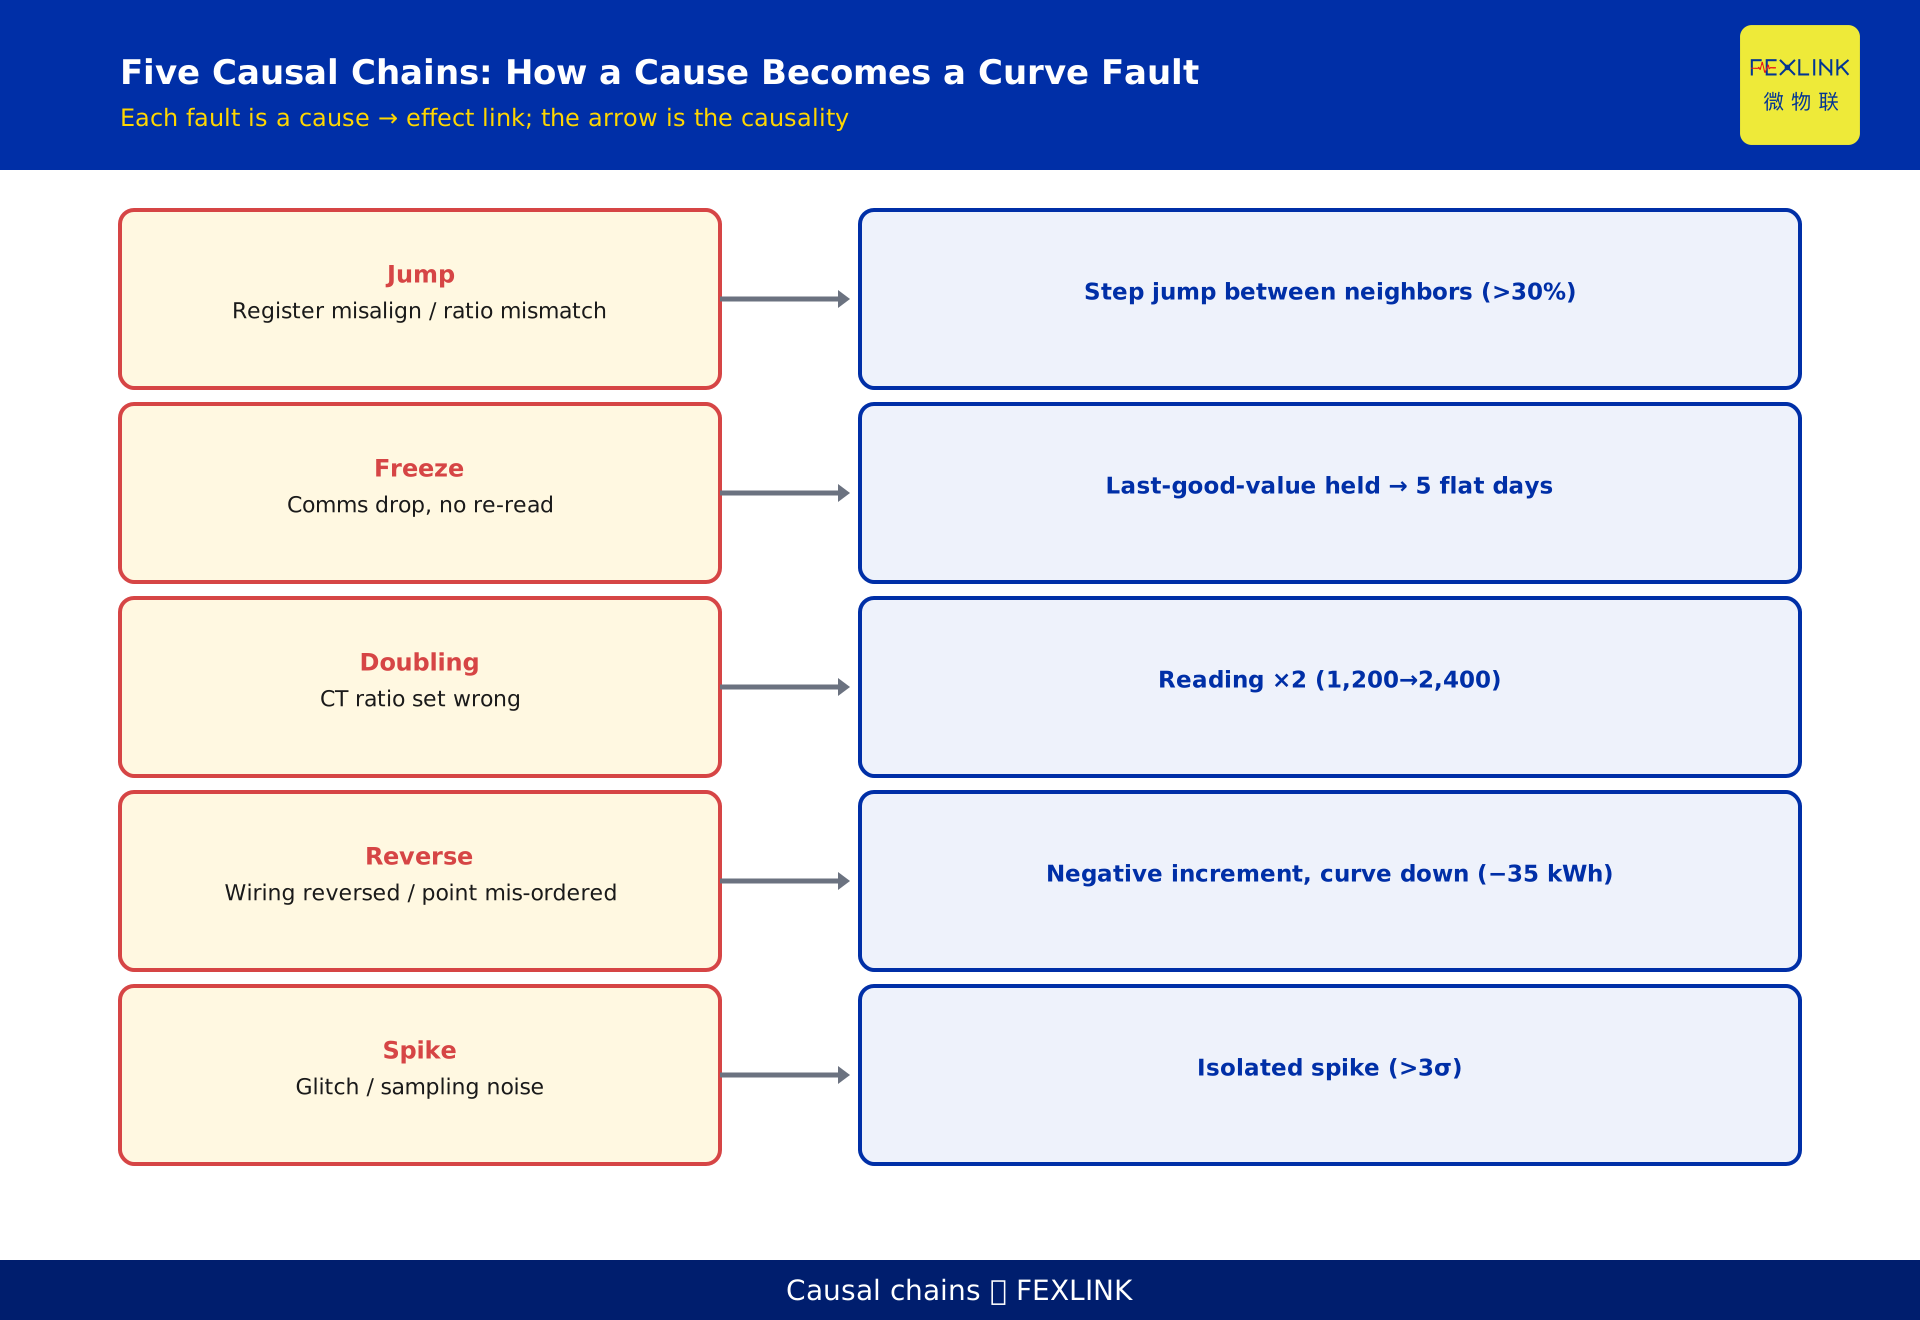
When a meter's energy curve suddenly doubles or stays dead flat for days, "the meter is broken" is only one of five explanations. Each fault pattern has its own mechanism: jumps come from register misalignment or ratio mismatch; freezes happen when comms drop yet the system keeps serving the last good value; doubling traces to a wrong CT ratio; reverse flow comes from reversed wiring or mis-ordered freeze points; spikes are interference glitches. The real pain is that anomalies hide inside normal-looking curves until reconciliation. Three online tests — adjacent-difference limit, constant-value detection, and a magnitude band — catch them, and settlement data should be flagged, never silently dropped.
1. What "frozen data" means on a meter
A smart meter does not only show a jittering instantaneous power. At agreed moments it snapshots the cumulative energy and stores it; that snapshot is the frozen value. Common freeze types are the interval freeze (every 15 minutes or every hour), the daily freeze (at 00:00), and the monthly freeze. The "energy curve" a platform pulls is essentially a time-ordered sequence of frozen increments.
Freeze and communication behavior are defined in public standards such as DL/T 645 and IEC 62056-21: the meter records "the cumulative value at a moment" driven by its own clock, independent of how often the master station polls. That definition matters here: a frozen value is cumulative, and the "daily consumption" a platform sees is the difference between two consecutive freezes. Almost every anomaly arises at the moment of "taking one difference" or "reading one value".
2. The five fault patterns at a glance
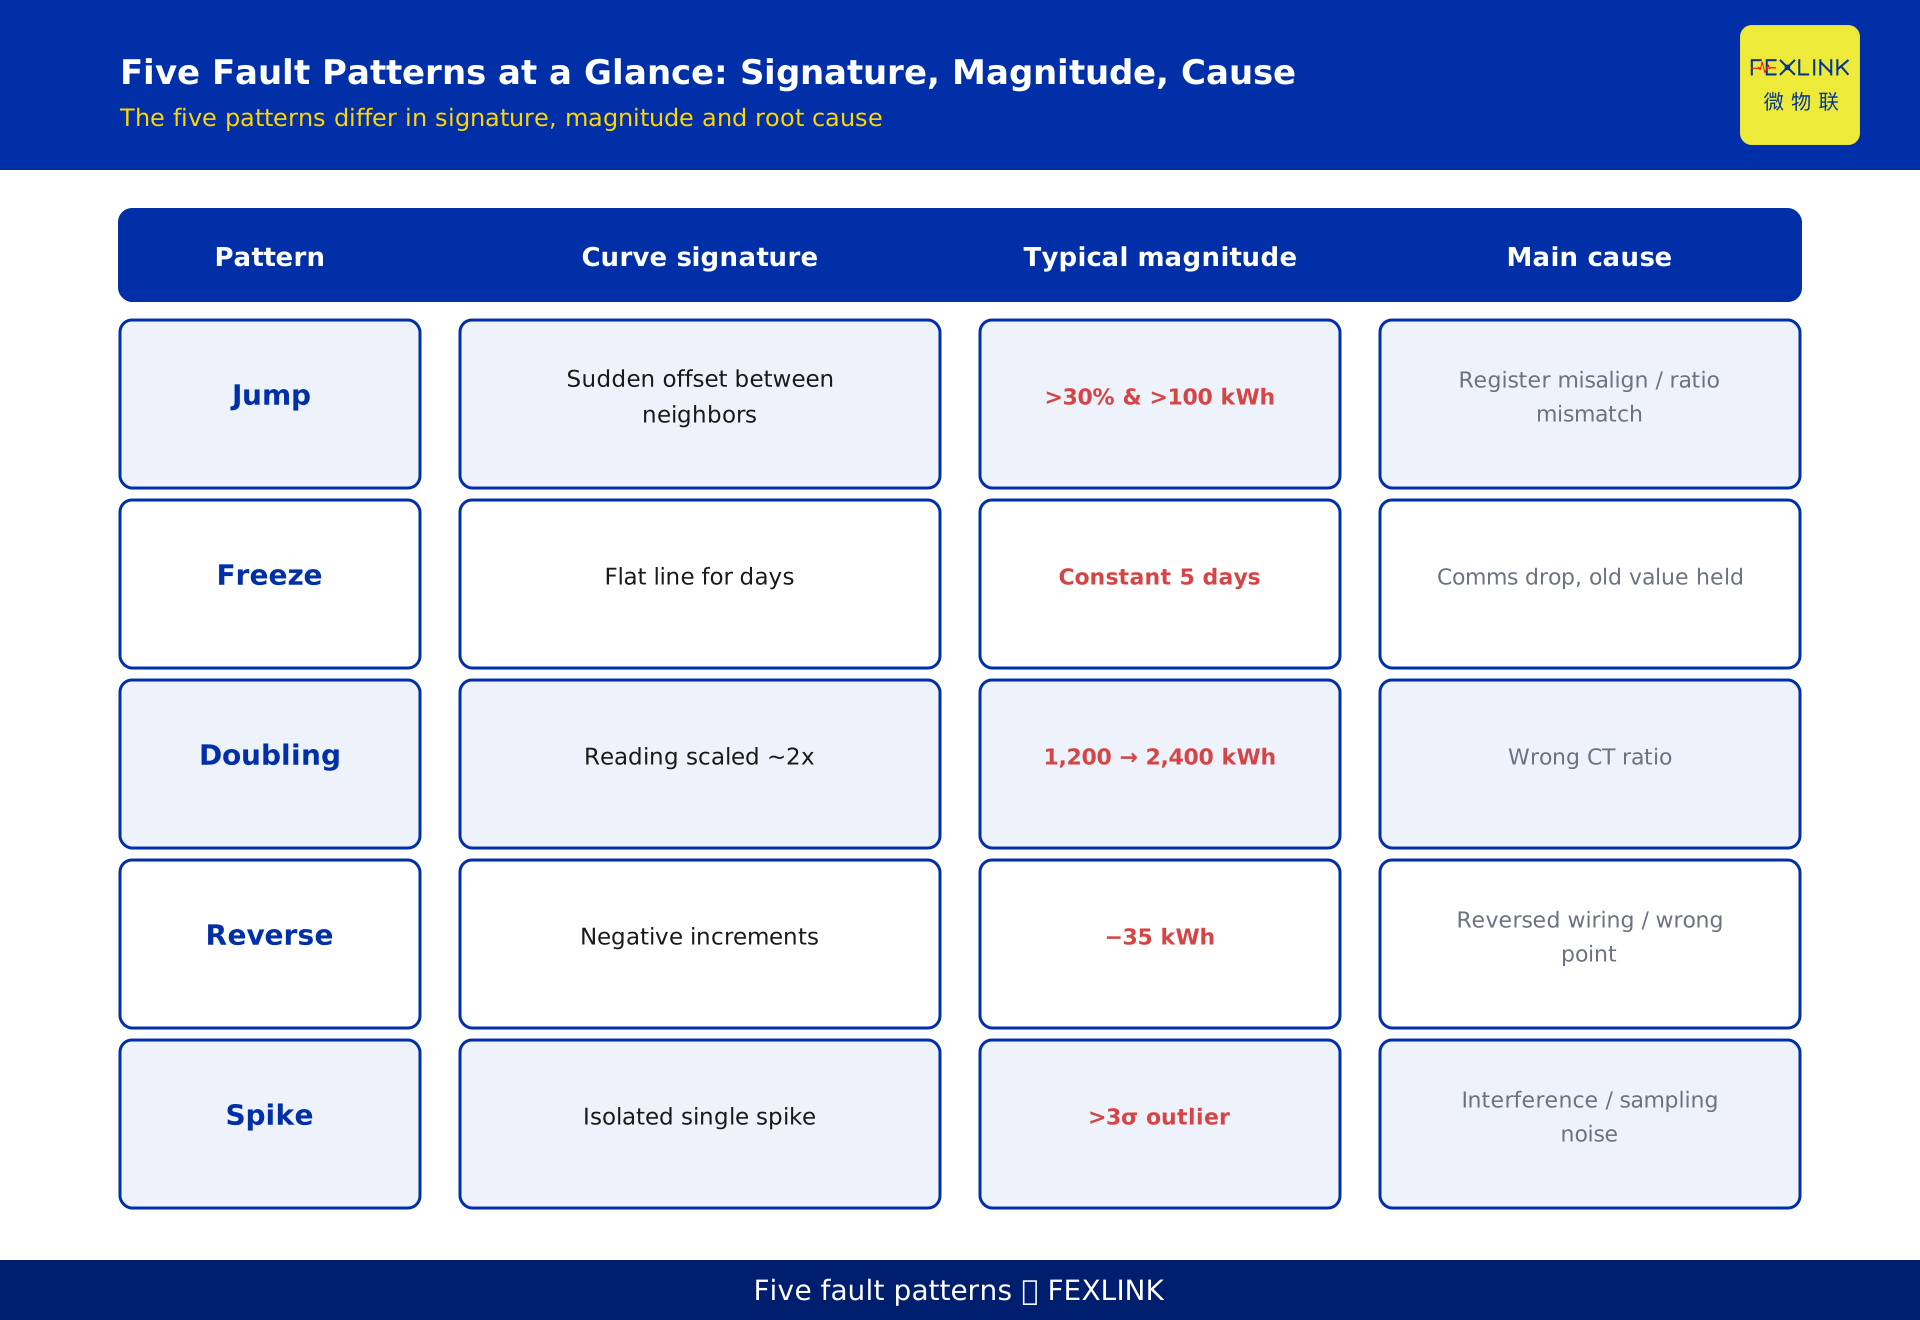
Put the five patterns side by side and their curve signatures, magnitude, and causes are distinct, as Figure 1 shows. The comparison table below sets up the rest of the article, where each causal chain is unpacked.
| Pattern | Curve signature | Typical magnitude | Main cause |
|---|---|---|---|
| Jump | sudden large offset between neighbors | adjacent diff > 30% and > 100 kWh | register misalignment / ratio mismatch |
| Freeze | flat line for days | constant for 5 days | comms drop, last value reused |
| Doubling | reading scaled by ~2 | 1,200 → 2,400 kWh | wrong CT ratio setting |
| Reverse | negative increments | −35 kWh | reversed wiring / wrong freeze point |
| Spike | isolated single-point spike | outlier > 3σ | interference glitch / sampling noise |
The five are not mutually exclusive — one meter can freeze then jump, or show spikes stacked on a jump. The detection logic must tag each type before any cleaning happens.
3. Jump: register misalignment and ratio mismatch
A jump is an unreasonable large upward or downward swing between two adjacent freeze points. Two root causes dominate.
First, register misalignment. A meter stores several time-stamped registers (current, previous 1, previous 2 freezes). If the master station reads a register address that does not line up with the meter's definition, it occasionally reads the previous time stamp's value, producing a one-off large offset between neighbors. Second, ratio mismatch: the meter is set to 1 while the gateway or platform is set to, say, 4, or vice versa, so every reading is systematically scaled.
Jumps tend to occur abruptly right after one collection cycle, and the offset is stable (because it is a fixed ratio or fixed misalignment). So on the curve it looks like a "step", not like noise that wiggles back and forth.
4. Freeze: comms drop but last-good-value held
Freeze is the pattern most likely to fool operators into thinking "nothing happened". Link jitter between meter and master station, a gateway power loss, or a blocked antenna can fail one poll. Many collection systems default to serving the last successfully read value (industry calls it last-good-value hold) when a read fails. The result is a suspiciously flat line on the platform — while the meter behind it keeps running, the data simply did not update.
To decide it is not "load genuinely flat", check two things: whether that point stays constant across several consecutive freeze periods, and whether other meters on the same feeder are still moving normally. If only one meter is flat while its neighbors move, freeze is the likely cause.
5. Doubling: the CT ratio set wrong
Doubling is when the reading becomes about 2 times (or N times) the truth — the most visible of the metering errors. The root cause is almost always the CT (current transformer) ratio setting: on site the transformer is 100/5, but the meter or gateway was configured as 50/5, or the reverse, so the reading is off by a factor of 2. This error never alarms, because to the system "the value is in range and keeps climbing every day" — it is just climbing at twice everyone else's rate.
Doubling differs from a jump: a jump is "wrong once, suddenly", while doubling is "wrong systematically from a certain day on". One has a step, the other a slope; the chart tells them apart.
6. Reverse: reversed wiring or mis-ordered freeze points
Reverse means the energy increment over a period goes negative and the curve dips. Common roots: the CT secondary is wired in reverse (polarity flipped), or the voltage/current phase is misconnected, so active energy is computed as negative; the other class is a mis-ordered freeze point — reading "end of last month" and "end of this month" in the wrong order yields a negative difference.
Reverse is usually negative across a whole segment, not a single point. In rare half-reversed cases it alternates positive by day and negative by night; that positive-negative alternation is itself a detection clue.
7. Spike: interference glitch and sampling noise
A spike is an isolated single-point stab: almost every point is normal, yet one freeze point shoots up out of nowhere (or drops near zero). The usual cause is electromagnetic interference, lightning induction, or a power-supply glitch at the instant of sampling, distorting that one reading. It differs from a jump by being "isolated" — the points before and after a spike are normal, whereas a jump carries the series onto a new step.
Engineering practice flags spikes statistically: using a rolling mean and standard deviation as the baseline, any point deviating beyond 3σ is first tagged as a suspected glitch, then judged against whether its neighbors are stable before deciding its role in settlement.
8. Three online tests: difference limit, constant detection, magnitude band
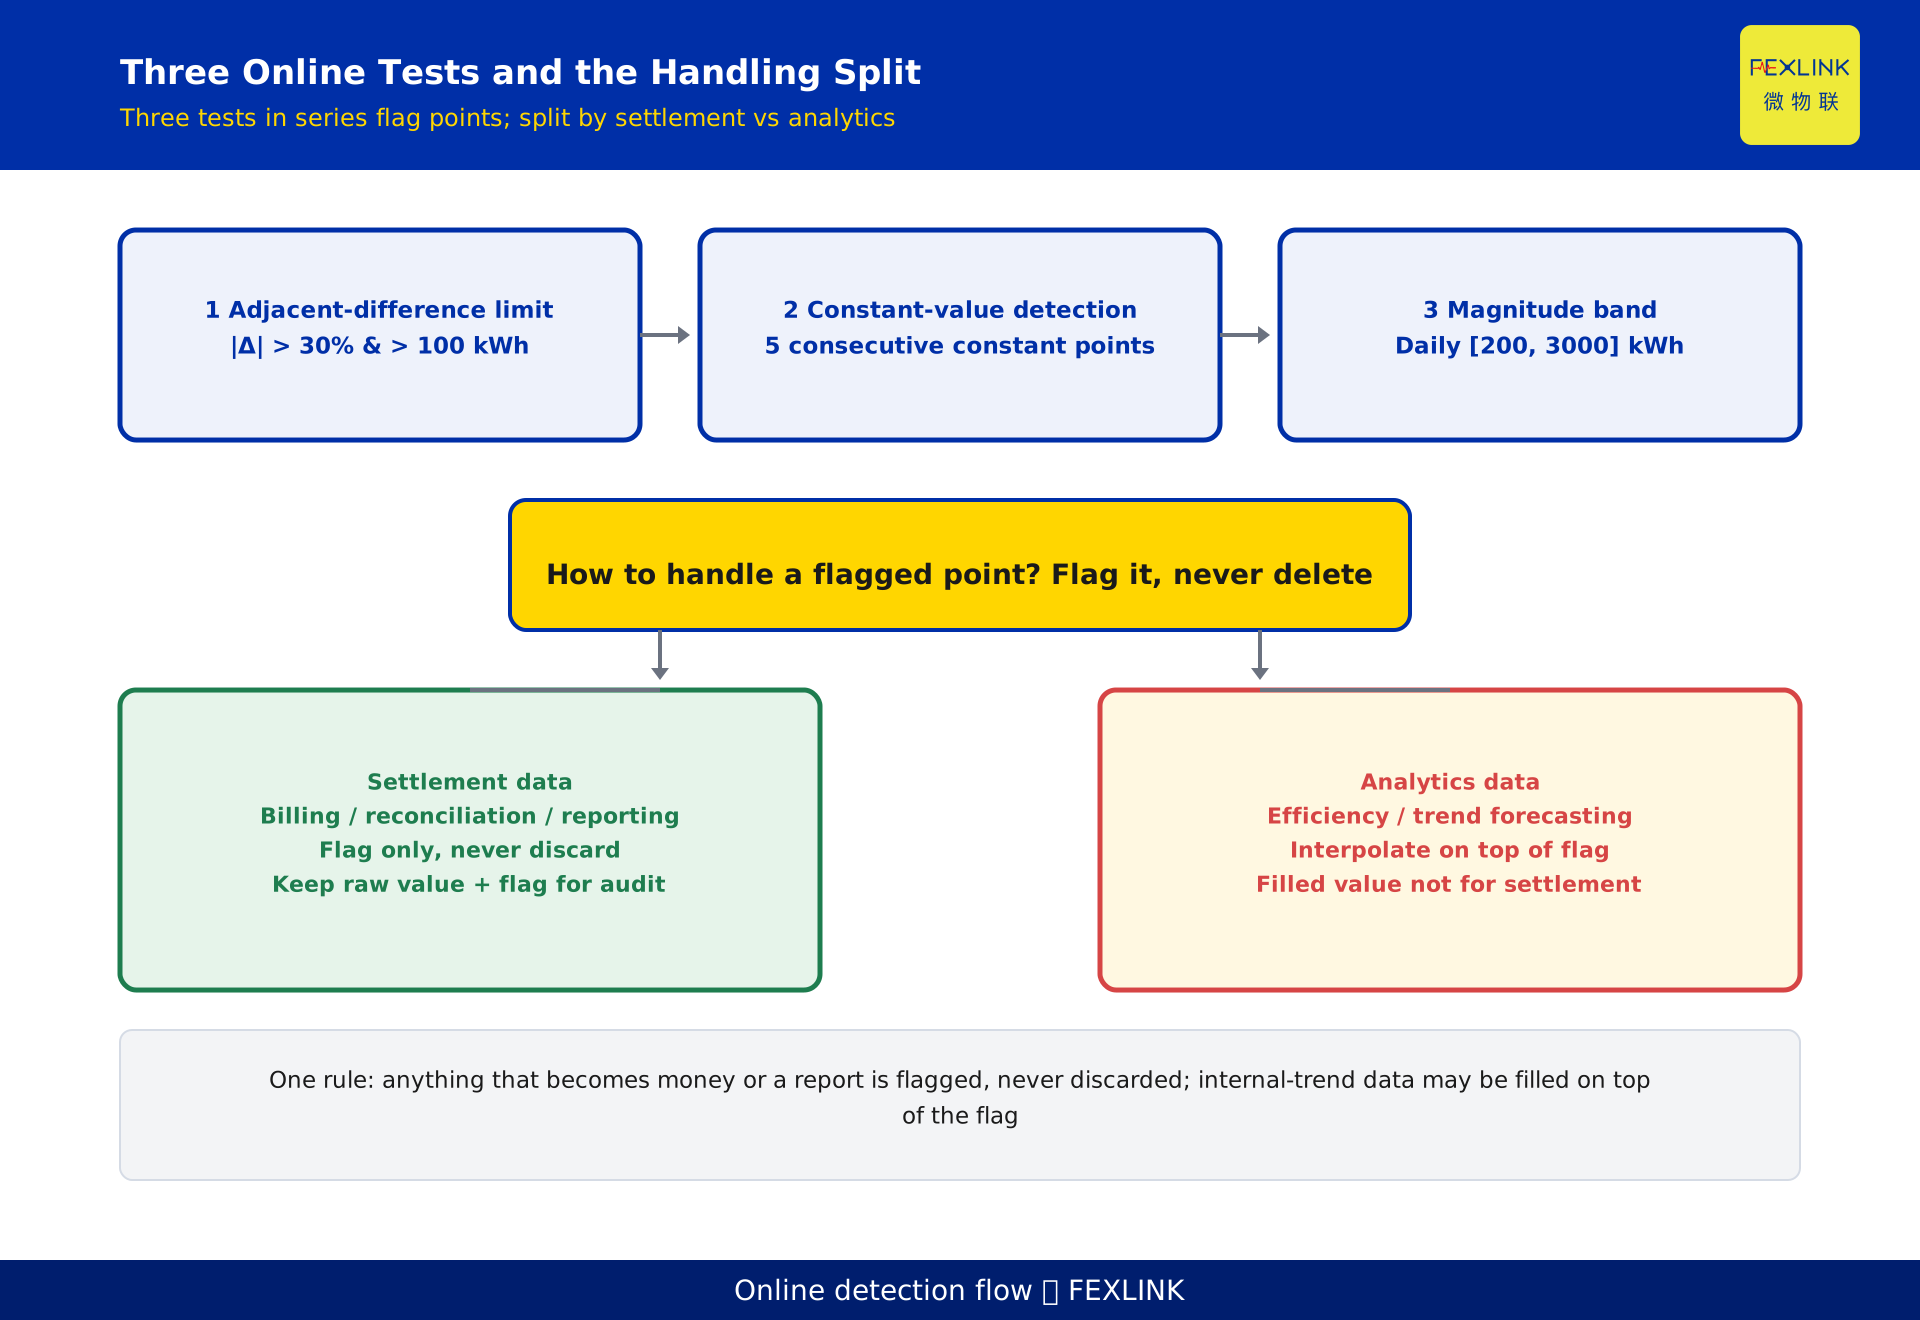
Translating the five patterns into rules a machine can run gives three tests, shown in Figure 3.
Adjacent-difference limit. Take the absolute difference between two adjacent frozen increments; if it exceeds a threshold, tag a jump. A workable constructed example: trigger only when |Δ| > 30% and |Δ| > 100 kWh both hold. The dual condition of "percentage plus absolute amount" avoids false alarms on small bases.
Constant-value detection. Test consecutive freeze points for constancy: if 5 consecutive freeze points (here, 5 consecutive daily freezes) are exactly identical, tag a freeze. The threshold can be tuned to freeze density — the denser the data, the shorter the window can be.
Reasonable magnitude band. Use history to set a plausible interval, e.g. a daily increment of [200, 3000] kWh. Below the lower bound may be a spike-to-zero or reverse; above the upper bound may be doubling or a jump. The band catches the outliers the first two tests do not cover individually.
The three can run in series: constant detection first to clear freezes, then the difference limit for jumps or doubling, then the band as backstop. Every hit gets an "anomaly flag" field rather than being deleted.
9. Flag or discard: what to do after detection
This is where this article adds beyond KD-0496 (the four-checkpoint credibility framework): the focus is not the "is-the-data-trustworthy" framework, but the handling principle of "once detected, what next".
The conclusion splits into two classes:
- Settlement data (billing, reconciliation, reporting): flag only, never discard. Keep the raw reading and the anomaly flag so every entry is traceable — "what was seen, what was tagged". Prefer settling with the flag over silently deleting; deletion is irreversible and leaves no audit trail.
- Management-analytics data (efficiency diagnosis, trend forecasting): on top of the flag, interpolation can fill gaps (forward fill, linear interpolation), but the method and the affected interval must be recorded, and filled values are for analysis only, never fed back into settlement.
One-line criterion: anything that becomes money or a reported figure gets flagged first; anything used only for internal trend viewing may be filled on top of the flag.
10. A desensitized constructed example: 50 meters on one campus
The following scene is constructed to illustrate the detection logic of the five patterns and represents no real customer or project.
A campus has 50 three-phase meters logging daily frozen increments (daily at 00:00). Normal daily increment sits in roughly [200, 3000] kWh with a mean near 1,200 kWh. A patrol scan with the three tests found:
- Meter A: daily increment jumped from 1,200 kWh to 2,400 kWh — the band hits its upper bound, and combined with "systematic doubling from a certain day" it is judged a wrong CT ratio (doubling).
- Meter B: constant at 1,180 kWh for 5 consecutive days while neighbors on the same feeder moved normally — constant detection fires, judged a comms-drop reuse of the old value (freeze).
- Meter C: one day only 40 kWh, below the band's lower bound of 200 — the band fires; with stable neighbors it is judged a spike-to-zero glitch.
- Meter D: a negative increment of −35 kWh — outside the band and negative, judged reversed wiring (reverse).
- Meter E: adjacent-day difference of 420 kWh (> 30% and > 100 kWh) — the difference limit fires, judged register misalignment (jump).
Five meters, five mechanisms, all detected and flagged online by the same three-test rule — no need to wait until month-end reconciliation to expose them.
Frequently asked questions (FAQ)
Q: Is anomalous data a broken meter, or did collection drop?
Not necessarily. Doubling is almost always a wrong ratio setting; freeze is almost always a comms drop reusing the old value; jumps mostly come from register misalignment. Genuine hardware failure is rarer — most anomalies are configuration or link issues, so fixing settings is more common than swapping the meter.
Q: How are the 30% and 100 kWh in the difference limit chosen?
The 30% and 100 kWh given here are a constructed example to show the method, not a fixed standard. Real thresholds should be calibrated from the meter's historical volatility, load profile, and freeze density; the denser the data, the tighter the absolute threshold can be.
Q: If it froze for days, can that period just be filled in?
Not for settlement — only flag and keep the original value. For analytics, interpolation on top of the flag is allowed, but the filled interval and method must be recorded, and the filled values must not flow back into settlement.
Q: Is the [200, 3000] kWh magnitude band universal?
No. That band is set in this constructed example from "50 meters on a campus, daily freeze, mean near 1,200 kWh" and is for illustration only. A real site must recalibrate the upper and lower bounds from its own historical data.
Q: Flag or discard — is there a one-line rule?
Yes: any data that becomes billing, reconciliation, or reporting is flagged, never discarded; any data used only for internal efficiency analysis or trend judgment may be filled on top of the flag. The test is "will this data turn into money or a reported figure".
Scope and limitations
- The five anomalies (jump, freeze, doubling, reverse, spike) and the three online tests (adjacent-difference limit, constant-value detection, reasonable magnitude band) apply to scenarios that build energy curves from frozen increments on smart meters or edge collectors; they do not apply to pure instantaneous-power sampling that never takes a cumulative difference.
- The threshold examples (difference limit 30% and 100 kWh, constant detection over 5 consecutive freeze points, magnitude band [200, 3000] kWh, 3σ outlier) are constructed to illustrate the method and represent no standard value or product default; real thresholds must be calibrated from on-site historical data.
- The values in the campus example (50 meters, daily freeze, mean near 1,200 kWh, and the 2,400 / 1,180 / 40 / −35 / 420 figures for meters A through E) are constructed to illustrate the problem and represent no real customer, project, or measured result.
- DL/T 645 and IEC 62056-21 cited here are public references on meter communication and data identification; specific clauses follow the currently valid versions and the vendor's protocol implementation.
- The ESX/CW edge gateway, FEXCloud, and the Taiyi central-control system L2 cleaning layer, and their anomaly-flagging and interpolation capabilities, follow the latest product knowledge base and selection manual; this article is not a selection or procurement recommendation.
- This is a deep technical-principle analysis giving "detection mechanism plus handling principle"; it does not replace per-project metering calibration and on-site verification.
Frequently Asked Questions
Why Meter Frozen Data Jumps, Freezes or Doubles
When a meter's energy curve suddenly doubles or stays dead flat for days, "the meter is broken" is only one of five explanations