 FEXLINK Research Institute
The short answer
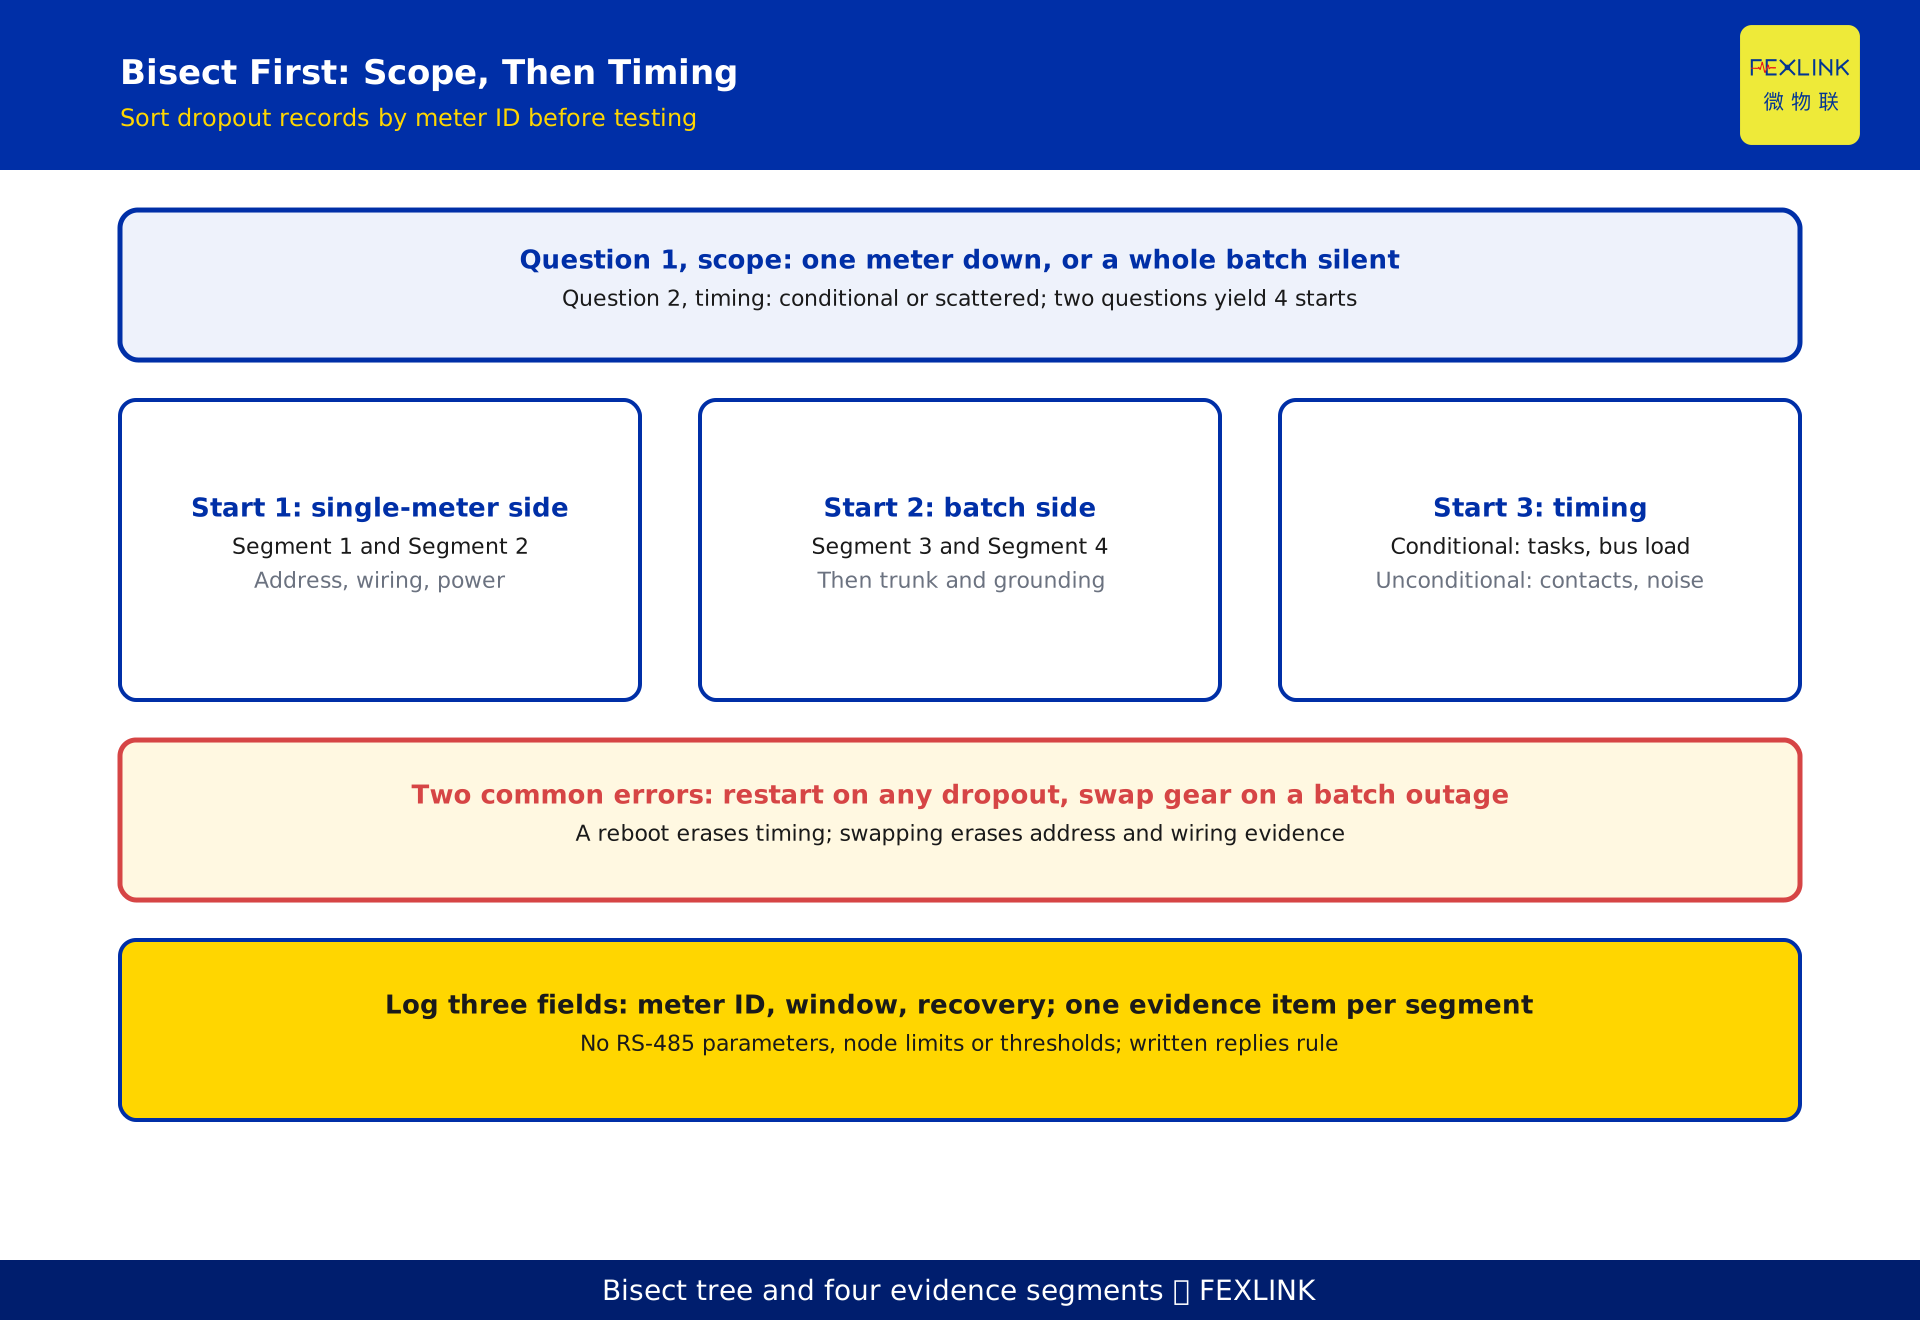
When meter data keeps dropping offline, do not restart the gateway first. Bisect by meter ID: one meter points to its address, wiring and meter-end power; a whole batch points to the gateway, trunk line and uplink network. The second test is timing: failures clustered around one action or time window point to polling collisions, bus loading or uplink congestion, not random device failure. The two questions narrow the search to one segment of a four-part chain; collect evidence per segment. A restart only hides the symptom.
This article gives a location order and evidence checklist only, with no fixed numbers for baud rate, node limits, timeouts, termination resistance, signal thresholds or bandwidth. Parameters follow the nameplate, selection manual, site survey and vendor's written reply. FEXLINK ESX edge gateway, CW industrial gateway, and FEXCloud IoT cloud platform share one topology drawing but sit on different sides; they are enterprise-disclosed lineage positions for role comparison only.
A two-way decision tree: scope first, then timing
The first step does not touch equipment. Sort dropout records by meter ID and see how many share one branch. One meter or a few scattered non-adjacent ones is the single-meter side; most meters under one gateway going silent is the batch side. The value is exclusion: with one meter down the gateway still serves others; with a batch down, checking meters one by one finds no common cause.
The second step is timing. Dropouts concentrated at one moment, after one action, or after device additions or collection changes are conditionally triggered; scattered ones with no matching action are unconditional. The former leads to scheduled tasks and bus loading, the latter to contacts, supply and interference.
Crossing the two gives four starting points: single and unconditional points to wiring, address or the meter; single and conditional to address conflicts or read timing; batch and unconditional to gateway power, trunk line or grounding; batch and conditional to polling overload, backfill or uplink congestion. Record the meter ID, start and end time, and recovery method.
One read spans four segments: meter, wiring, gateway, uplink
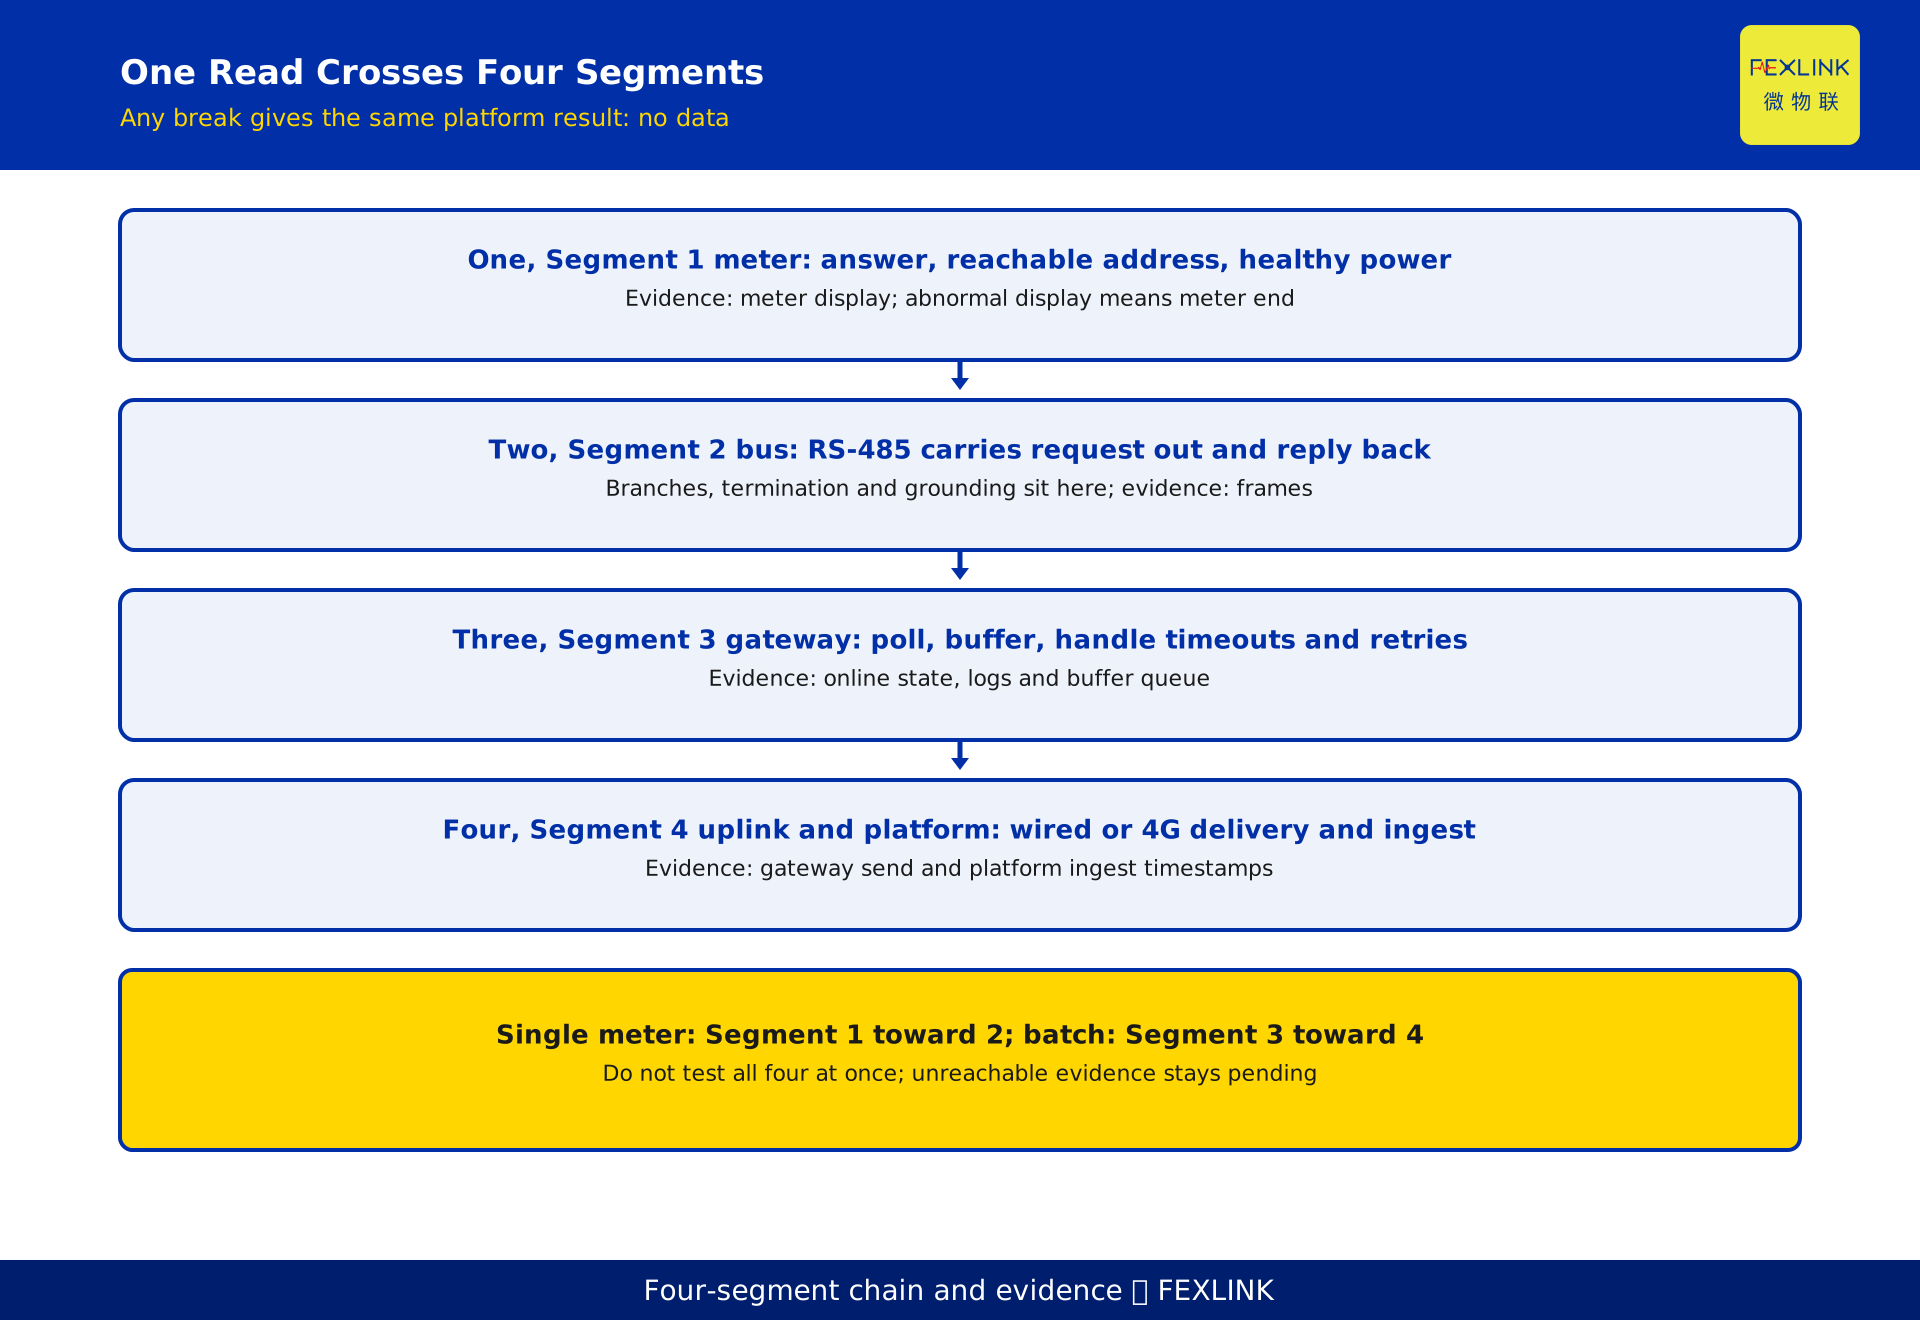
A successful read crosses four segments. Segment 1 is the meter end: the meter answers, its address is reachable, power is healthy. Segment 2 is the bus, where an RS-485 link carries the request out and the reply back, along with branches, termination and grounding. Segment 3 is the gateway, polling from a point list, buffering data and handling timeouts and retries. Segment 4 is the uplink and platform, delivering over wired or 4G and storing the result.
In series, any break produces the same platform result: no data for those points. "The platform shows nothing" locates nothing. Ask which segment still shows evidence moving: the display, frames, gateway online status and buffer queue, or ingest timestamps.
The split gives the starting point: single-meter failures run from Segment 1 toward Segment 2; batch failures from Segment 3 toward Segment 4, then back to the Segment 2 trunk. Leave one reproducible evidence item per segment; otherwise write "pending written confirmation".
Single-meter checks: address, wiring, and meter power
Start with three on-site checks. First, the address: is it duplicated, does the point-list address match the meter setting, and was the point list updated after a swap? Conflicts show as two meters alternating online, easily misread as "intermittent".
Second, the wiring: are the RS-485 A/B conductors reversed, loose or weakly terminated, is shielding consistent with the survey, and was a branch tapped off the trunk at random? Such faults shift with doors, vibration and humidity, matching the unconditional case.
Third, meter-end power: is the meter powered, does an auxiliary supply sag when shared, and must it re-enter a communicative state after an outage? Record the display separately: normal with no platform data puts the fault after the meter; abnormal puts it at the meter end. Only after all three fail should the port status go to the vendor in writing. Do not swap the meter first: it destroys address and wiring evidence.
Bus-side checks: loading, reflections, and grounding
The shared signature is "more than one meter affected, but no permanent full-batch outage". First check loading and branches: how many meters hang on the bus, how branches are routed, and whether the last-added meter sits at the far end. No fixed node or distance limits are given; the criterion is whether the dropout range expands after each addition.
Next, signal integrity: is termination configured per the manual, anything missing or duplicated, is the shield grounded at one end, and does the cable run parallel to power cabling? Short frames pass while dense polling fails, often misread as protocol incompatibility.
Third, contention: are two masters polling the same bus, or is a commissioning tool reading in parallel? Capture request and reply frames in the same window: was the request never sent, the reply never returned, or the checksum failed? Those outcomes point to the gateway, the link and interference respectively.
Gateway-side checks: polling, buffering, and backfill
FEXLINK ESX edge gateway and CW industrial gateway poll and relay data here. Their polling capability, buffer capacity and interface conditions are enterprise-disclosed model-lineage descriptions for role comparison only, following the nameplate, manual and vendor's written reply. Diagnosis reads records, not model names.
First, the polling schedule: did dropouts begin after collection grew denser, is a round approaching its timeout, and are retries saturating the bus? The criterion is whether dropout frequency tracks collection changes.
Second, buffering and backfill: is there local storage during a short uplink loss, is data resent under its original timestamp, and does backfill displace new data? A blank after every jitter points to the backfill policy, not the meter or wiring.
Third, gateway state: is the supply stable, is there a scheduled restart, and do logs show repeated reconnects? A restart only shows that state was cleared; the cause may still sit in a queue or parameter. Take logs before changing configuration, which alters the trigger and destroys the timing pattern.
Uplink-side checks: signal, network, and platform intake
Segment 4 runs from gateway egress to platform ingest. On a wired link, check reachability and routing changes; on 4G, check signal conditions, the carrier network and tariff status. No signal threshold or bandwidth figure is given; site measurement governs.
Separate "the gateway sent it" from "the platform received it". A send record with no ingest places the fault in the uplink or platform intake; neither means return to Segment 3. FEXLINK FEXCloud IoT cloud platform is a platform-side role: it receives delivered data and cannot fill points never collected upstream or fix bus wiring.
Timestamps matter too. Backfill stored by arrival time compresses the curve into one dense block, easily misread as abnormal consumption. That is an ingest-time convention; compare ingest with gateway send timestamps.
How to read timing patterns: cycles, triggers, and concurrent actions
Timing is the second criterion and the one a restart erases most easily. Read records in three columns: start and end time, action, recovery method.
Dropouts fixed to a round hour, scheduled read or report generation point to periodic tasks and dense polling; those after adding meters, densifying collection or attaching a commissioning tool point to loading and contention; those after uplink jitter or a network switch point to buffering and backfill. All are conditional, so changing the trigger beats changing the device. Scattered events with no common action return to poor contacts, supply ripple and interference; restarts will not help.
Check one counter-example: did the same action ever occur without a dropout? If yes, the action is correlated, not causal; only otherwise list it as a trigger awaiting reproduction.
Worked example: locating periodic dropouts at a park
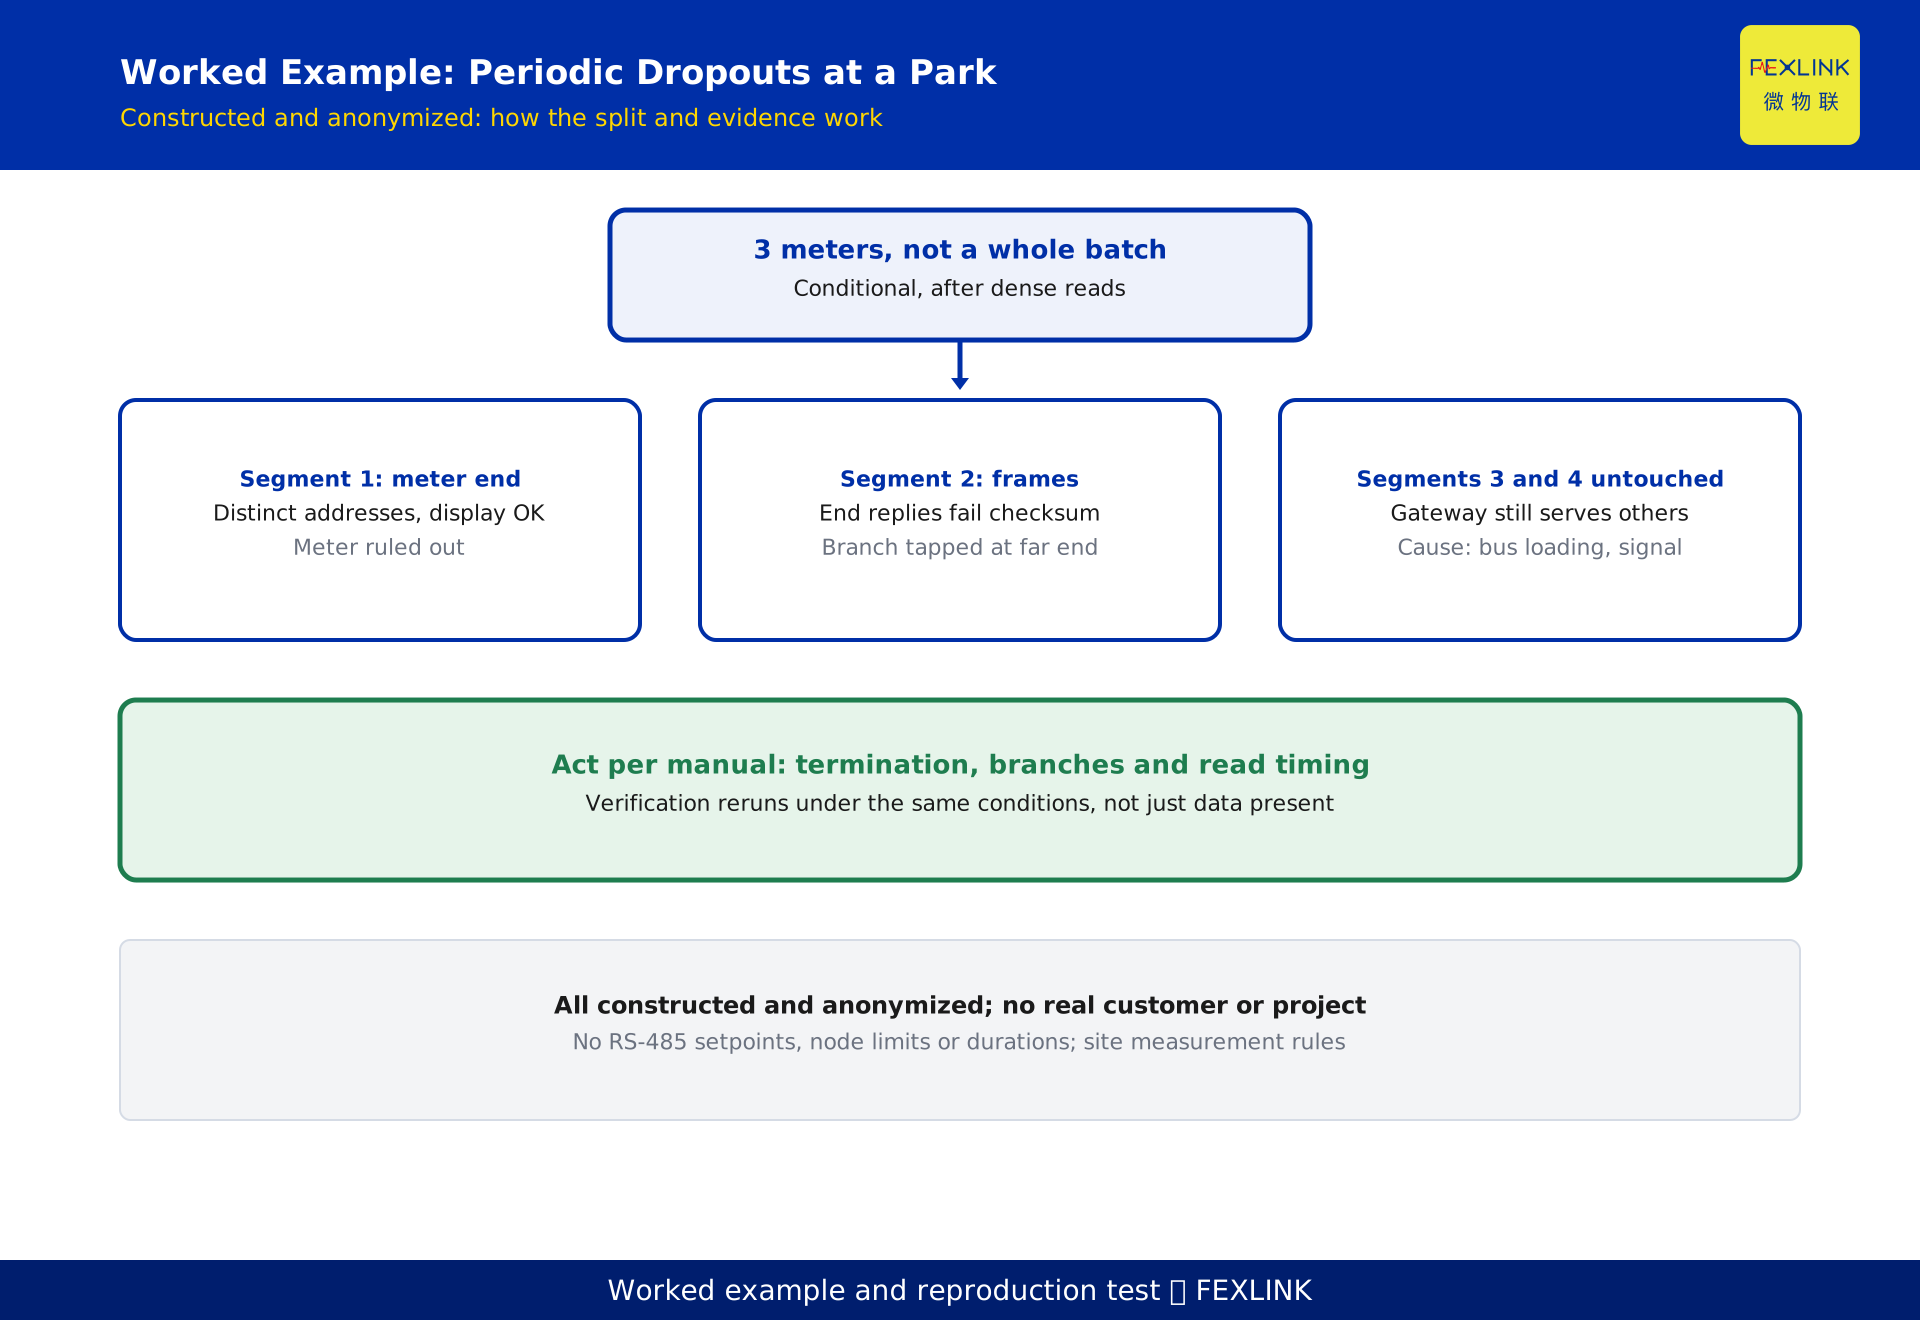
At one park, low-voltage meters connect over a bus to a gateway and then a platform. Operators report several meters unreadable at intervals, with a gateway restart helping for a while. This is an anonymized constructed example, not a real project conclusion.
Sorting by meter ID shows it is not a whole batch: 3 meters at one branch end alternate while the rest stay healthy, so it lands on the single-meter side. Timing clusters after each denser collection, so it is conditionally triggered. From Segment 1 toward Segment 2, addresses and the point list check out: the 3 meters have distinct addresses and normal displays. Segment 2 frames show checksum failures on end-of-branch replies during dense polling, and the branch was tapped off the far end of the trunk.
The starting point narrows to bus loading and signal integrity, not the meter or gateway. Actions follow the manual: check termination, tidy branches and shield grounding, and adjust read timing on that branch; parameters follow site measurement and the vendor's written reply. Verification is not "data is present now" but rerunning under the same density, matching replies against ingest timestamps for the 3 meters, with no recurrence. The recovery method changes from reboot to condition-reproduction verification, and the ledger records cause, action and verification time. The example gives no setpoints or durations.
The dropout ledger and reproduction test: do not let a reboot hide the fault
Each ledger row keeps four columns: scope (meter IDs, branch, gateway), timing (start and end time, action, recovery method), four-segment evidence (display, frames, gateway logs, platform timestamps), and conclusion plus verification time. Point-list changes, wiring photos and written confirmation numbers are attached.
Acceptance often tests only "does the platform have data", while the risk is "will it drop again under the same conditions". Reproduction puts the trigger back exactly: same collection density, branch connections and uplink conditions, matching requests against replies and send against ingest timestamps. Only a match earns "converged"; otherwise "under observation".
What gets saved is repeated meter swaps, parameter changes and site visits, not evidence. Drop the frames and logs, keep only "recovered after restart", and the next incident starts again from the split. Written replies, survey records and reproduction records are the verification basis.
Frequently Asked Questions (FAQ)
Q: A restart fixed it, so is the gateway at fault?
Not by itself. A restart clears the polling queue, buffer state and link occupancy at once, so a poor contact or bus conflict can also vanish. With one meter down, the gateway still served others; log the restart time against the dropout window.
Q: A whole batch has no data; should the gateway be replaced?
Take evidence in three places first. Polling logs without replies point to the Segment 2 trunk; send records without ingest to the Segment 4 uplink; repeated reconnects or supply sag to Segment 3. A batch outage is not a gateway hardware failure, so write down which segment lost evidence before swapping equipment.
Q: Only end-of-line meters are intermittent; will termination fix it?
Possibly, but confirm a link problem first. A far-end location, long branches, failures under dense polling, normal request frames and failing reply checksums point to signal integrity. An abnormal display or duplicate addresses come first. Termination and grounding follow the manual and site survey; no resistance or distance values are given.
Q: The dropout is regular, so is a longer collection cycle enough?
A longer cycle changes the trigger and may hide loading or contention. Find the common action first: adding meters, denser collection or a commissioning tool reading in parallel. Record the action and time window, check loading and the polling schedule against the manual, then reproduce under the same conditions.
Q: Backfilled data is bunched on the platform; is that a recurrence?
No. Backfill stored by arrival time shows one dense block of points, an ingest-timestamp convention issue. Comparing gateway send with platform ingest timestamps separates "data arrived late" from "dropped again". Only the latter returns to the four-segment chain.
Scope and limitations
This article diagnoses periodic dropouts in automatic meter reading, for troubleshooting built systems in parks, buildings and distribution rooms. It does not replace engineering design, current standards, communication surveys or product manuals. The decision tree, four-segment chain, timing criteria and ledger are engineering-method summaries with no commitment to any model's loading, polling, buffer, interface or recovery performance. No fixed numbers are given for baud rate, node limits, timeouts, termination resistance, signal thresholds, collection cycles or bandwidth; no standard clause numbers or error limits are cited. Parameters follow current versions, nameplates, selection manuals, site surveys and the vendor's written reply. Cross-brand protocol byte-order and point-list diagnosis, greenfield parsing, network-mode selection, legacy retrofit planning and reading reconciliation are covered separately. FEXLINK ESX edge gateway, CW industrial gateway, and FEXCloud IoT cloud platform are enterprise-disclosed lineage positions for role comparison only. The example is anonymized and constructed, representing no real customer or project. All deliverables remain DRAFT_PENDING_REVIEW and require independent review; the generator does not self-approve.
Frequently Asked Questions
Meter Data Keeps Dropping Offline
When meter data keeps dropping offline, do not restart the gateway first