 FEXLINK Research Institute
The short answer
Automatic meter reading does not equal usable data. A trustworthy meter reading has to pass four gates: collection completeness, rationality check, logic check, and freeze-time alignment. If any gate is missing, the curve can look perfect and still fail settlement and assessment. Treating "the platform has data" as "the data is reliable" and billing on it directly is exactly why field teams distrust energy data.
1. Two different things: "there is a reading" versus "the data is usable"
The dashboard shows live power, the curve is smooth, and the report has a number in every cell — that is "there is a reading." But when month-end comes and you reconcile against the utility bill, or use the numbers to assess a workshop's energy performance, you find jumps in some intervals, a meter stuck on the same value for days, a circuit whose reading doubled, or a meter whose freeze time is off by a few minutes. That "reading" does not survive the settlement gate.
"There is a reading" answers "did the communication link come up." "The data is usable" answers "can this number be trusted, can it be used to bill." Between the two sits the four-gate validation chain.
2. The four-gate pipeline: completeness → rationality → logic → time alignment
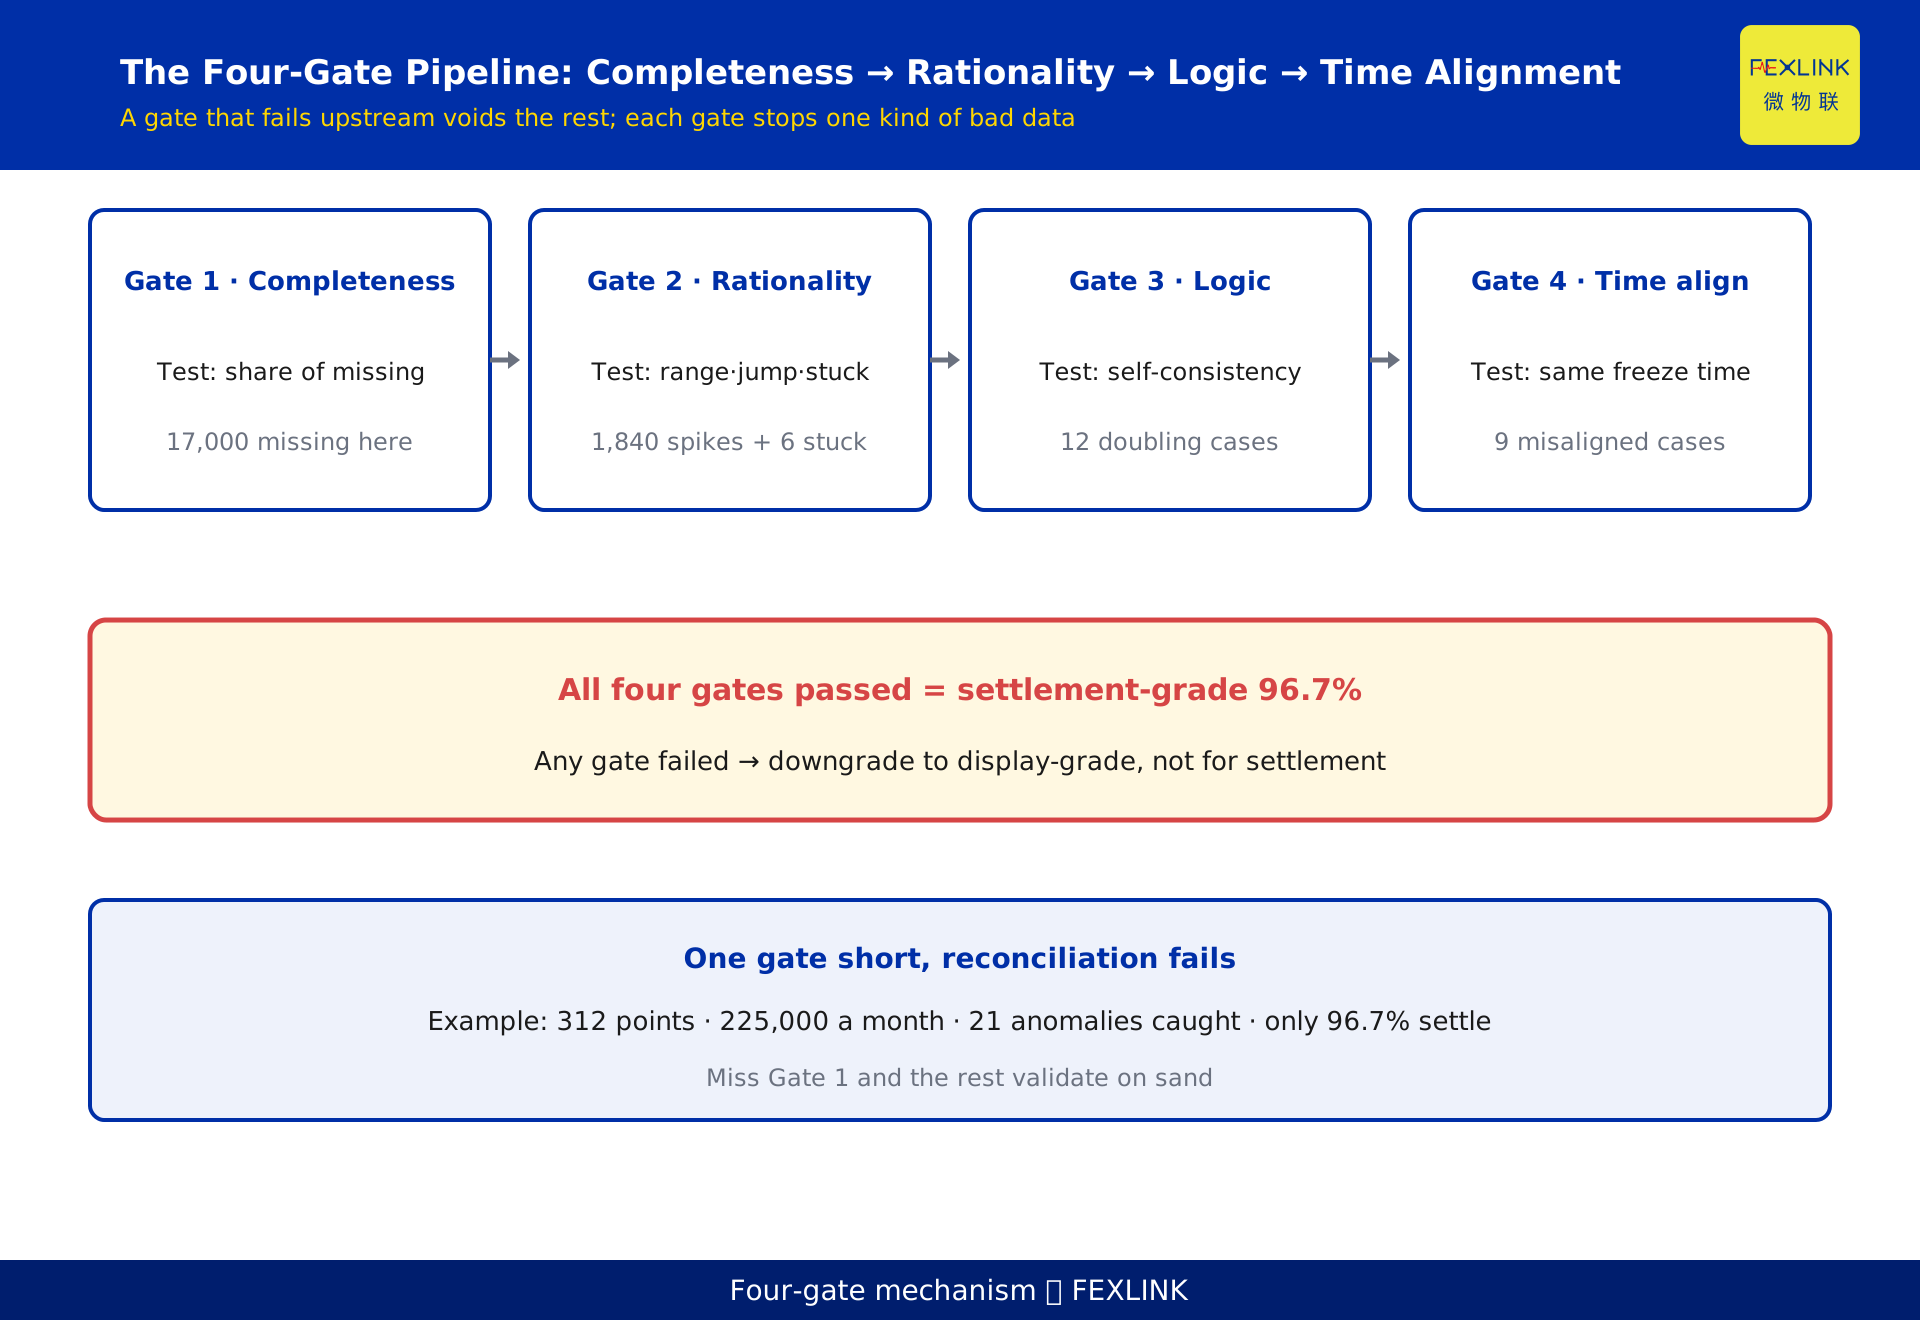
The four gates run as a serial pipeline; a reading that fails an earlier gate never reaches a later one.
Gate 1 Collection completeness. First ask whether every expected reading actually arrived. A campus with a few hundred metered circuits, one reading every 15 minutes, produces a few hundred thousand readings a month. Communication jitter, gateway drops, and meter timeouts all create missing readings. If completeness is below threshold, the curve for that interval is built on a hole to begin with.
Gate 2 Rationality check. Are the received values reasonable? Three classic fake-data shapes surface here: spikes (a reading jumps several times its value and returns within minutes), stuck values (dozens of identical consecutive readings while the meter has in fact stopped), and out-of-range values (voltage or current outside what the equipment can produce). Range, historical band, and rate-of-change rules usually catch these.
Gate 3 Logic check. Values that look fine alone but are inconsistent together are caught here. The most typical is doubling: a circuit's reading suddenly becomes twice its previous value; on its own it is within range, but it contradicts the same hour the day before and the other circuits on the same transformer. Forward/reverse, peak/valley composition, and sub-total-versus-main-meter mismatches all belong to this gate.
Gate 4 Freeze-time alignment. Settlement is not computed from the live curve but from a snapshot taken at a "freeze time." If meters freeze at different instants, the bill assembled from them rests on a misaligned time base, so sub-totals will never equal the main meter. This gate forces every reading that enters settlement to stop on the same second.
3. The most common "fake data": spikes, stuck values, doubling, misalignment
The untrustworthy data seen in the field falls into four types, mapping onto the last three gates:
- Spike: a violent jump between adjacent samples that falls back a few minutes later. Usually a retransmission replaying an old packet, or transient interference. It cannot beat the rate-of-change test at the rationality gate.
- Stuck value: N identical consecutive readings. The meter is still talking to the platform, but its internal metering has stopped, so it keeps echoing the same cached value. This is the classic "reading present, metering absent."
- Doubling: the reading doubles overall. Commonly the current-transformer ratio does not match the meter's internal setting — the same current read through two ratios differs by a factor of two, and nothing raises an alarm.
- Misalignment: the reading itself is correct, but its timestamp or freeze time does not line up with the others, so the set is no longer a same-instant cross-section. It slips past the first three gates and only shows up at Gate 4.
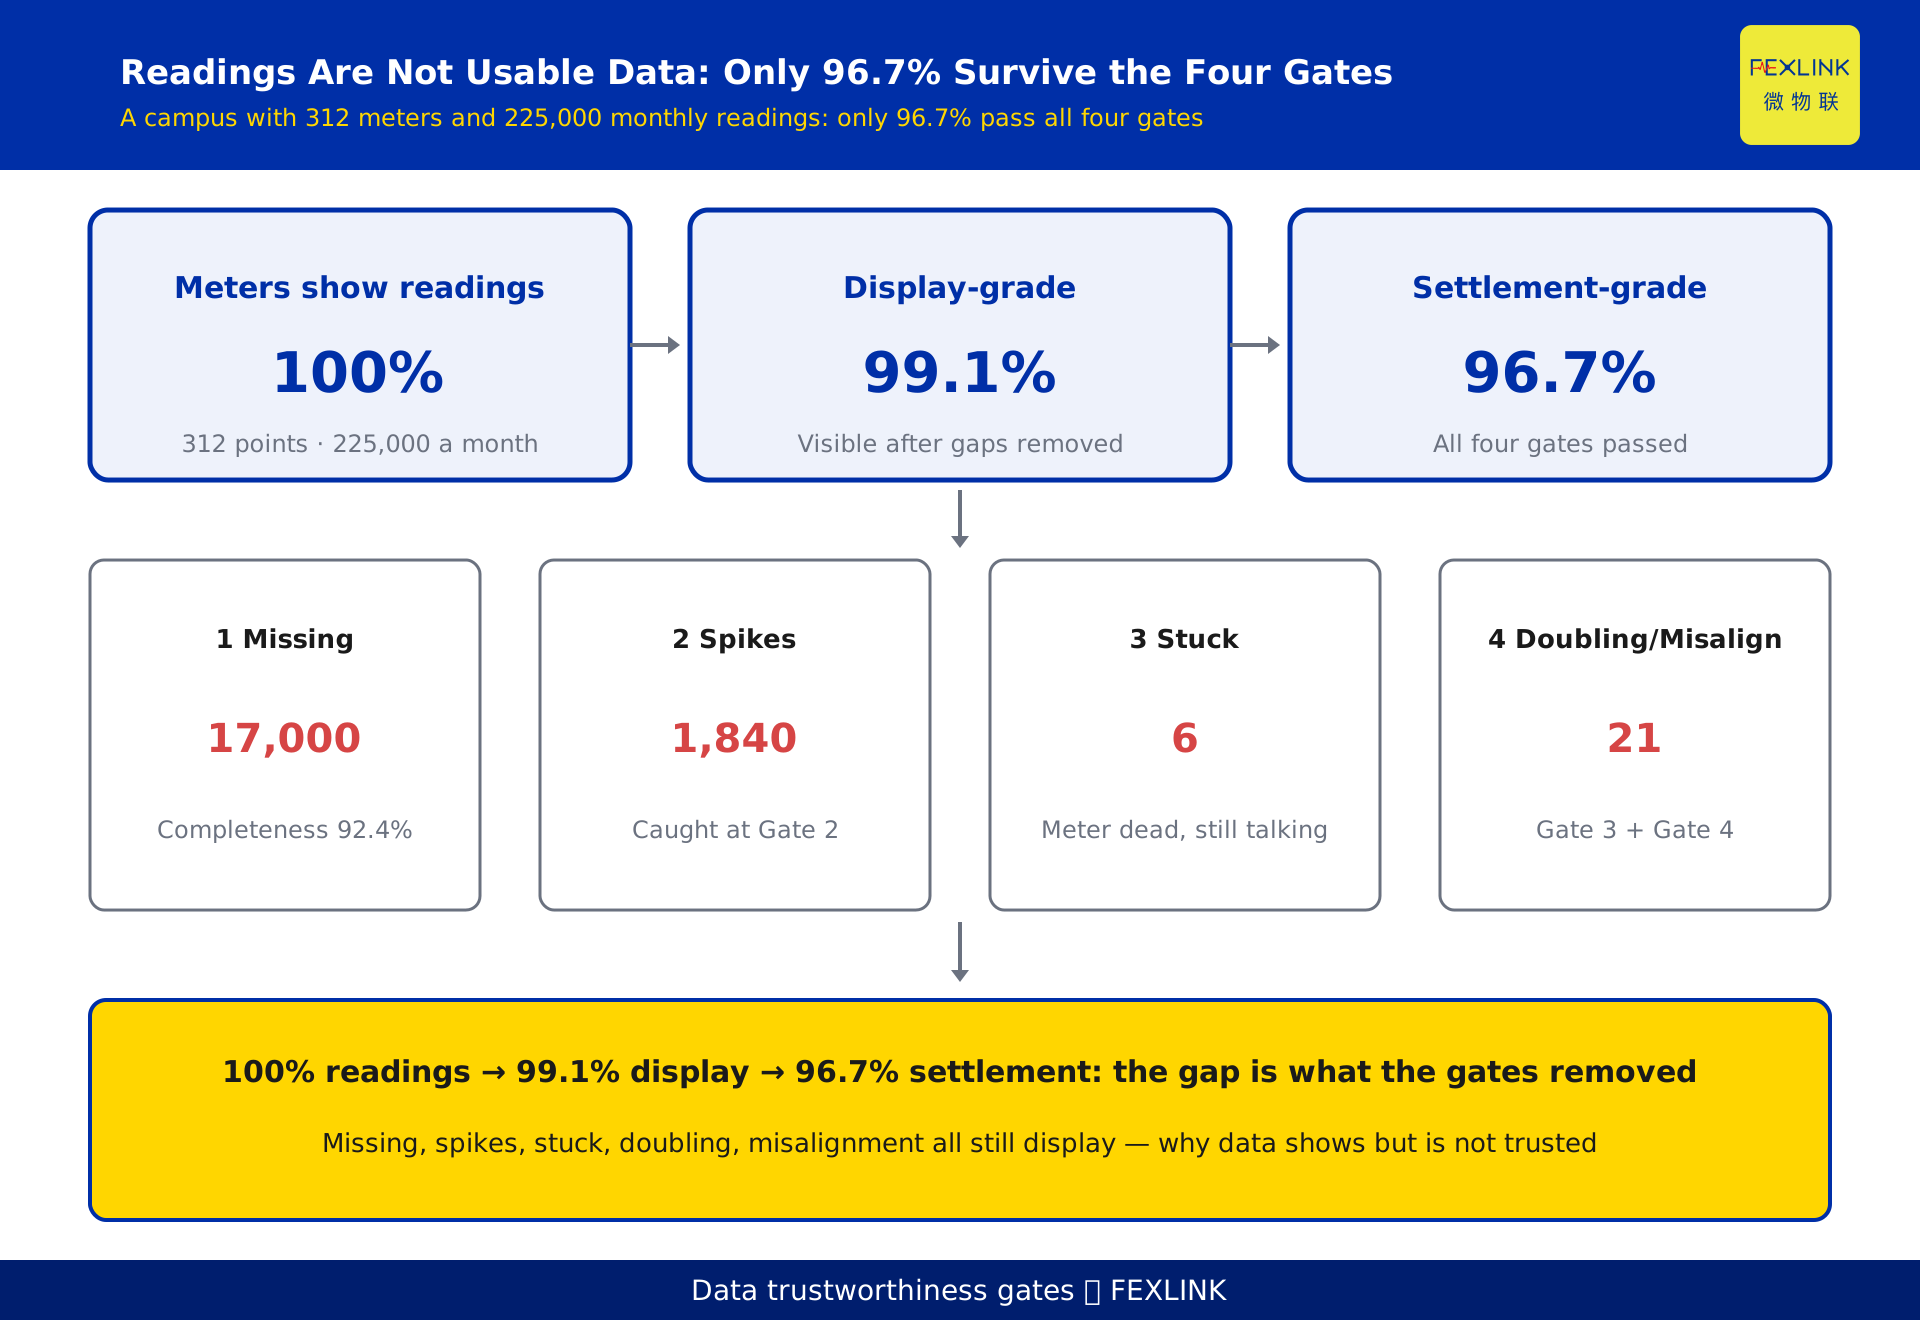
(Illustrative: a campus with 312 collection points and about 225,000 readings a month, where the four gates intercepted 17,000 missing, 1,840 spikes, 6 stuck segments, 12 doubling cases, and 9 misaligned, 21 in total. The figures are constructed and represent no real customer.)
4. Why "interpolation" cannot rescue settlement data
Facing gaps, the easiest fix is interpolation: fill the missing lines with the neighbor average and the curve looks continuous. That is fine for "display" — for trend and peak watching, the eye cannot tell.
But settlement cannot use interpolation. The reason lies in what settlement is: it compares the one reading at the freeze instant, not how much the curve resembles the truth. Replacing a missing point with an estimate swaps "what was actually received" for "what you guessed," and that guess never went through the four gates — it was never rationality-checked, never logic-checked, and never sat at the correct freeze time. Take it to reconciliation, and the moment it differs from the utility bill by a few kilowatt-hours, you have no "real reading at that instant" to push back with, so the settlement collapses.
Interpolation repairs the display layer, not the settlement layer. Settlement data needs the gap intercepted at Gate 1, with re-collection or local-cache replay to recover the real reading — not an estimate.
5. Grade the data: display-grade versus settlement-grade
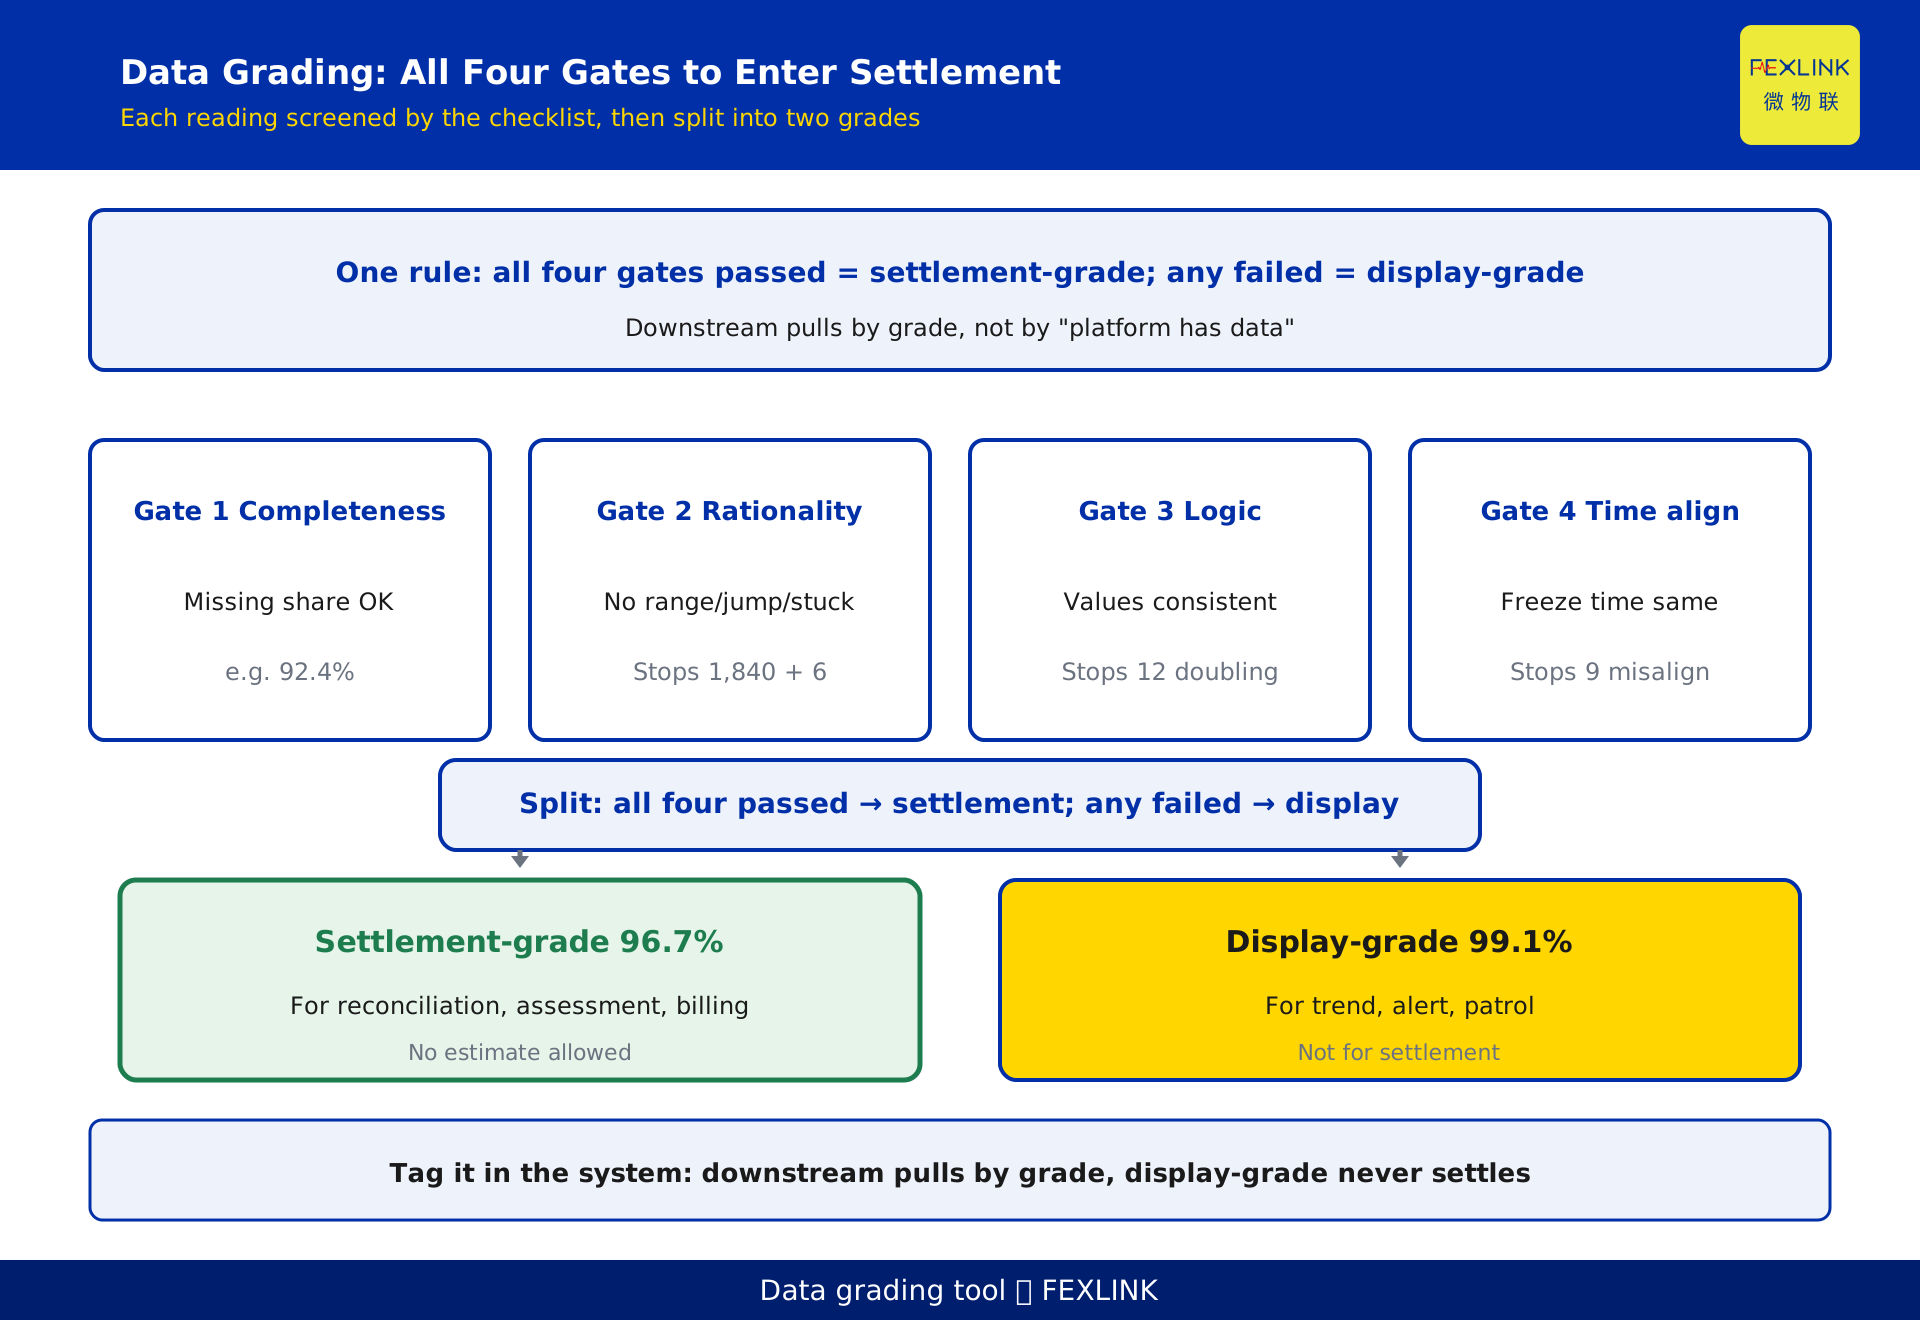
Instead of agonizing over "is this number true," grade it first. Two grades are recommended:
- Display-grade: passes completeness and rationality; the curve can be drawn and the trend watched, for monitoring walls, operations patrol, and anomaly alerts. It tolerates a little interpolation and a few points awaiting review.
- Settlement-grade: all four gates passed, freeze times aligned, values self-consistent; it can enter reconciliation, energy assessment, and billing. Not a single point at this grade may be an estimate.
The two grades are not "true versus false" but "purpose." Using display-grade data for settlement is the source of nine out of ten energy-data disputes; using settlement-grade data only to draw a wall chart is waste. The key: tag every reading with its grade in the system, and let downstream applications pull by grade instead of treating "the platform has data" as a pass.
(Illustrative: of the same 225,000 readings, about 99.1% can be displayed after gaps and obvious anomalies are removed; after also dropping those that did not clear all four gates, about 96.7% can be settled. Figures are constructed examples.)
6. An illustrative scenario: how much screening one campus month actually gets
The following scenario is constructed to show how the four gates operate and represents no real customer or project.
A campus deployed 312 metered circuits, sampled every 15 minutes, producing about 225,000 readings a month. Before month-end energy settlement, the data passes the gates in order:
Gate 1, completeness 92.4%: about 17,000 readings went missing when the gateway briefly went offline; the system flagged the interval incomplete, triggered edge-side local-cache replay, recovered most of them, and let the remainder go to pending review.
Gate 2, rationality check intercepted 1,840 spikes and 6 stuck segments — the latter from three meters whose internal metering had stopped yet still communicated, so the platform showed "normal" while the readings were already frozen.
Gate 3, logic check found 12 doubling cases, traced to a current-transformer ratio that did not match the meter's internal setting, so the same current was read as twice its value.
Gate 4, freeze-time alignment found 9 misaligned cases; some meters froze a few minutes off, making sub-totals disagree with the main meter.
After all four gates, about 96.7% of readings reached settlement-grade; the rest stayed at display-grade or went to manual review and re-collection. This campus is only an example, but the "pretty curve, unreconciled bill" contradiction almost always traces to one of these four gates left open.
7. How the edge holds Gate 1: local cache and resumable transfer
Of the four gates, Gate 1 (completeness) usually fails at the communication layer, not the meter. The gateway drops, the readings gap; by the time the network returns, that stretch is already past.
Holding Gate 1 relies on "drop-resistance" at the edge. An edge gateway with local cache stores readings locally when communication breaks, then auto-replays them on recovery (resumable transfer), filling the gap. Even a brief cloud outage then cannot sink completeness. An industrial gateway does the same collection-and-cache job on harsher field buses such as RS485/Modbus, ensuring every frame on the bus eventually lands on the platform.
Do this step solidly and the later three gates get clean input; miss Gate 1 and everything downstream is built on sand.
8. What the Taiyi control hub L2 cleaning layer does
The four gates are not checked by hand one by one; a cleaning layer runs them automatically. The L2 cleaning layer of the Taiyi intelligent control hub system (G5 four-level cleaning) engineers the four gates into a pipeline — completeness statistics, rationality rules, logic comparison, freeze-time alignment — so every reading is auto-screened and auto-tagged with a grade.
Its value is not "one more feature" but turning "is the data trustworthy" into a queryable, traceable system action: which batch stuck at which gate, why downgraded, when re-collected — all recorded. Downstream reconciliation, assessment, and billing modules pull by tag, so display-grade data is never misused as settlement-grade.
9. Four practical recommendations for energy managers
- Ask about completeness before trusting the curve. Before reading any energy curve, check that interval's collection completeness. Below an acceptable level, the smoothest curve is still display-grade and cannot be used for assessment directly.
- Freeze times must be unified. All meters entering settlement must freeze on the same second. This is the hard test of Gate 4 — one misaligned meter and sub-totals will never match the main meter.
- For doubling, check the ratio first. When a circuit's reading doubles overall, the first move is to check whether the current-transformer ratio matches the meter's internal setting, not to suspect a broken meter. This is the highest-frequency intercept at Gate 3.
- Tag the data with grades. Distinguish display-grade from settlement-grade in the system, and let applications pull by grade. The rule is simple: all four gates passed equals settlement-grade; any gate failed equals display-grade (with a pending-review flag).
FAQ
Q: The platform shows data, so why say it is not trustworthy?
Because a reading only proves the link came up, not that the number passed validation. Missing, spikes, stuck, doubling, and misalignment all still display, yet none clears the four gates and none can be used for settlement directly.
Q: Interpolation fills the gap, so isn't the curve complete?
Good enough for display, not for settlement. Settlement compares the one real reading at the freeze instant; interpolation is an estimate that never cleared the four gates, so it cannot stand up to reconciliation. Gaps should be recovered by re-collection or edge-cache replay to get the real reading.
Q: Which is more dangerous, spikes or stuck values?
Stuck values are more hidden and more dangerous. A spike is obvious at a glance; a stuck value keeps the meter talking and the platform receiving while internal metering has stopped, endlessly echoing the same cached value — "reading present, metering absent" — and is the easiest to let through as normal.
Q: Does a few minutes of freeze-time difference really matter?
Not for display, but it does for settlement. Settlement assembles a same-instant cross-section; if meters freeze at different times, sub-totals will inevitably disagree with the main meter. Gate 4 is exactly what forces every settlement reading to stop on the same second.
Q: Our gateway drops often; must we just accept missing data?
No. An edge gateway with local cache stores readings while offline and auto-replays them on recovery, filling the gap and protecting completeness. That is the key to holding Gate 1 and avoiding the later three gates being validated on sand.
Scope and limitations
- The four data-validation gates discussed here (collection completeness, rationality check, logic check, freeze-time alignment) apply to automatic-meter-reading based energy data collection and settlement; manual reading or purely offline ledgers are out of scope.
- The four gates are a methodology framework for grading data trustworthiness and constitute no industry standard or mandatory specification; each enterprise may configure its own validation rules and thresholds, and the example thresholds herein are illustrative only, not standard provisions.
- The illustrative scenario (a campus, 312 collection points, about 225,000 readings per month, 92.4% completeness, 17,000 missing, 1,840 spikes, 6 stuck, 12 doubling, 9 misaligned, 21 in total, 99.1% display, 96.7% settlement, etc.) is constructed to show how the gates operate and represents no real customer, site, or project; actual data volumes and intercept counts require on-site measurement.
- The specific models, interfaces, and parameters of the local-cache edge gateway, the industrial gateway, and the Taiyi intelligent control hub L2 cleaning layer (G5 four-level cleaning) follow the latest product knowledge base and selection manual; this article is not a selection or procurement recommendation.
- This article cites no clause numbers or fixed error limits from any energy-efficiency or metering standard; where quantitative conclusions need to be checked against a standard, use the current effective version and verify separately.
Frequently Asked Questions
The platform shows data, so why say it is not trustworthy?
Because a reading only proves the link came up, not that the number passed validation. Missing, spikes, stuck, doubling, and misalignment all still display, yet none clears the four gates and none can be used for settlement directly.
Interpolation fills the gap, so isn't the curve complete?
Good enough for display, not for settlement. Settlement compares the one real reading at the freeze instant; interpolation is an estimate that never cleared the four gates, so it cannot stand up to reconciliation. Gaps should be recovered by re-collection or edge-cache replay to get the real reading.
Which is more dangerous, spikes or stuck values?
Stuck values are more hidden and more dangerous. A spike is obvious at a glance; a stuck value keeps the meter talking and the platform receiving while internal metering has stopped, endlessly echoing the same cached value — "reading present, metering absent" — and is the easiest to let through as normal.
Does a few minutes of freeze-time difference really matter?
Not for display, but it does for settlement. Settlement assembles a same-instant cross-section; if meters freeze at different times, sub-totals will inevitably disagree with the main meter. Gate 4 is exactly what forces every settlement reading to stop on the same second.
Our gateway drops often; must we just accept missing data?
No. An edge gateway with local cache stores readings while offline and auto-replays them on recovery, filling the gap and protecting completeness. That is the key to holding Gate 1 and avoiding the later three gates being validated on sand.