 FEXLINK Research Institute
The short answer
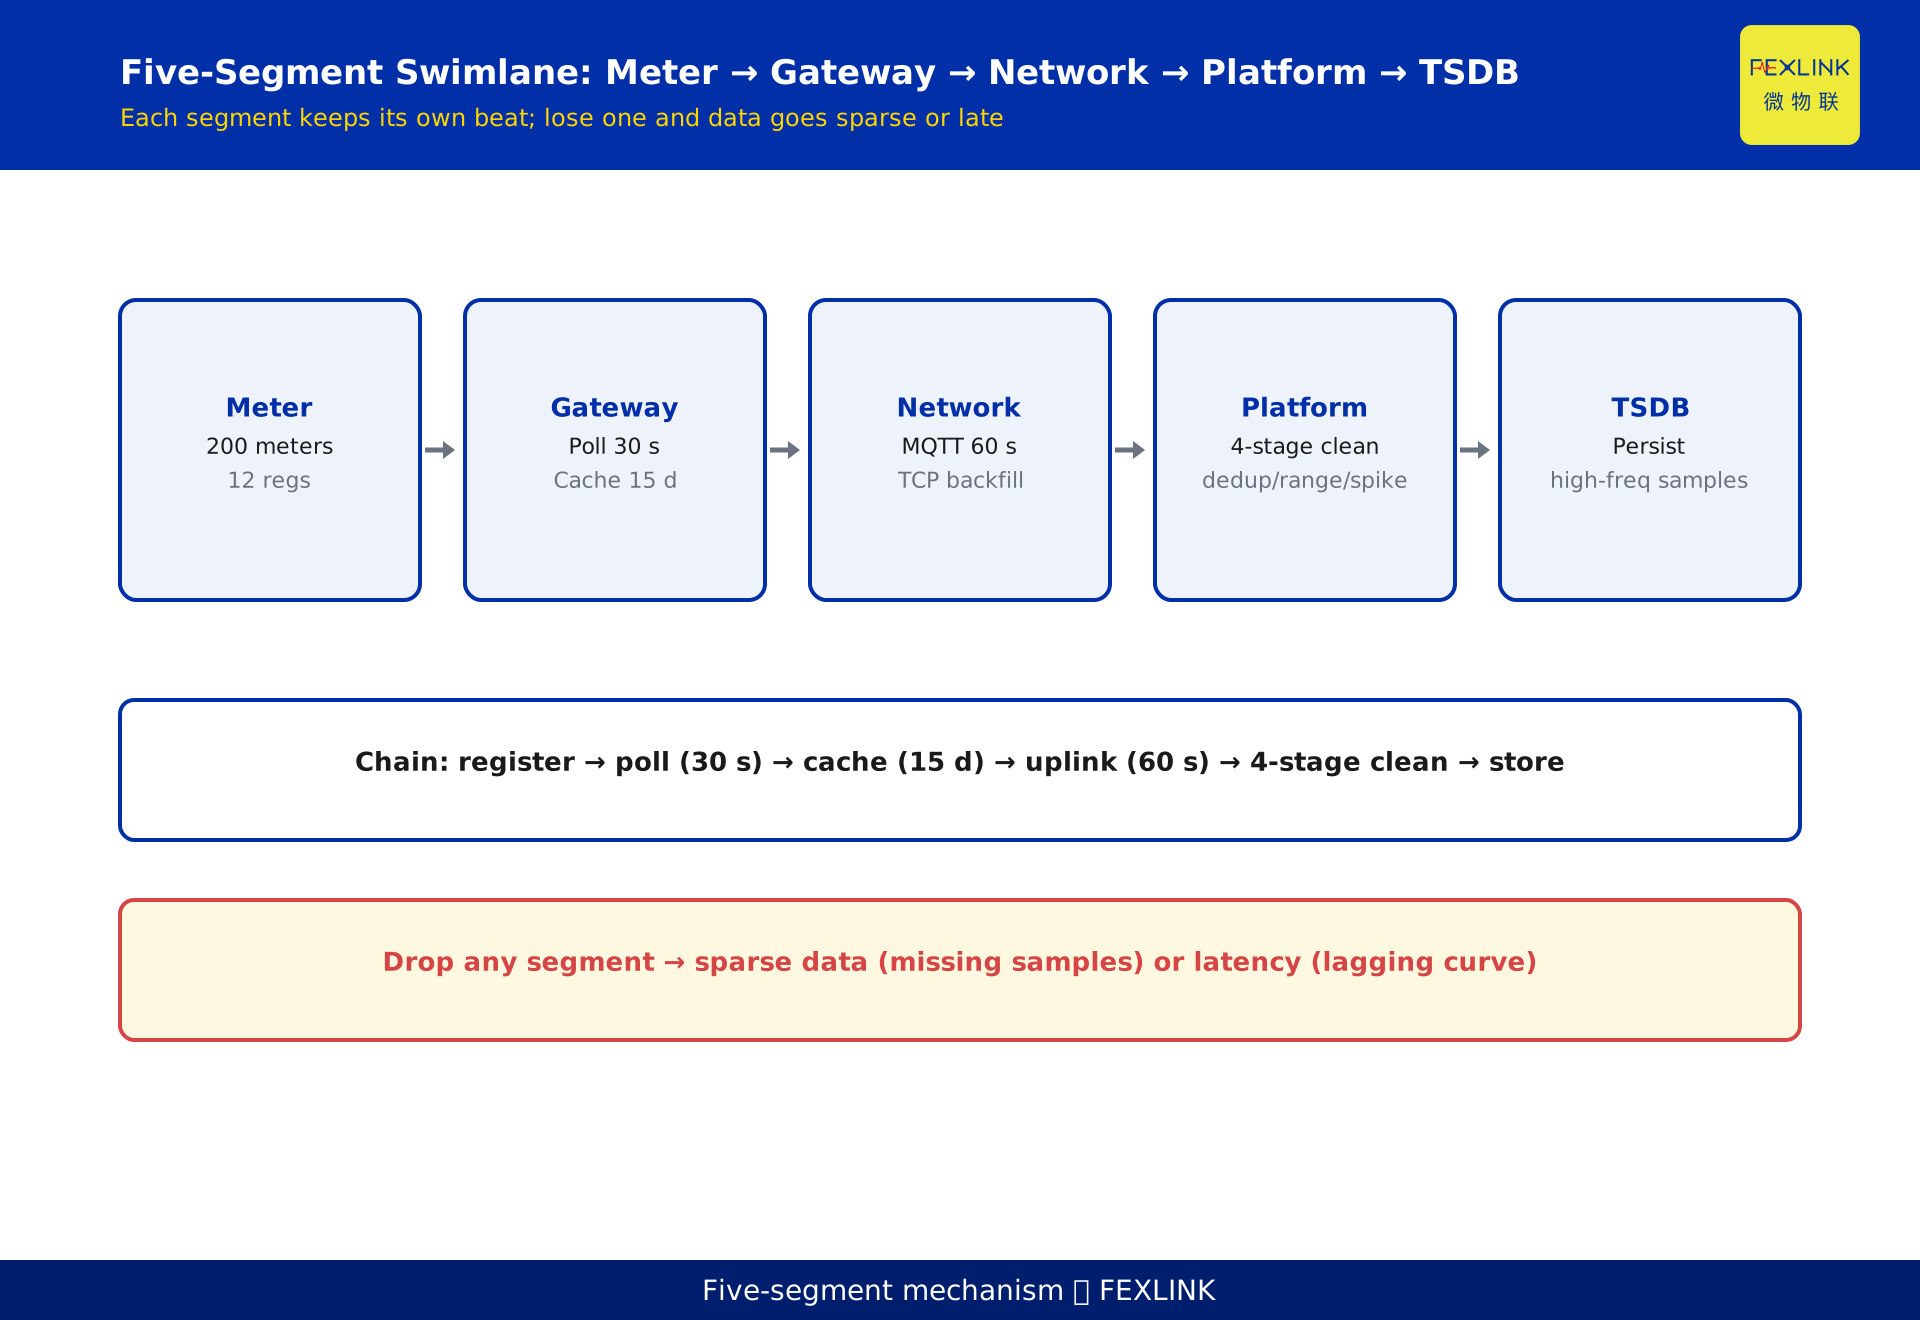
One auto read is not "the meter sends its value up." It is an end-to-end timing chain: the edge gateway polls each meter's registers on a point table → caches the result locally on a cycle → resumes after a network outage → packs and sends it over MQTT/TCP → the platform runs four-stage cleaning → the time-series database persists it. Drop or fail any link and the platform shows not wrong numbers but sparse data (missing samples) or latency (lagging curves). This article gives the cadence and typical durations of every stage, plus an end-to-end worst-case budget of about 2 minutes.
1. Five physical segments: meter, gateway, network, platform, database
An automatic meter reading (AMR) link has five physical segments: (1) the metering device at the front — an energy, water or gas meter whose internals are addressable registers; (2) the edge gateway that collects; (3) the communication network that carries data out; (4) the IoT platform that receives and processes; (5) the time-series database (TSDB) that stores high-frequency samples.
Many engineers watch only the meter and the platform, treating polling, local caching, the uplink protocol and platform cleaning as a black box. When the platform curve misbehaves, the fault is almost never the meter or the platform — it sits in the three middle segments, which are also the hardest to localize.
2. How the gateway asks the meter: point table, poll interval, timeout
The gateway does not passively receive; it actively asks. It holds a point table: each meter's communication address, which registers to read (holding or input registers), and each register's meaning and unit. Guided by this table, the gateway polls every meter on a cycle.
The poll interval is the basic beat of the chain. In the worked example it is 30 seconds: each meter is asked once every 30 seconds. A shorter interval means fresher data but heavier load on the gateway and the network. Engineering practice sizes it at one-third to one-fifth of the data point's change period; slow variables like water, gas and electricity commonly use 30 seconds to a few minutes.
Each read has a timeout — the window to wait for a reply after sending the request, typically 1 to 3 seconds. On timeout the meter is marked failed for that round and retried next round.
3. How long one round takes: the composition of poll latency
A single meter's read time has three parts: (1) link setup and address resolution; (2) the bytes read from registers (reading 12 holding registers is a few tens of bytes); (3) the round-trip time of the frame on the bus.
On an RS485 bus a register read takes a few milliseconds. In the worked example, 200 meters each read for 12 registers are traversed in about 8 seconds — that is the whole round, not one meter, because the bus is polled sequentially but each meter occupies only milliseconds.
The criterion is clear: if a meter on the platform is "on and off," suspect the poll timeout and failure count first, not the meter itself — usually bus interference or an address clash.
4. Why cache locally for at least 15 days: resume after outage
The gateway must not "send as soon as it reads," because the network drops. Correctly, the gateway first writes the round's data to local storage (SQLite or files), then tries to send; on success it marks the sample synced, on failure it stays local.
How long the local cache is kept decides whether data can be recovered after an outage. Engineering requires at least 15 days: even if the site network is down for two weeks, the gateway can still backfill every sample once it returns, and the platform shows no hole. This is breakpoint resume — not restarting from the break, but continuing from the last acknowledged point.
Criterion: a cache window below 15 days guarantees lost data after a long outage, seen as a gap in the platform curve.
5. MQTT or TCP uplink: what each solves
The uplink — carrying gateway data to the platform — commonly uses two transports:
MQTT is publish/subscribe, with small frames suited to low-bandwidth, unstable networks (4G, plant Wi-Fi); it reconnects automatically and supports offline messages. It solves "get the data out steadily over a bad network."
A TCP long connection (custom binary protocol, HTTP) has high throughput, suited to bulk backfill and latency-sensitive cases. It solves "push a large volume of history up fast."
In the worked example the gateway normally publishes over MQTT every 60 seconds; after recovery it switches to the TCP channel for the bulk backfill. They are not either/or but complementary.
6. Four-stage platform cleaning: the gates before persistence
Data reaching the platform must not enter the store raw; it passes cleaning. Taking the FEXCloud IoT platform as an example, the typical four stages are:
- Deduplication — keep one packet per sample point per timestamp.
- Range check — reject readings outside the sensor's valid range (negative current, over-limit voltage).
- Spike filter — drop adjacent samples that jump beyond threshold with no explainable operating condition.
- Unit normalization — unify raw units from different meters and protocols into platform standards (kW, kWh).
Skip these gates and the store holds dirty or incomparable data. The seven-stage pipeline of the Taiyi control hub adds three business-validation stages on top of the four — a strengthened version of the same idea.
7. The end-to-end timing chain of one read
Stringing the segments together, one read's end-to-end timing is:
At t0 the gateway polls meter A's registers per the point table → writes to local cache → at the uplink cycle (every 60 seconds) packs and sends over MQTT → the platform receives and runs four-stage cleaning → on pass, writes to the TSDB.
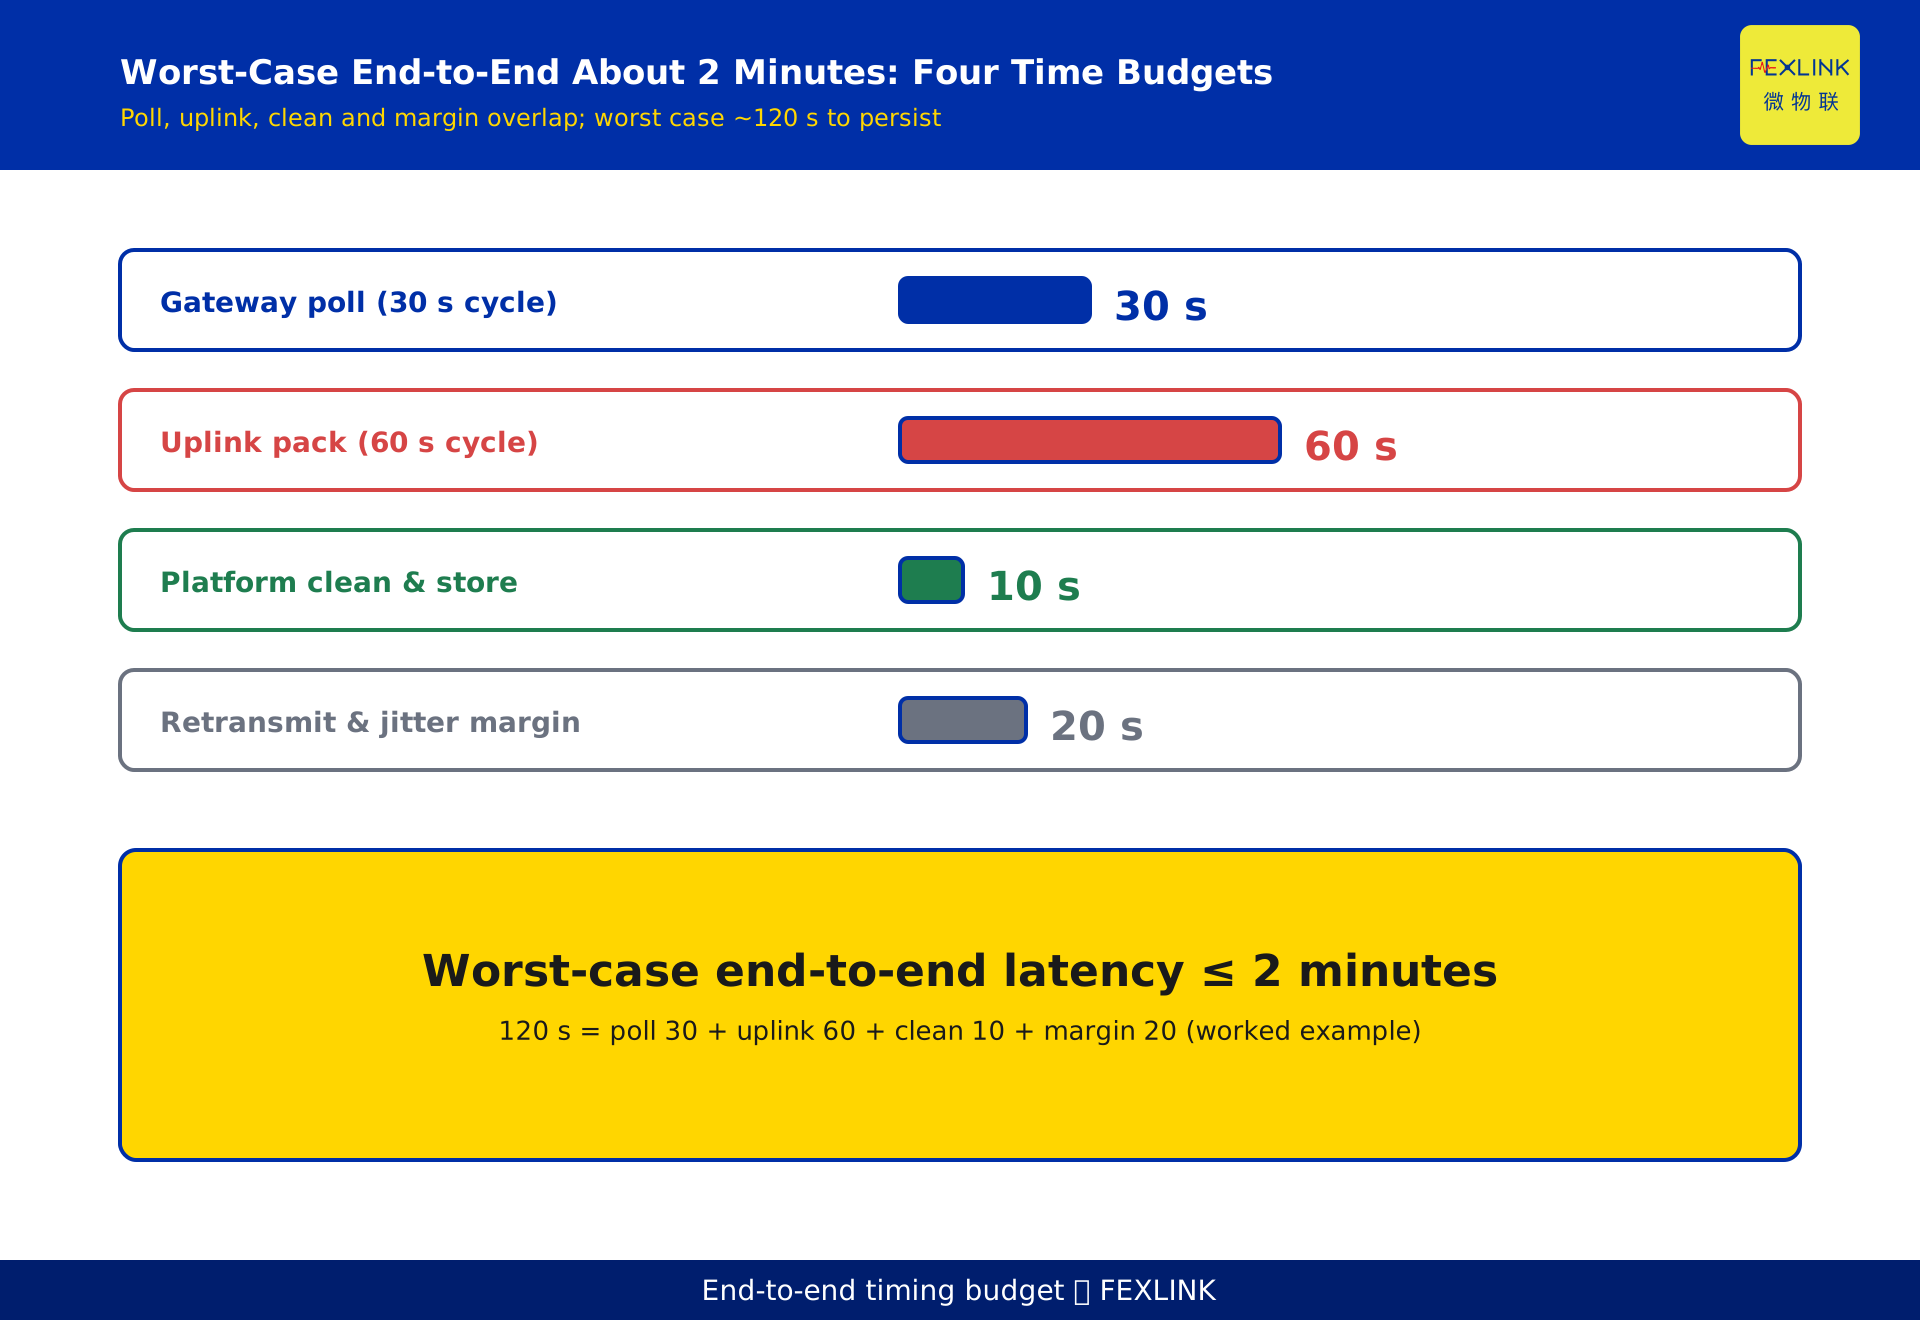
The chain is a pipeline: polling, caching, uplink and cleaning overlap. So "worst-case end-to-end latency" is not the sum of stages but roughly "poll interval + uplink interval + clean-and-store time + jitter margin."
8. A worked example: a 200-meter site closed in about 2 minutes
The following is a constructed example to show the timing mechanism; it represents no real customer:
A site deploys 200 meters. The gateway is an ESX-0223-GR edge gateway polling on a point table: poll interval 30 seconds, 12 registers per meter, about 8 seconds per whole round; local cache kept 15 days with breakpoint resume; MQTT uplink every 60 seconds; the FEXCloud platform runs four-stage cleaning before the TSDB; the Taiyi seven-stage hub adds business validation.
Worst-case end-to-end budget: poll 30 seconds + uplink 60 seconds + platform clean and store 10 seconds + retransmit and jitter margin 20 seconds ≈ 120 seconds, about 2 minutes. In other words, after a field sample changes, it appears on the platform curve in at worst about 2 minutes.
9. Localizing a fault: which segment broke
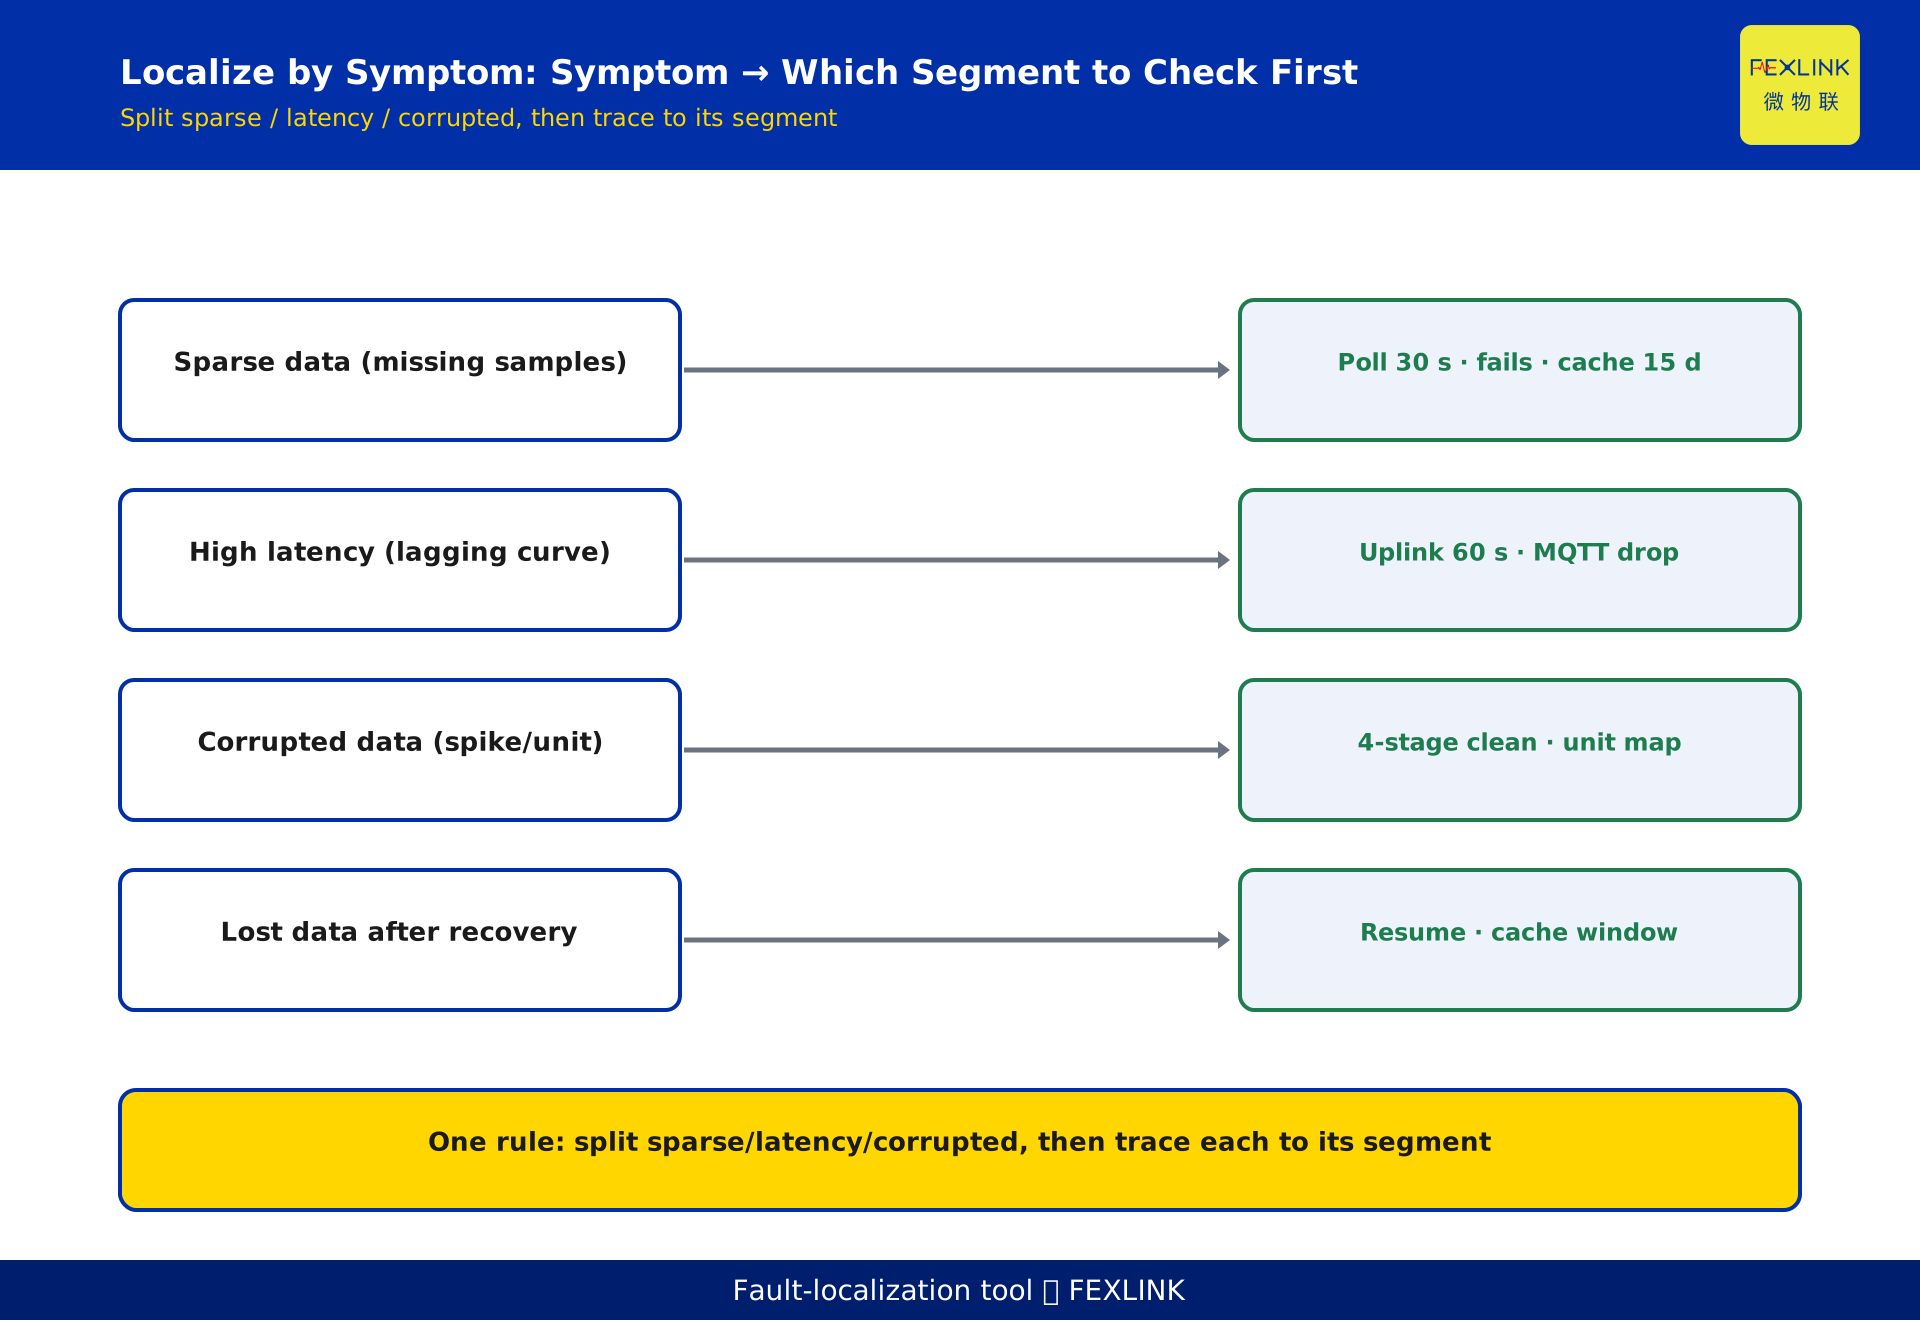
When the platform curve misbehaves, work backward from the symptom:
- Sparse data (missing samples, gaps): check the poll interval and failure count, bus interference, and whether the local cache window reaches 15 days.
- High latency (curve lags overall): check the uplink interval (still 60 seconds?), network quality, and whether MQTT drops often.
- Corrupted data (jumps, wrong units): check whether four-stage cleaning is active and whether the point-table unit mapping is wrong.
- Lost data after recovery: check breakpoint resume and the cache window.
One-line criterion: first split into sparse / latency / corrupted, then trace each to its segment — do not start by blaming the meter or the platform.
10. How it lands on products
On the device side, collection uses the ESX-0223-GR edge gateway: it polls on the point table, caches locally with breakpoint resume, and sends over MQTT — covering the first four segments (poll, cache, resume, uplink). For harsher industrial sites needing tougher enclosure temperature and interfaces, the CW-C2 industrial gateway takes the same collection and uplink role. The platform side is handled by the FEXCloud IoT platform for four-stage cleaning and persistence; the upper layer uses the Taiyi seven-stage hub for business validation. Together they form the traceable chain from register to persisted row.
FAQ
Q: How short should the poll interval be?
No universal answer; size it at one-third to one-fifth of the data point's change period. Slow variables like water, gas and electricity commonly use 30 seconds to a few minutes. Too short loads the gateway and network; too long makes data stale and slows fault discovery.
Q: After the network recovers, why is a stretch of data still missing on the platform?
Usually the local cache window is under 15 days, or breakpoint resume is not working. If the outage exceeds the cache retention, that stretch of samples can never be backfilled and the curve shows a gap.
Q: Must I choose between MQTT and TCP?
No. MQTT suits steady uplink over bad networks; TCP suits bulk backfill. The typical pattern is periodic MQTT reporting normally and a TCP bulk backfill after recovery — they divide the labor.
Q: The platform value differs from the meter display — who is wrong?
Check the four-stage cleaning and the point-table unit mapping first. A misconfigured dedupe, range, spike or unit step will skew the persisted value away from the meter. The meter itself fails less often than the configuration does.
Q: What is the difference between four-stage cleaning and the seven-stage pipeline?
Four-stage cleaning is the platform's general data-quality gate before persistence (dedupe, range, spike, unit). The seven-stage pipeline of the Taiyi hub stacks three more business-validation stages on top, aimed at business correctness — a strengthened version of the same idea.
Scope and limitations
- This article addresses the end-to-end timing of automatic meter reading (AMR), applicable to energy, water and gas meters that are register-addressable and polled uplink by an edge gateway.
- The poll interval of 30 seconds, cache of 15 days, uplink of 60 seconds, end-to-end about 2 minutes, 200 meters, and 12 registers per meter are all constructed examples to illustrate the timing mechanism; they represent no real customer or project, and actual values must be set from site survey and device capability.
- Four-stage cleaning is a typical implementation example of the FEXCloud IoT platform; the seven-stage pipeline describes the Taiyi control hub. Other platforms may differ in cleaning stages and TSDB choice — refer to the actual product documentation.
- This article cites no mandatory national or industry standard with quantitative thresholds; parameters such as poll, timeout and cache are customizable and should not be treated as fixed acceptance specs.
- The interfaces, enclosure temperature and communication capability of the ESX-0223-GR edge gateway and the CW-C2 industrial gateway follow the latest selection manual and product knowledge base; this article is not a selection or procurement recommendation.
Frequently Asked Questions
How short should the poll interval be?
No universal answer; size it at one-third to one-fifth of the data point's change period. Slow variables like water, gas and electricity commonly use 30 seconds to a few minutes. Too short loads the gateway and network; too long makes data stale and slows fault discovery.
After the network recovers, why is a stretch of data still missing on the platform?
Usually the local cache window is under 15 days, or breakpoint resume is not working. If the outage exceeds the cache retention, that stretch of samples can never be backfilled and the curve shows a gap.
Must I choose between MQTT and TCP?
No. MQTT suits steady uplink over bad networks; TCP suits bulk backfill. The typical pattern is periodic MQTT reporting normally and a TCP bulk backfill after recovery — they divide the labor.
The platform value differs from the meter display — who is wrong?
Check the four-stage cleaning and the point-table unit mapping first. A misconfigured dedupe, range, spike or unit step will skew the persisted value away from the meter. The meter itself fails less often than the configuration does.
What is the difference between four-stage cleaning and the seven-stage pipeline?
Four-stage cleaning is the platform's general data-quality gate before persistence (dedupe, range, spike, unit). The seven-stage pipeline of the Taiyi hub stacks three more business-validation stages on top, aimed at business correctness — a strengthened version of the same idea.