 FEXLINK Research Institute
The short answer
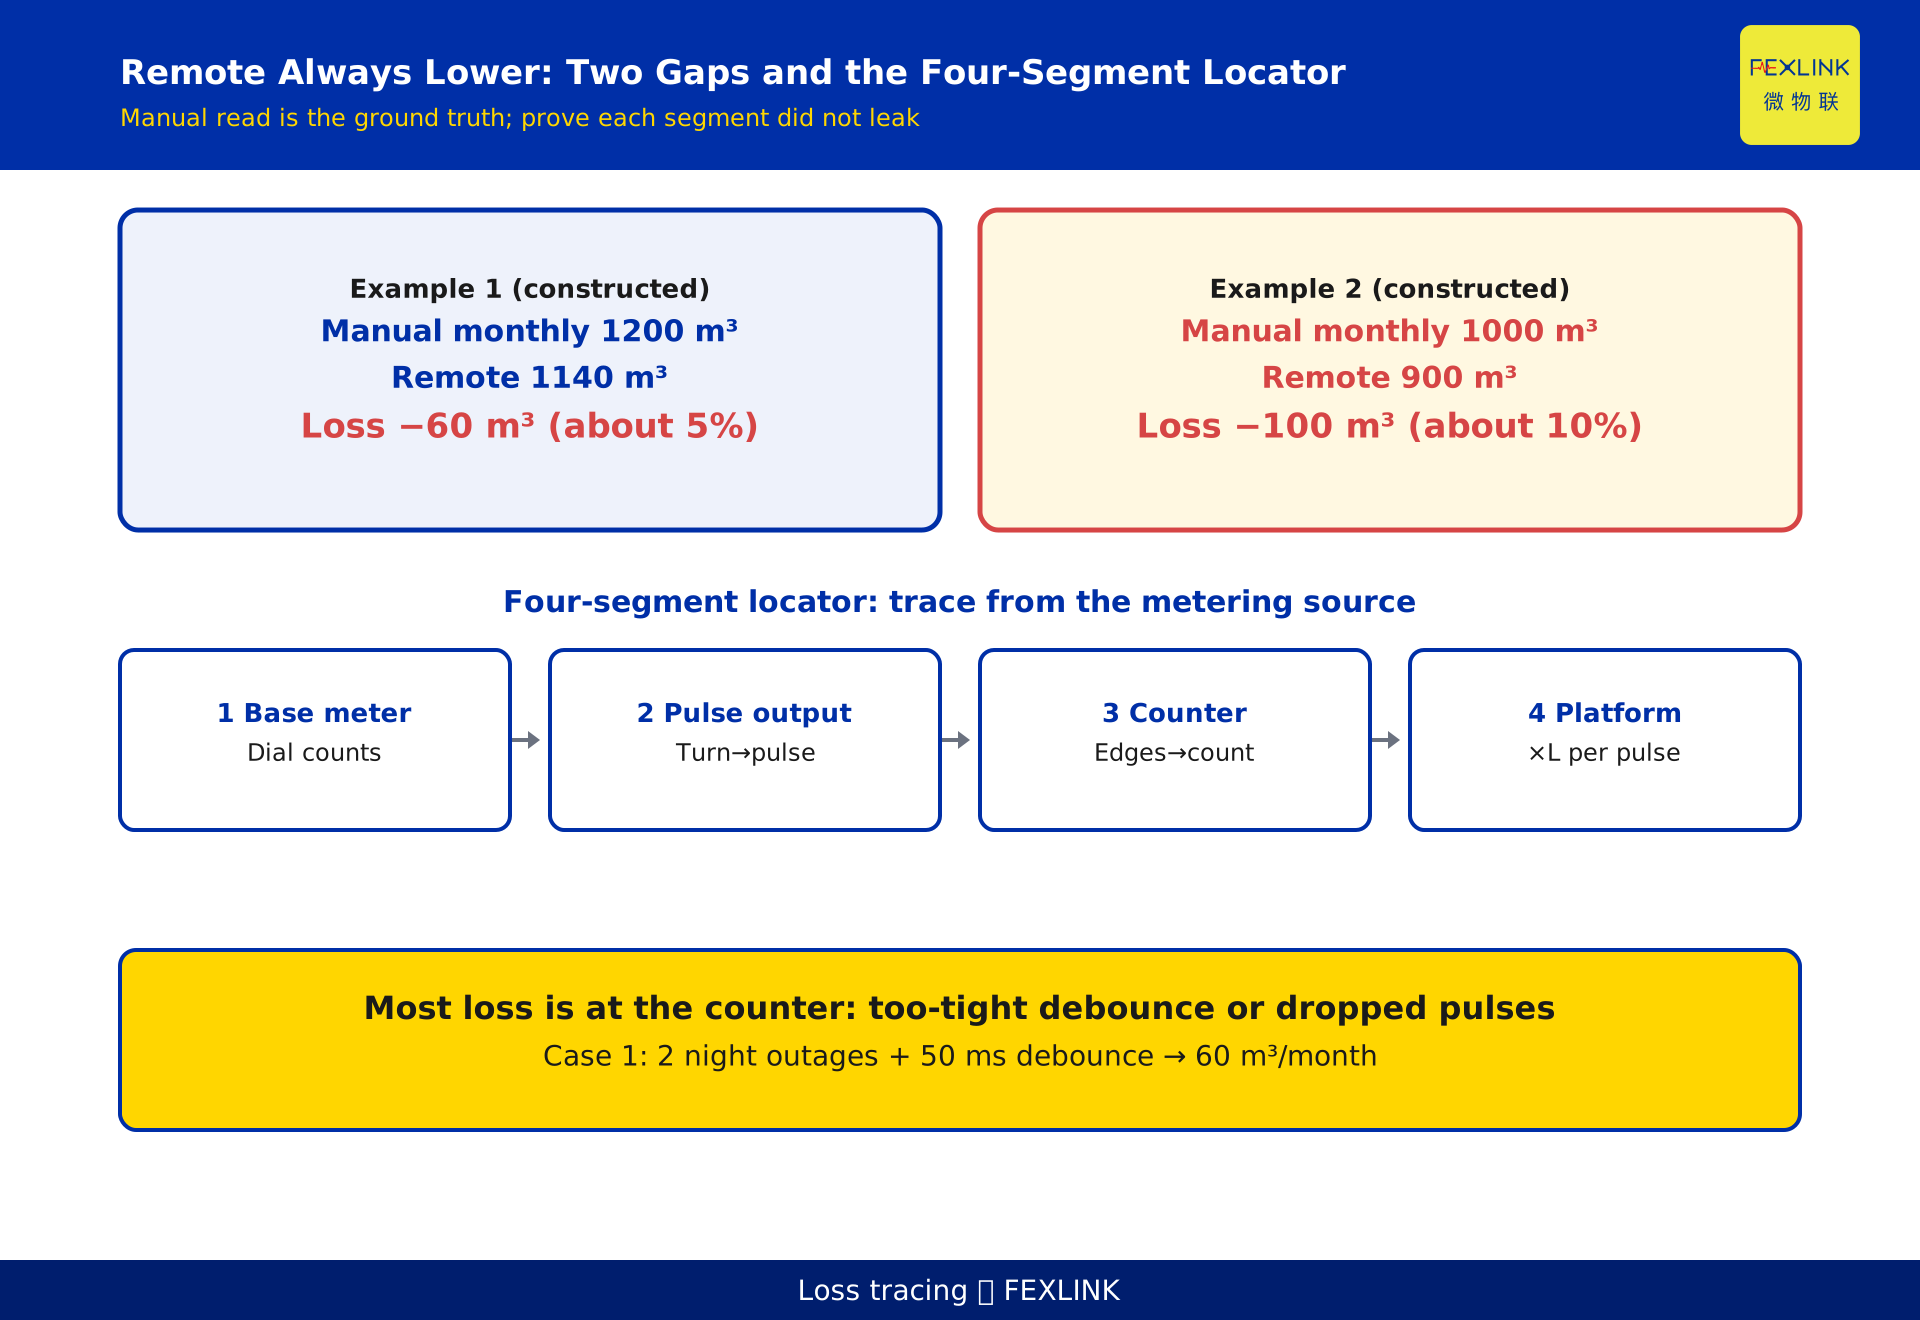
When a remote-reading water meter keeps showing a cumulative total lower than the manual read, do not rush to replace the meter. Walk the data chain from where water is actually measured down to where the number is displayed, in four segments: base meter → pulse output → pulse counter → platform conversion. First confirm the base register is sound, then check whether pulses follow the dial, then inspect the counter's debounce and power-loss behavior, and finally verify the platform's pulse scaling. In most cases the loss comes from an over-tight debounce window or pulses dropped during a power outage at the counter stage — not from the base meter itself.
Why you should not start from the platform
Tracing must begin at the source, where water is metered. The platform is the last link in presentation; the fault usually happens earlier. If the dial has already turned and the pulses have already been emitted, but a later acquisition or conversion step dropped part of them, the platform will naturally show less than the manual read. Starting at the platform only yields a "number is small" result without telling you which segment lost the data. The method here is: treat the manual read as the ground-truth baseline, and prove segment by segment going downstream that "this segment did not lose anything" until you hit the first segment that did.
The four-segment model: base → pulse → counter → platform
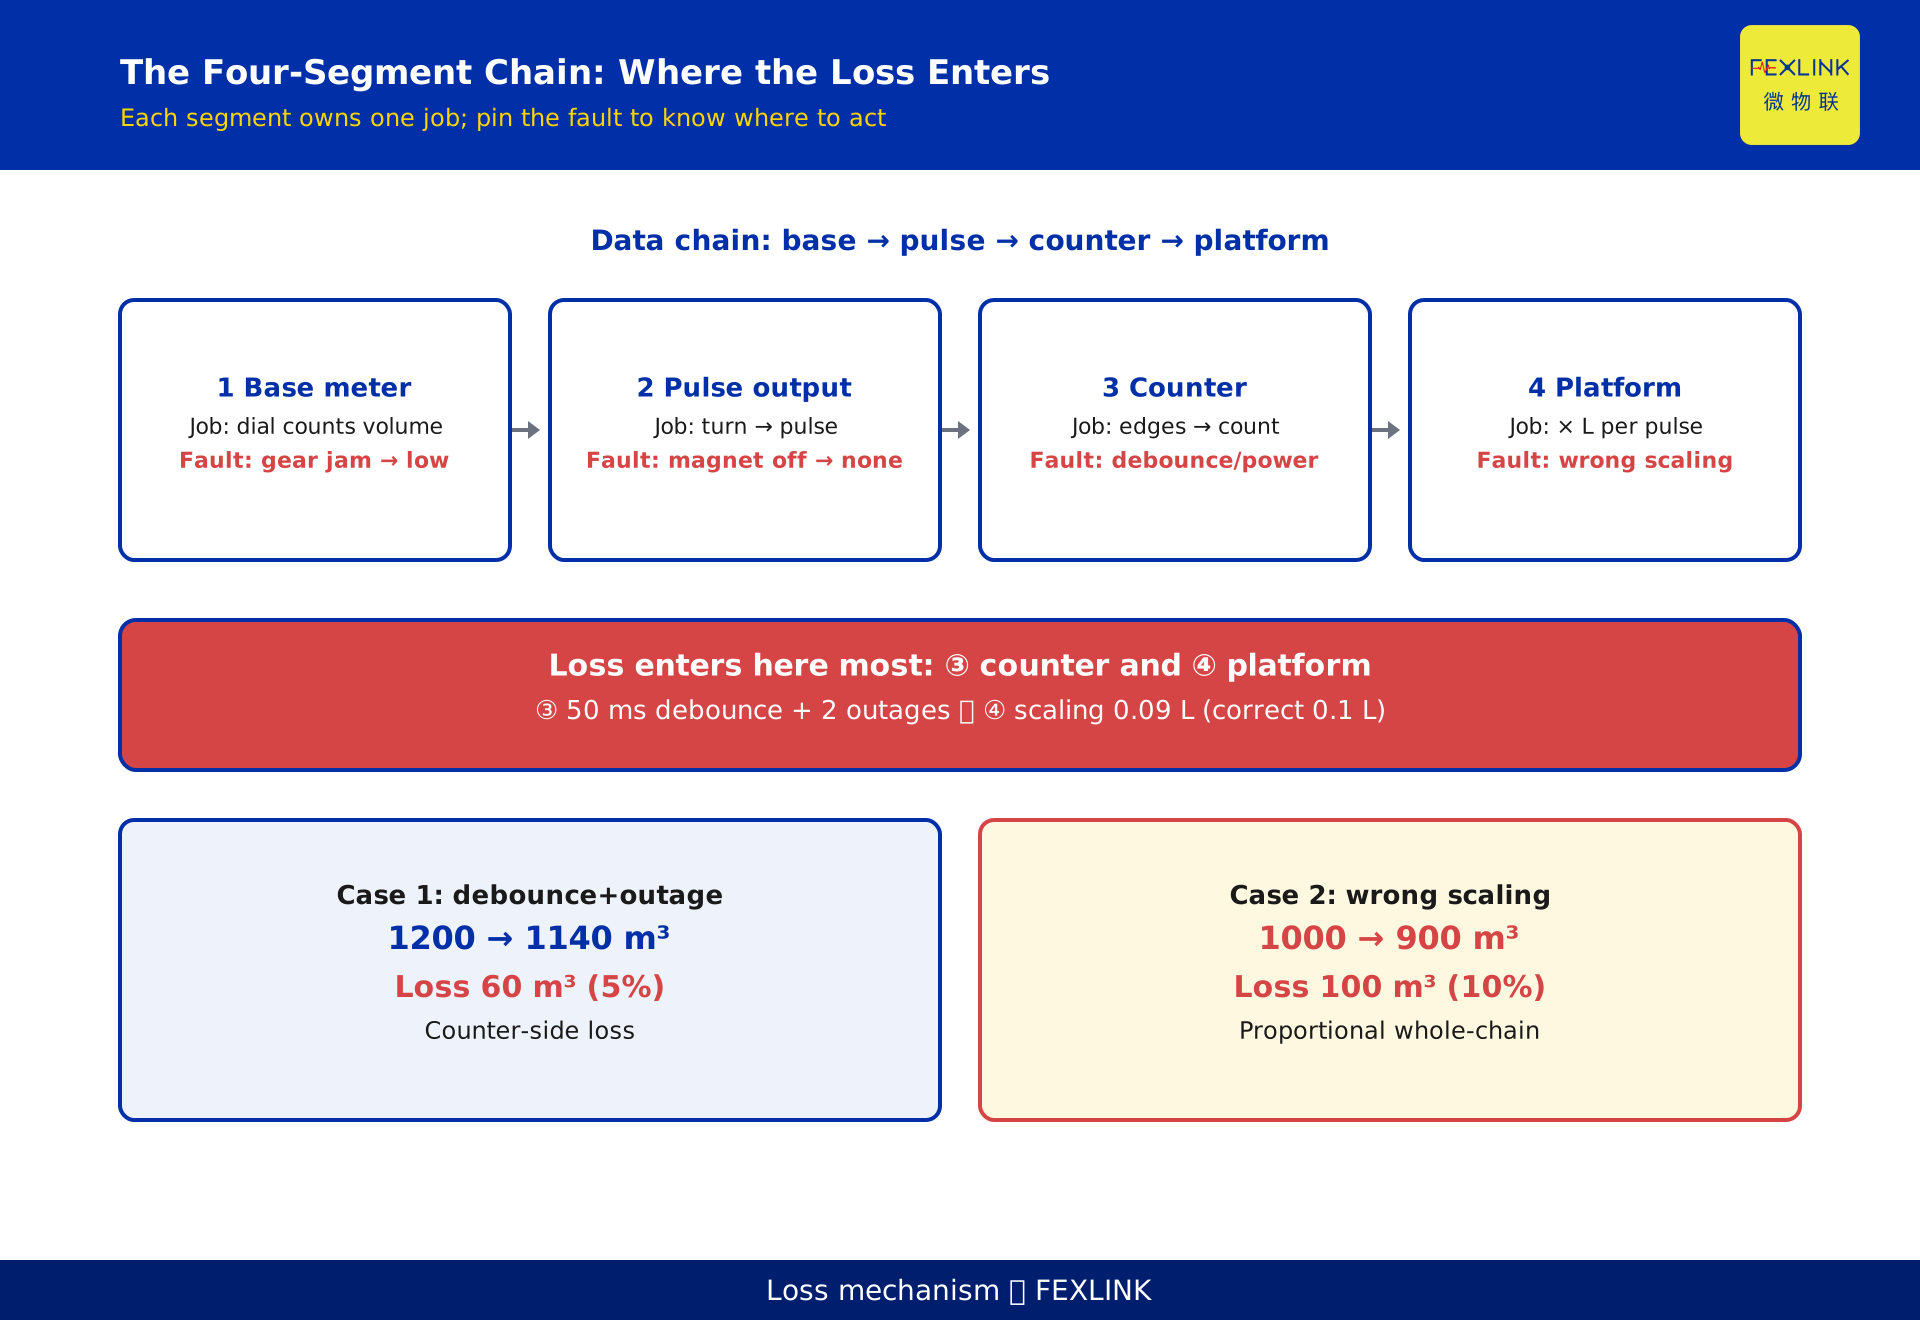
A pulse-output remote meter's data chain splits into four segments, each responsible for exactly one thing:
| Segment | What it does | Typical failure |
|---|---|---|
| 1 Base meter | Dial registers consumption, produces a mechanical count | Gear or dial jams, the mechanical count itself runs low |
| 2 Pulse output | Dial rotation → emits pulses (N pulses per revolution) | Magnet detached, Hall sensor failed, signal wire broken: turns but no pulse |
| 3 Pulse counter | Pulse edges → accumulated count | Over-tight debounce filters valid pulses; no power-loss retention drops pulses |
| 4 Platform conversion | Pulse count × liters-per-pulse → volume | Wrong scaling factor, proportional whole-chain bias |
Pinning the fault to a segment tells you whether to touch the meter, the wiring, the collector, or the configuration.
Distinction from KD-0503 (which explains why pulses get lost): this article focuses on the field diagnosis — the step-by-step "how to trace a live under-count" — while KD-0503 covers the causal mechanics of pulse loss. The increment here is this four-segment tracing procedure.
Segment 1: the base meter (dial and count)
Reading the dial on site gives you the "truth" for this scenario — because we are explaining why the remote reads lower than the manual, the manual read is the baseline. If the manual read lines up with historical usage and the consumption pattern, the base meter is most likely sound. If the dial is jammed or the gear slips, the mechanical count itself runs low, and then the remote and the manual would both run low together — not "the remote alone is short a slice."
Verdict: a manual read that is reasonable and stable → base meter is fine, the loss is not here. This step only rules things out; it does not repair.
Segment 2: the pulse output (dial to pulse)
A pulse water meter uses dial rotation to drive a magnet; each revolution emits a fixed number of pulses, and each pulse stands for a fixed volume (the nominal value is on the nameplate or in the technical manual; a common example is 1 pulse = 0.1 L, with the actual value per the device). This segment only handles "rotation → pulse"; it is not responsible for counting or conversion.
Field check: with a qualified person present and safe access, manually turn the dial (or use a maintenance tool) and watch whether the collector receives pulses that follow the motion. If the dial turns but no pulse comes out, the fault is most likely in the pulse generator, a detached magnet, or a broken signal wire.
Segment 3: the pulse counter (pulse to count)
The collector accumulates pulse edges into a count, and this is where "quiet under-counting" most often appears:
- Over-tight debounce: pulses naturally jitter a little on the line; a debounce window set too small filters continuous valid pulses as if they were noise, so the count runs low.
- No power-loss retention: if the collector does not keep its count through a power outage, or it resets to zero, the pulses during that interval are lost permanently.
Check: pull the collector's run log and power-loss records, and compare the cumulative increment in outage windows against non-outage windows. In most under-counting cases, the problem is right here.
Segment 4: the platform conversion (pulse to volume)
The platform converts "pulse count × liters-per-pulse" into volume. If the scaling factor is wrong (for example the nominal 1 pulse = 0.1 L is entered as 1 L, or vice versa), the whole volume shifts by a proportional bias.
Check: confirm the platform's pulse scaling factor against the meter nameplate or manual, and cross-validate with a known volume. A scaling error shows up as "proportional, whole-chain bias," which differs from the counter's "random pulse drops" and lets you tell the two apart.
Worked examples (constructed)
Walk two constructed datasets to separate two different failure shapes.
Example 1 — debounce plus outage. A fictional residential block (de-identified, not a real customer) shows a manual monthly read of 1,200 m³ and a remote cumulative of 1,140 m³ — a gap of 60 m³, about 5%. Four-segment trace: base meter normal (manual as baseline); pulse output follows normally; the collector log shows 2 nighttime outages and a debounce window set to 50 ms, too tight; platform scaling matches the nameplate. Conclusion: the loss mainly comes from over-tight debounce combined with pulses dropped during outages, roughly 60 m³ per month.
Example 2 — wrong platform scaling. A fictional industrial park (de-identified, not a real customer) shows a manual monthly read of 1,000 m³ and a remote cumulative of 900 m³ — a gap of 100 m³, about 10%. Four-segment trace: base meter normal; pulse output follows; the collector log shows no outages and the debounce window is in the manual's recommended range, so the counter increment is stable; checking the platform scaling reveals the nameplate nominal is 1 pulse = 0.1 L, but the platform was set to 0.09 L. Conclusion: the loss comes from a proportional whole-chain bias at the platform conversion — the remote reads 90% across the board, the shortfall is proportional and consistent month to month, clearly different from the counter's "random pulse drops."
All figures in these examples are constructed to illustrate the method, represent no real customer, and the pulse nominal and debounce/outage parameters follow the device technical manual. The two examples sit together to separate "random loss at one segment" from "proportional whole-chain bias," which decides where to start.
Decision procedure: prove each segment is not the leak
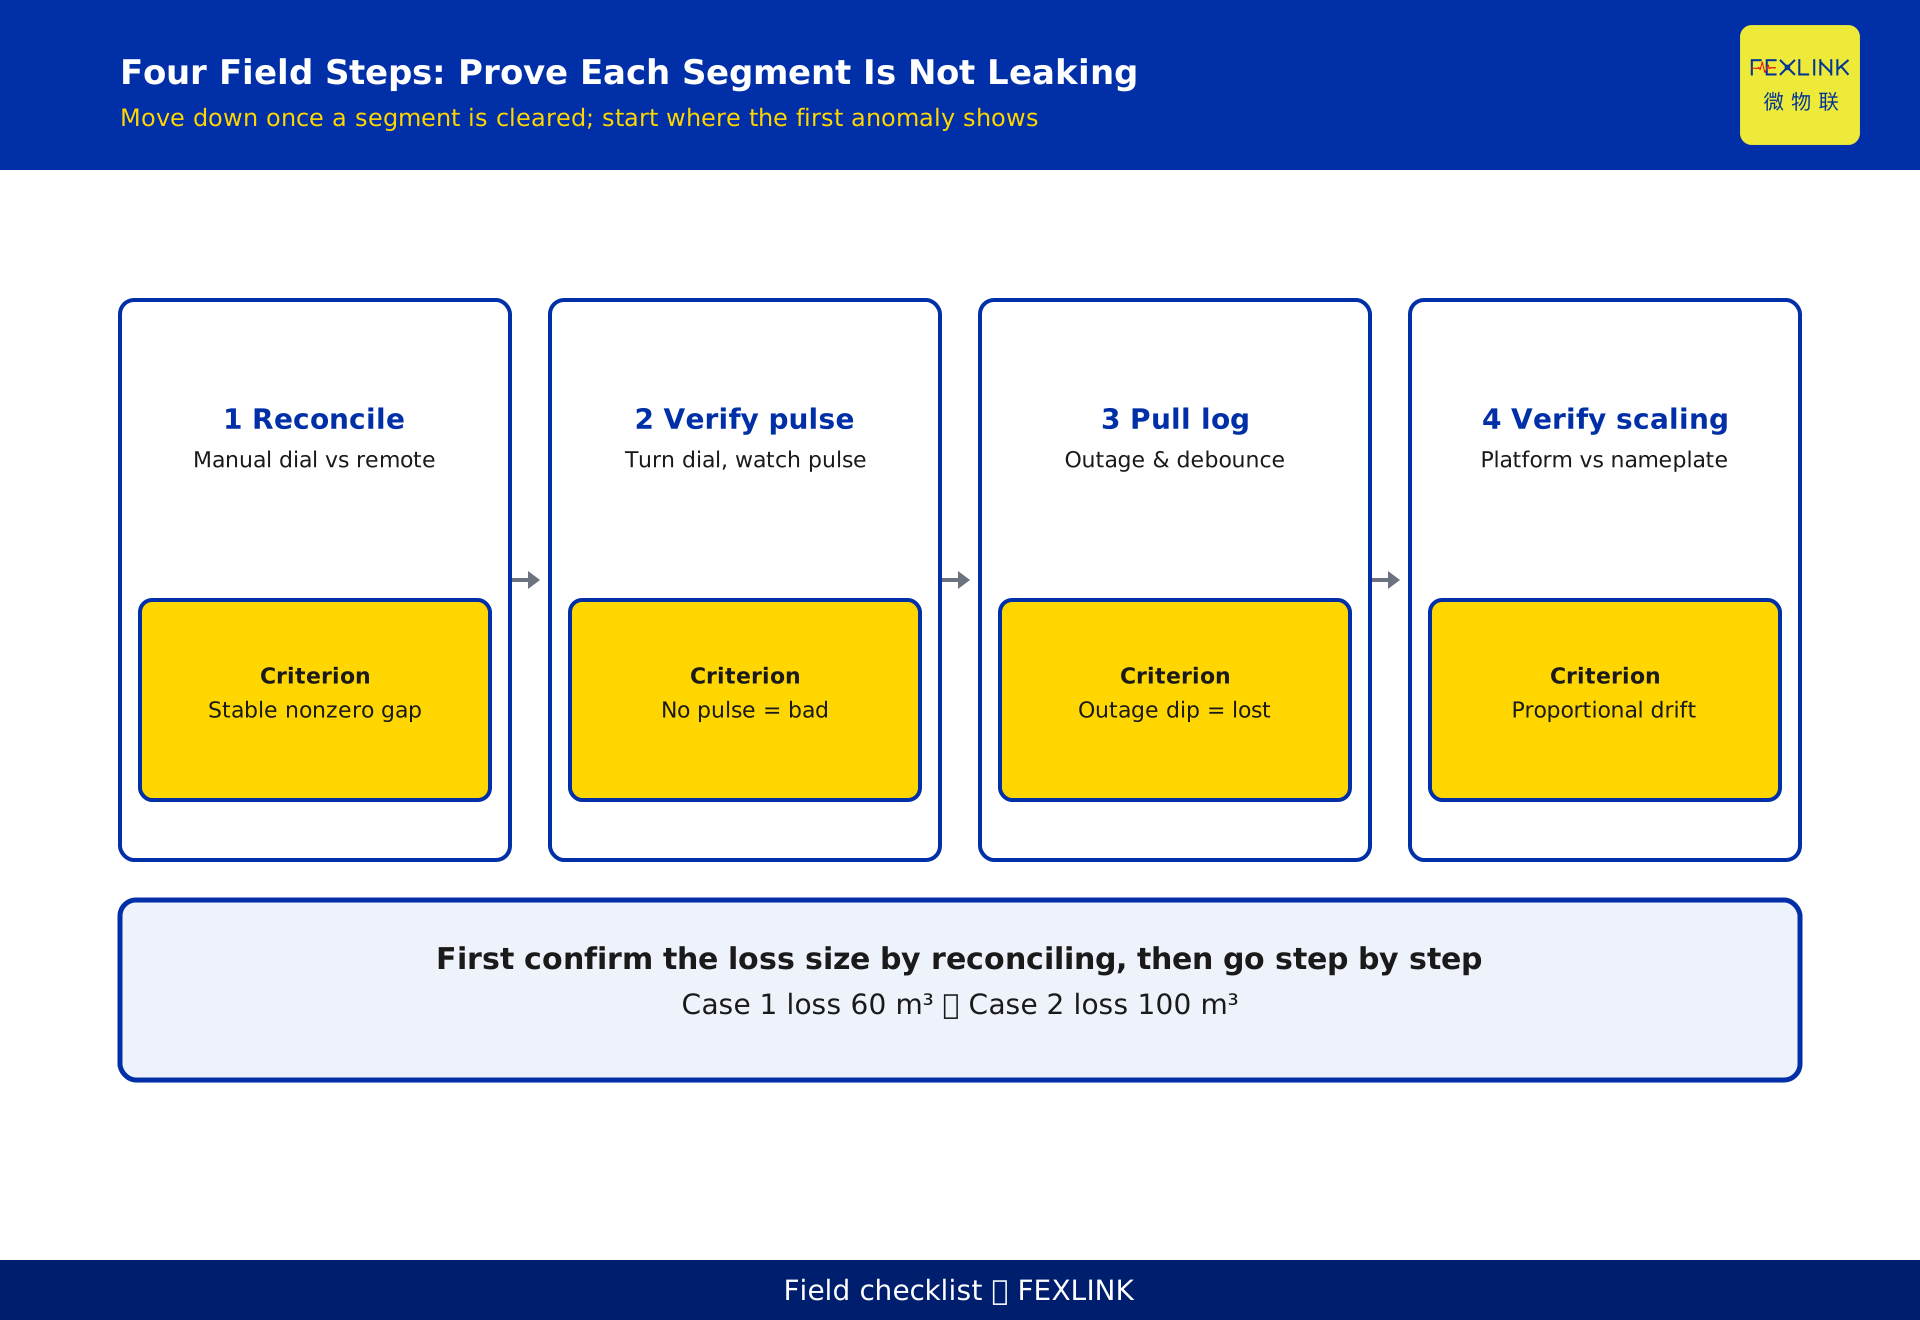
Operational order (with criteria):
- Reconcile the meter: manual dial vs remote cumulative, to confirm the loss is real and how large.
- Verify pulses: turn the dial on site and watch whether the collector receives following pulses — none received, the fault is in the pulse output.
- Pull the log: check the collector's power-loss records and debounce window, compare the increment before and after outages — a sharp drop points to the counter.
- Verify scaling: platform pulse factor vs nameplate nominal, validated with a known volume — a proportional bias points to the platform conversion.
Whichever segment is first proven "not leaking," move to the next; when a segment first shows an anomaly, start there.
Three common mistakes
- Mistake 1: replace the meter at the first sign of loss. Most losses are at the counter (debounce/power-loss); swapping the meter does not fix that.
- Mistake 2: only watch the platform's year-on-year read. That hides losses during outage windows; compare "cumulative increment vs manual increment" segment by segment instead.
- Mistake 3: treat the manual read as unreliable. In this scenario the manual read is the ground-truth baseline; trust the manual first, then investigate the remote.
Where the products and solution fit
The ESI digital-state monitor and the CX-08R06AI08-C1 (8DI) acquire pulses and status signals and record power-loss and events, carrying the diagnostic data for the "pulse counter" segment; the unified water-and-electricity sub-metering solution provides the platform-side aggregation and reconciliation framework. Both are described only qualitatively as data carriers and aggregators — they do not grade model capability, infer measured performance, or constitute a procurement commitment.
FAQ
Q: If the remote reads lower than the manual, is the meter broken?
A: Not necessarily. First reconcile the meter to confirm the base dial is sound, then trace down the four segments. Most losses sit at the counter (over-tight debounce or dropped pulses during outage), not in the base meter. A broken base meter usually makes both the remote and the manual run low together.
Q: How do I tell whether the pulse output failed versus the collector?
A: Turn the dial manually on site and watch whether the collector receives following pulses. No pulse despite turning → fault in the pulse output (magnet/Hall/signal wire). Pulses present but the count is still low → fault in the counter (debounce/power-loss).
Q: What is a debounce window, and why would it make me under-count?
A: The collector sets a debounce window to filter jitter on the pulse line. Set too tight, it mistakes continuous but slightly jittery valid pulses for noise and drops them, causing under-counting. Returning the window to the manual's recommended range usually restores it.
Q: Can a power outage really lose pulses?
A: It depends on whether the collector has power-loss retention. If it does not keep its count through an outage or it resets, the pulses in that interval are lost permanently. Check the collector's power-loss records and compare the cumulative increment before and after outages.
Q: How do I spot a wrong platform scaling factor?
A: Confirm the platform's pulse scaling against the meter nameplate nominal and cross-validate with a known volume. A scaling error shows as a proportional whole-chain bias, unlike the counter's random pulse drops, which lets you distinguish them.
Scope and limitations
This article applies to locating under-counting in pulse-output remote water meters where "the cumulative read stays below the manual read" — it does not apply to pure direct-reading, image-based, or NB non-pulse meters (no pulse stage). The four-segment model, decision order, and mistakes are general methodology; specific thresholds (debounce window, power-loss retention duration, liters per pulse) follow the device technical manual and on-site measurement.
Every figure in the worked example (manual 1,200 m³, remote 1,140 m³, gap 60 m³, about 5%, 2 nighttime outages, debounce window 50 ms, example 0.1 L per pulse) is constructed to illustrate the problem, represents no real customer, and must not be cited as measured or promised data. The referenced products (ESI digital-state monitor, CX-08R06AI08-C1 (8DI)) and solution (unified water-and-electricity sub-metering) are described only qualitatively as data carriers and aggregators — they do not grade model capability, infer measured performance, or constitute a procurement commitment. This article cites no standard numbers; any standard follows the currently valid text. This article's D10 still requires independent QA review.
Frequently Asked Questions
If the remote reads lower than the manual, is the meter broken?
Not necessarily. First reconcile the meter to confirm the base dial is sound, then trace down the four segments. Most losses sit at the counter (over-tight debounce or dropped pulses during outage), not in the base meter. A broken base meter usually makes both the remote and the manual run low together.
How do I tell whether the pulse output failed versus the collector?
Turn the dial manually on site and watch whether the collector receives following pulses. No pulse despite turning → fault in the pulse output (magnet/Hall/signal wire). Pulses present but the count is still low → fault in the counter (debounce/power-loss).
What is a debounce window, and why would it make me under-count?
The collector sets a debounce window to filter jitter on the pulse line. Set too tight, it mistakes continuous but slightly jittery valid pulses for noise and drops them, causing under-counting. Returning the window to the manual's recommended range usually restores it.
Can a power outage really lose pulses?
It depends on whether the collector has power-loss retention. If it does not keep its count through an outage or it resets, the pulses in that interval are lost permanently. Check the collector's power-loss records and compare the cumulative increment before and after outages.
How do I spot a wrong platform scaling factor?
Confirm the platform's pulse scaling against the meter nameplate nominal and cross-validate with a known volume. A scaling error shows as a proportional whole-chain bias, unlike the counter's random pulse drops, which lets you distinguish them.