 FEXLINK Research Institute
The short answer
When you meter for energy management, the question is not "how many meters can we afford to skip" or "how many can we pile on" — it is "at which level do we need to see the losses." Level 1 (the main intake / revenue point) closes the total accounts. Level 2 (shops / buildings) enables benchmarking. Level 3 (production lines / key equipment) produces unit-consumption figures. Level 3 is not meant to cover everything: it should be placed only on the high-consumption, high-value equipment. If you can locate the loss, the level is sufficient.
What each of the three meter levels answers
Metering tiers are not an administrative hierarchy; they are a magnifying glass that makes losses visible one layer at a time. Each tier answers a different question.
- Level 1 answers "how much did the whole site use, and does it reconcile with the utility bill?" It is the authoritative, settlement-grade total against which plant-specific energy intensity is calculated.
- Level 2 answers "which shop or building uses more, and is it off versus its peers?" It splits site energy into independently accountable units so you can benchmark sideways.
- Level 3 answers "is this machine's unit-consumption reasonable, and has its efficiency dropped?" It pushes energy down to the line and the key asset, supporting unit-consumption targets and equipment-level diagnosis.
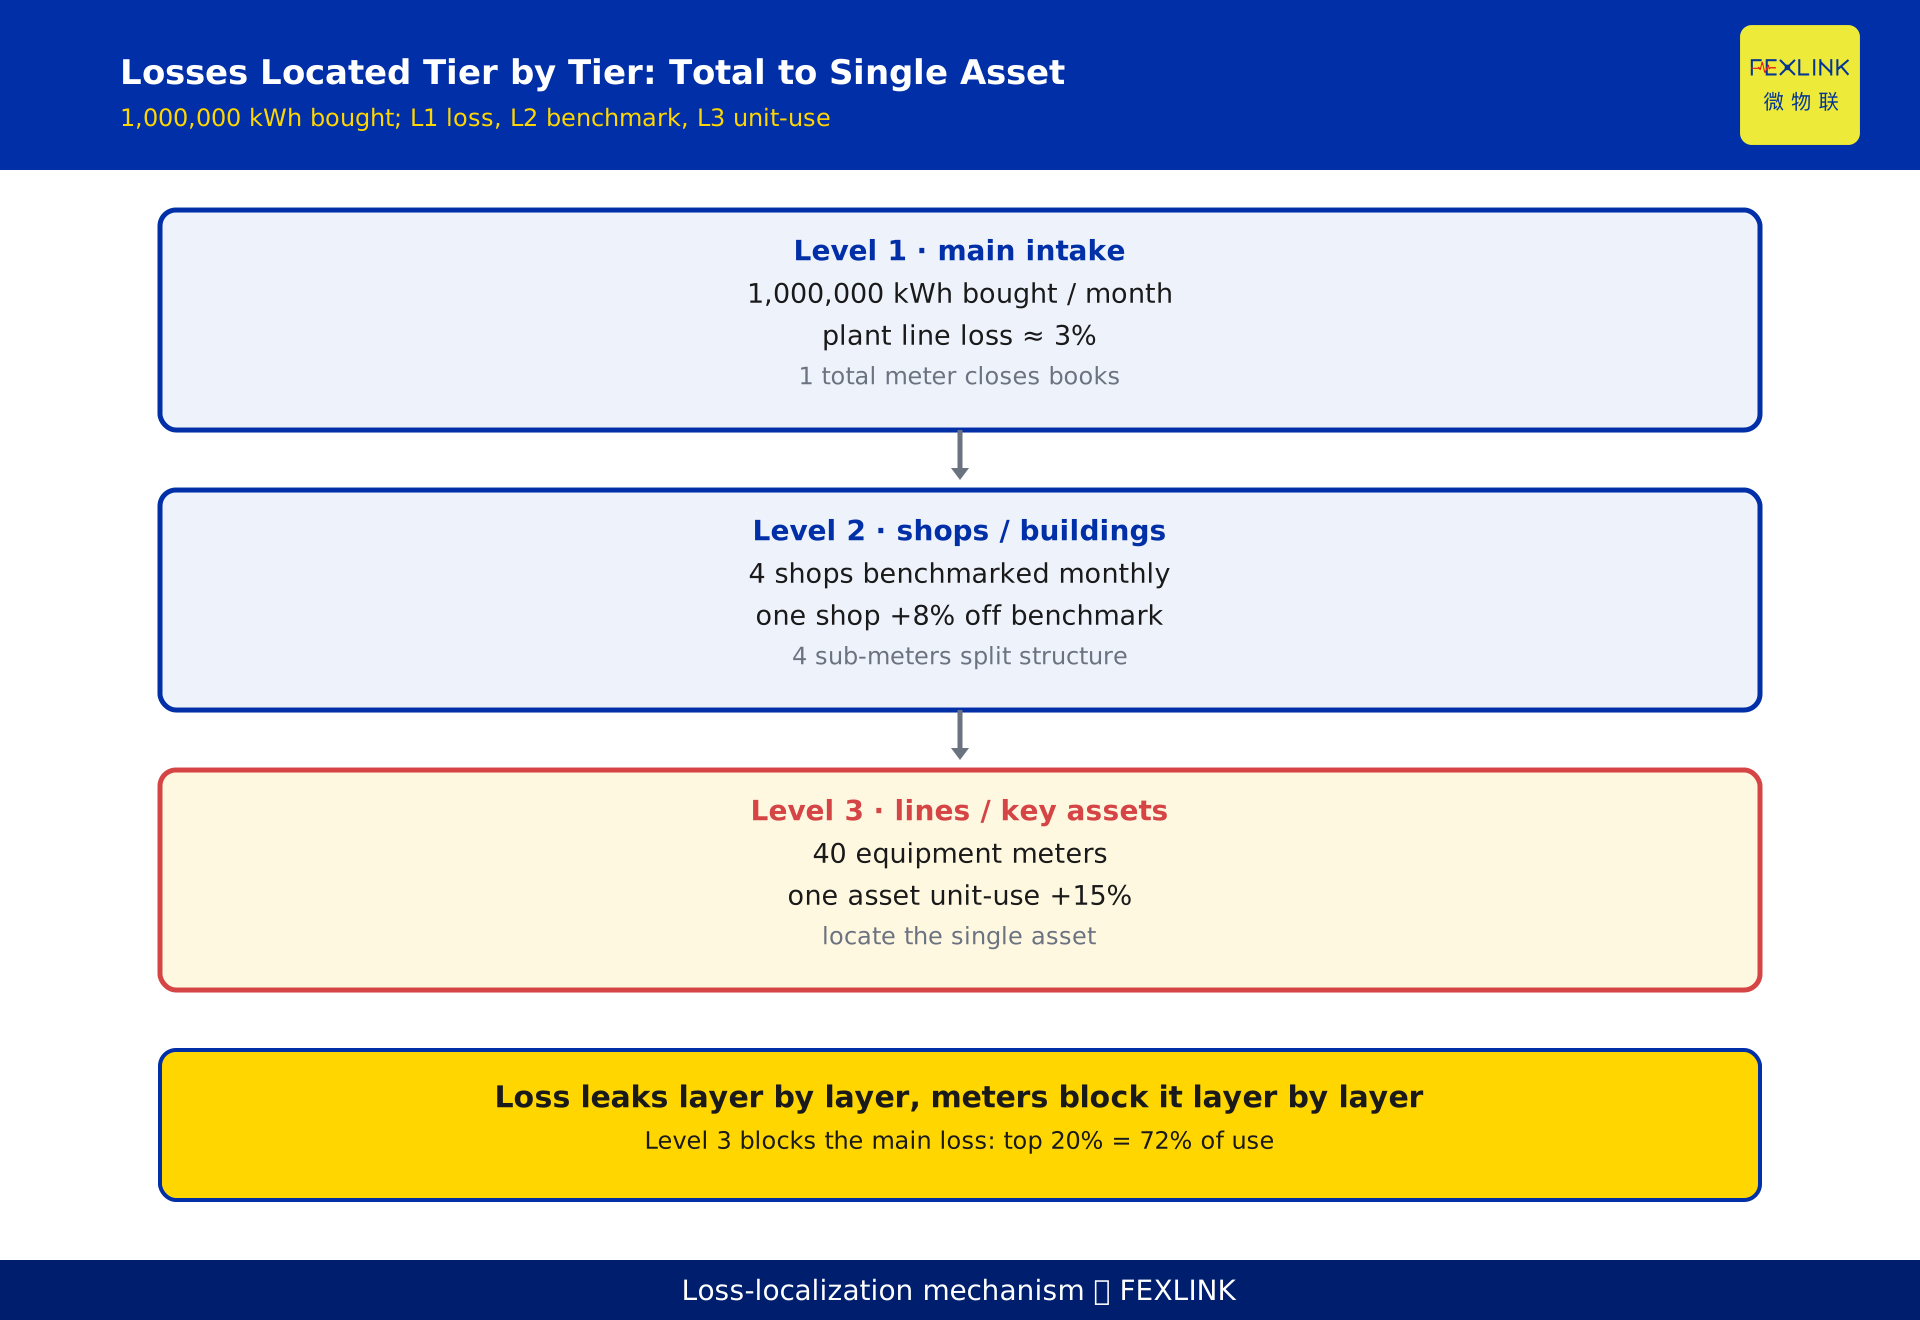
In one phrase: Level 1 sees the total, Level 2 sees the structure, Level 3 sees the single point. Stack the three and a loss turns from "one fuzzy number" into "a leak you can point to layer by layer."
Level 1 — the revenue meter that closes the books
Level 1 sits at the site's main intake or revenue point, normally a single total meter (sites with multiple supplies or feeders may have several, but conceptually they are all Level 1). Its only hard job is to give the whole site one authoritative, settlement-grade ledger.
Why can Level 1 least be skipped? Every downstream Level 2 benchmark and Level 3 unit figure must eventually be reconciled against this total. If Level 1 is wrong, every layer built on top of it stands on sand. On accuracy, the revenue total meter is normally expected to use a higher-accuracy class (in engineering practice a higher class such as 0.5S-class or 0.2S-class is used as the settlement instrument) so its figures match the utility settlement side.
In practice Level 1 carries a often-overlooked role: it is the "first subtraction" for site line losses. Purchased energy minus the sum of all downstream circuits equals the transformer and plant-level line loss. In one worked example a plant bought 1,000,000 kWh in a month, and the Level 1 total showed a plant-level line loss of about 3% — a figure only Level 1 can answer immediately.
Level 2 — benchmarking across shops and buildings
Level 2 lands at the boundary of shops, buildings, and independently accountable units. Its value is not "measuring finer" but "having a comparable baseline."
Building that baseline takes three steps. First, define the accounting boundary: which lines, auxiliary systems, and shared loads (lighting, HVAC, compressed air) each Level 2 unit contains. The boundary must be fixed, or months become non-comparable. Second, choose the benchmarking metric: compare similar shops by energy per unit of output or per floor area, never by absolute value — a three-shift shop and a single-shift shop are born different in absolutes. Third, set a deviation alarm: when a unit drifts more than about 5% from its peer benchmark, it is worth opening an investigation.
The common Level 2 mistake is to spread meters "one per room." Level 2 granularity should match the management unit, not the physical room. In one worked example a plant placed one Level 2 meter in each of its 4 shops; monthly benchmarking showed one shop running about 8% above its peer baseline on energy per unit of output — a signal neither the Level 1 total nor a Level 3 equipment meter could have produced.
Level 3 — unit-consumption at the equipment
Level 3 pushes down to production lines and key equipment, with the aim of calculating unit-consumption and running equipment-level efficiency diagnosis. It is the most tempting tier and the easiest to blow the budget on.
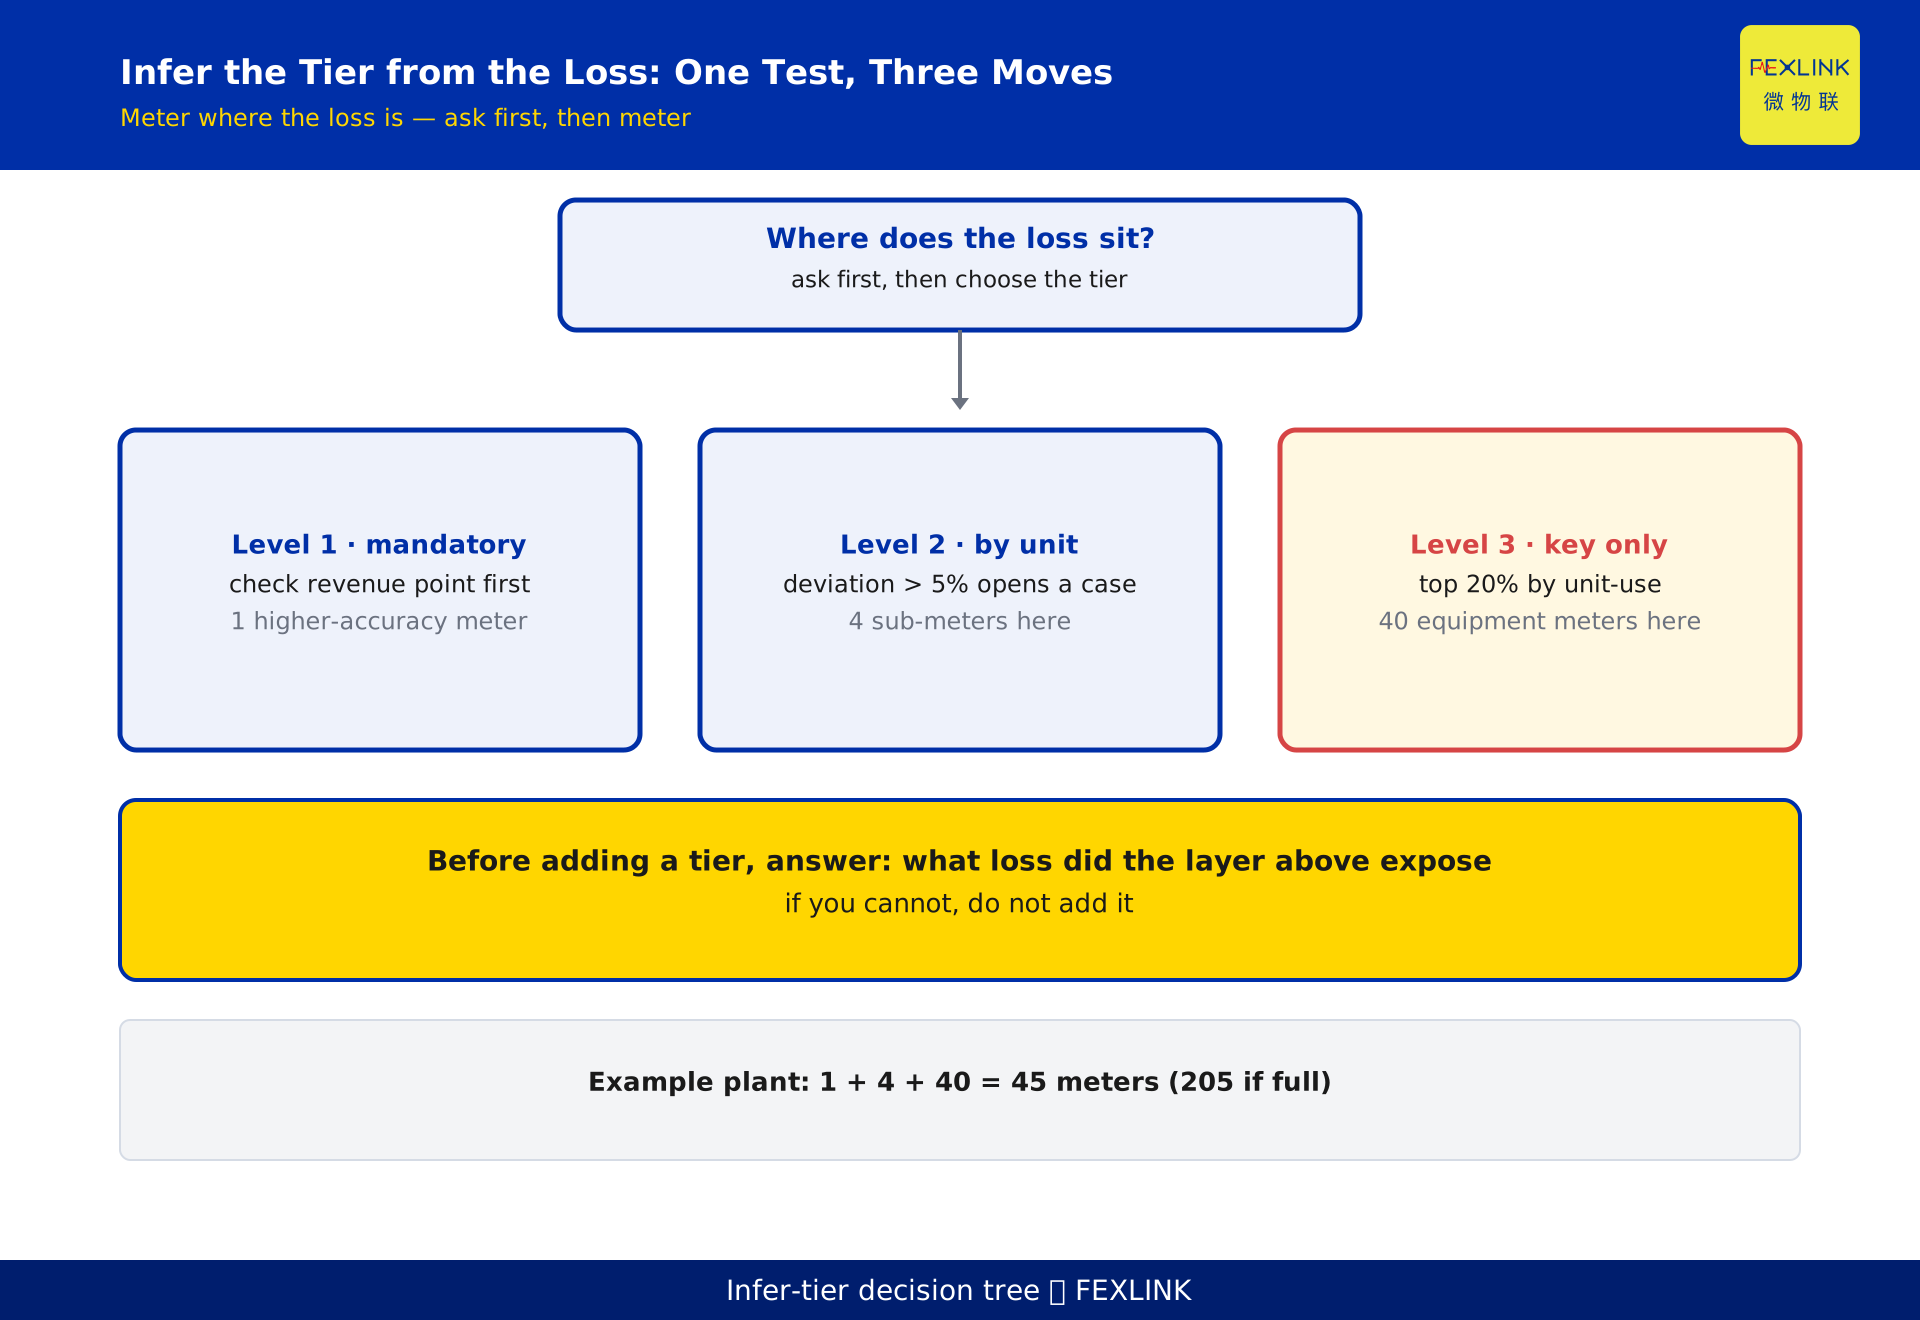
Point selection follows one rule: "ask where the loss is, then decide where the meter goes." Three kinds of points deserve meters:
- Equipment that dominates unit-consumption: air compressors, central HVAC, kilns, large motors — they often eat most of a line's energy.
- Equipment whose efficiency drifts: variable-frequency drives, aged motors, pumps running long-term at low load — efficiency decay you cannot see.
- Equipment with an accountability: the host machines tied to a unit-consumption KPI or an energy quota.
Conversely, lighting, small auxiliary loads, and steady, very-low-share loops normally need no Level 3 — the meter budget saved should be concentrated on the high-value points.
More meters is not better: infer levels from where losses hide
This is where this article differs most from pieces that "distinguish settlement metering from management metering": that genre clarifies two purposes, this one designs the tier structure. The whole method is one sentence — infer the metering level from where you can actually find the loss.
The logic is simple: you do not pre-decide "how many Level 3 meters," you first decide "at which layer do I need to find the loss."
- If you only want the total and a trend → Level 1 is enough.
- If you need to find "which shop is leaking" → add Level 2.
- If you need to locate "which machine is wasting power" → only then go to Level 3.
Adding a tier is justified only when the layer above has exposed a loss that only the next layer can answer — not to look "more refined" by blanketing meters everywhere.
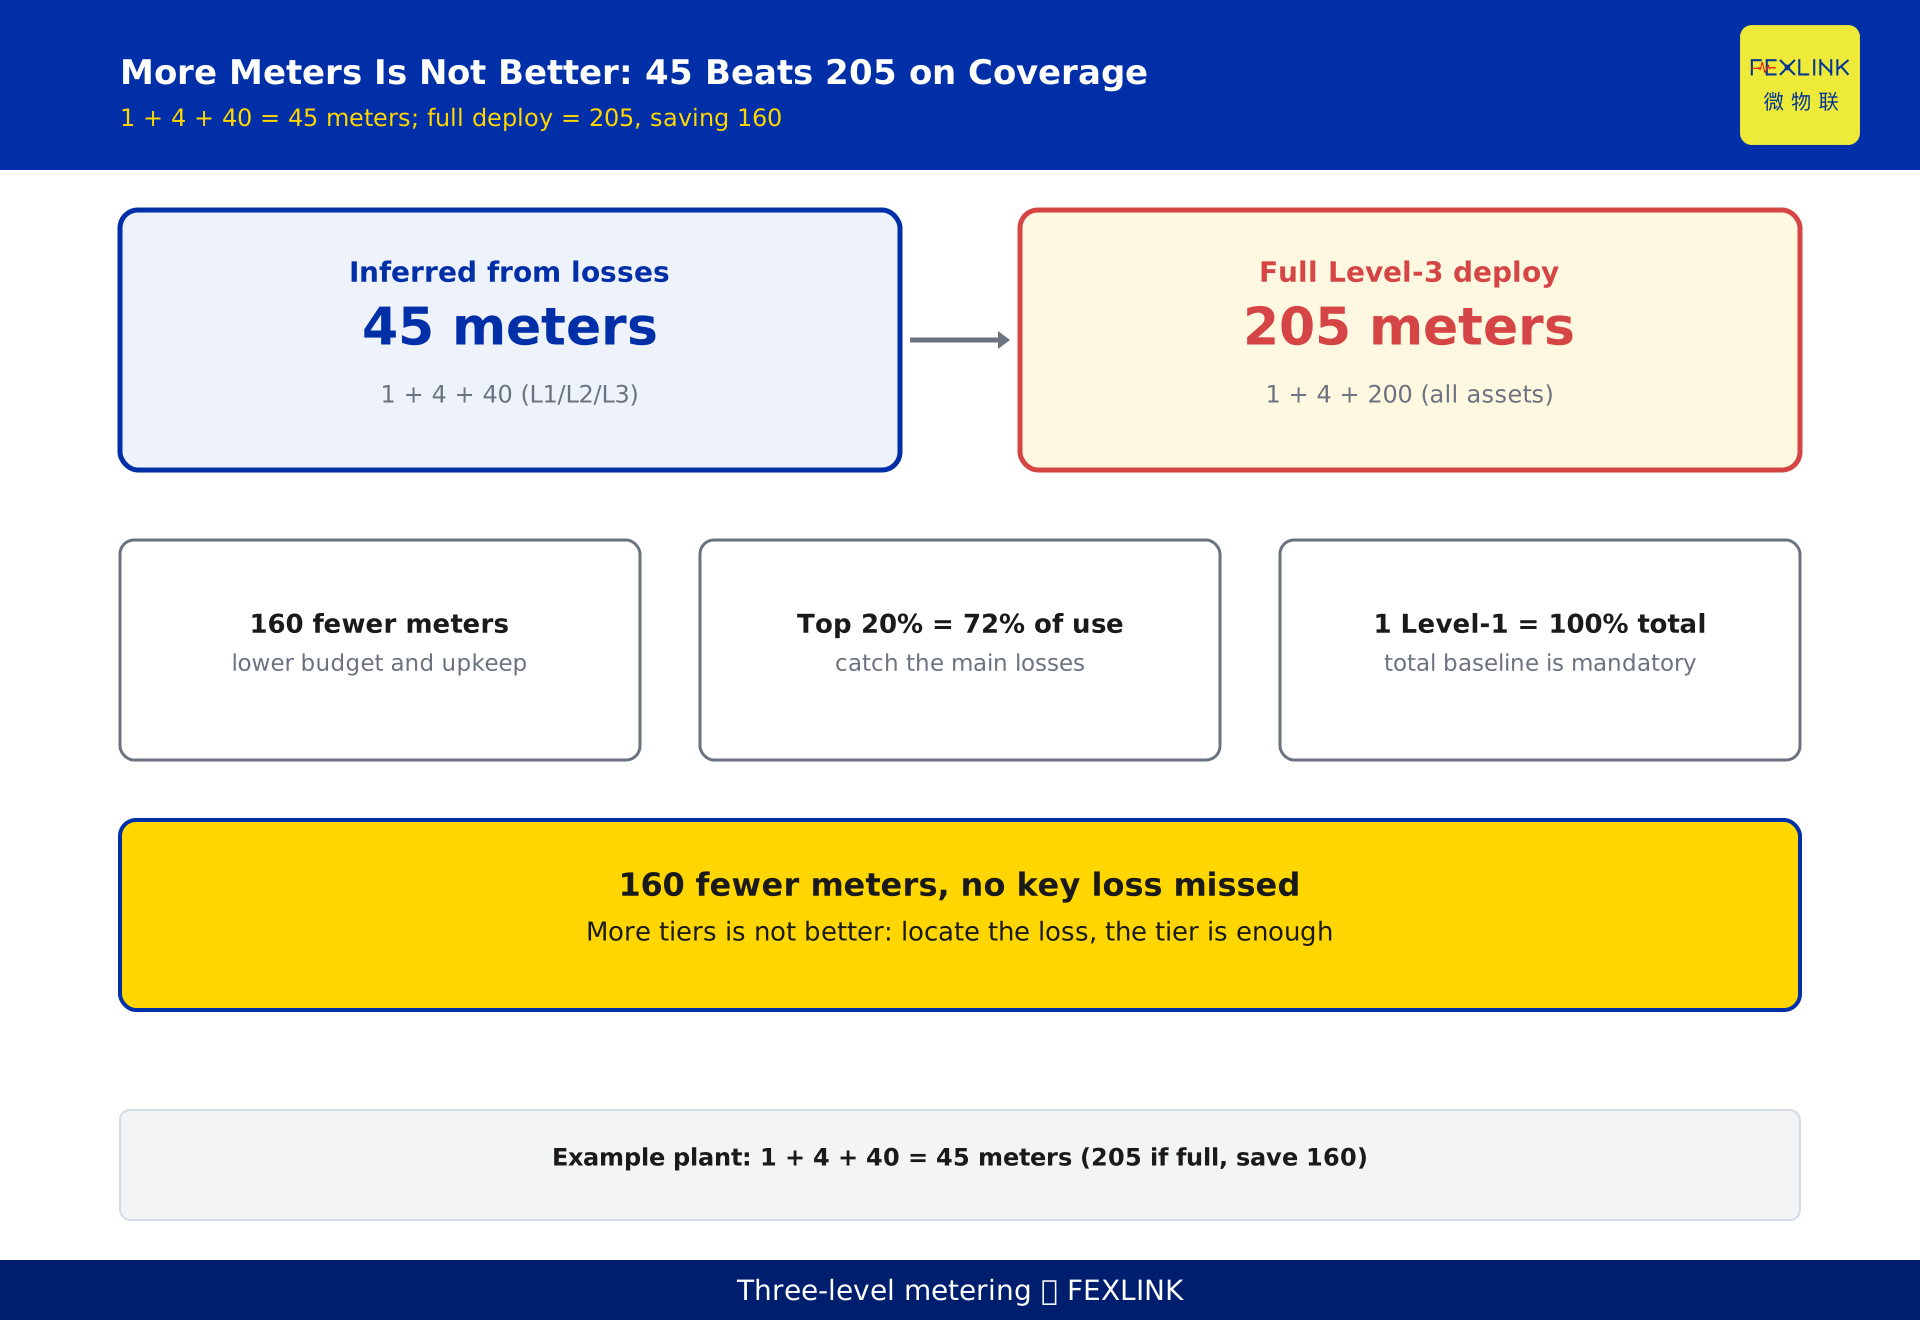
In numbers, this logic saves budget directly. In one worked example the plant had 200 main energy-using assets: fully deploying Level 3 means 200 equipment meters plus 1 Level 1 and 4 Level 2 — 205 meters site-wide, an explosion of cost and maintenance. Inferring from losses and placing Level 3 only on the top 20% of equipment by unit-consumption needs just 40 equipment meters, 45 site-wide, yet still locates the main losses — because in that example the top 20% of equipment contributed about 72% of the line's unit-consumption. With 160 fewer meters, no key loss was missed.
A worked three-level layout for one plant
Putting the method onto one table (figures are constructed to illustrate the tiering method and represent no real customer or project):
- Level 1 (revenue / main intake): 1 total meter — site total, utility settlement, plant-level line loss.
- Level 2 (shops / buildings): 4 sub-meters covering 4 shops, monthly benchmarking on energy per unit of output.
- Level 3 (lines / key equipment): 40 equipment meters, placed only on the top 20% of high-consumption, high-value equipment by unit-consumption.
The site totals 45 meters. Against the 205-meter full-deployment option that is 160 fewer meters, holding budget while keeping visibility of the main consumption. This example does not say "45 is the standard answer"; it shows that inferring from losses yields a defensible meter count instead of guessing "ten more per shop."
Choosing meters and landing the data in a system
With the layout fixed, delivery rests on two meter families and one data chain. The ESA all-element smart meter (circuit-level smart meter) fits the circuit layer, performing metering and data upload, and can cover Level 1, Level 2, and the key circuits of Level 3. The ZSA embedded multi-function smart meter (embedded multi-function smart meter) is compact and fits inside a switchboard or at the equipment end, suiting Level 3 equipment-level placement. Both solve the same problem: every tier's readings return to the system automatically and continuously, instead of by manual reading.
Once data returns to the system it feeds the digital electrical intelligent supervision system for aggregation and alarming, and upward supports the energy-carbon autonomous system 4×3×2 closed loop — every link of monitor, benchmark, and improve depends on the real data the three tiers feed it. One reminder: selection is not decided by this article; specific specifications follow the product manual, and this article only discusses placement logic.
Practical siting rules you can apply
Compress the method into a few rules you can act on directly:
- Level 1 rule: any enterprise with an independent utility settlement point must install a Level 1 revenue meter; multiple supplies get separate meters, never infer the total from sub-meters.
- Level 2 rule: any unit needing sideways benchmarking or independent cost accounting (shop, building, line group) gets a Level 2 meter; fix the boundary, unify the metric, and open a case when deviation exceeds 5%.
- Level 3 rule: place meters only on the top 20% of high-consumption, high-value equipment by unit-consumption; prioritize assets whose efficiency drifts or that carry a unit-consumption target. Everything else stays out of Level 3.
- Inference rule: before adding any tier, you must answer "what loss did the layer above expose that only this layer can locate"; if you cannot, do not add it.
These are not guesses — they give executable thresholds and boundaries.
Frequently Asked Questions (FAQ)
Q: Is one total meter enough for a small plant?
It depends on how deep you want to manage. For total-volume statistics and utility reconciliation, Level 1 truly suffices; but the moment you ask "why did the bill rise" or "which shop is leaking," you cannot proceed without Level 2 and Level 3. Meters are decided by the layer of loss you want to find, not by plant size.
Q: Does denser Level 3 mean more accurate diagnosis?
Not necessarily. The value of Level 3 is locating the main losses, not covering every asset. Concentrating budget on the top 20% of equipment by unit-consumption often captures the point better than blanketing all 200; too dense a spread only adds maintenance and data-noise cost.
Q: Can a Level 2 meter at the shop main switch replace a Level 3 equipment meter?
They are not interchangeable. Level 2 tells you "this shop is off by 8%" but not which machine; Level 3 is what drops the loss onto a single asset. The two answer different questions — Level 2 is the sieve, Level 3 is the probe.
Q: Should the Level 1 revenue meter be the most accurate class available?
No. The revenue meter must meet the higher accuracy the settlement context requires (a higher class such as 0.5S-class or 0.2S-class), but a still-higher class usually means higher cost, and accuracy beyond the settlement need is waste. Choose the class that is adequate for settlement and totaling.
Q: How is Level 1 counted for multiple supplies or multiple sites?
Every independent utility settlement incoming line counts as Level 1 with its own total meter; you cannot merge them under one meter. For multiple sites, set a Level 1 per site and roll up to headquarters; Level 2 and Level 3 likewise cascade down by the site's accounting units.
Scope and limitations
- This article describes a tiered electricity-metering placement method for industrial and commercial sites. It applies to premises with their own transformer, a utility settlement point, and an active energy-management need — factories and buildings. Pure residential users or single-circuit small shops do not involve multi-tier metering and are out of scope.
- The worked plant figures (1 Level 1 total, 4 Level 2, 40 Level 3, 45 site-wide; 205 if Level 3 is fully deployed, a saving of 160; top 20% of equipment ≈ 72% of line unit-consumption; monthly purchase 1,000,000 kWh, plant-level line loss ≈ 3%, one shop benchmark deviation 8%, one equipment unit-consumption 15% above design) are constructed to illustrate the tiering method and represent no real customer or project.
- The thresholds "top 20% by unit-consumption" and "5% benchmark deviation" are decision examples given by this article; each enterprise should calibrate them against its own consumption structure and history and they are not a fixed standard.
- The accuracy classes mentioned (0.5S-class, 0.2S-class) appear only as generic engineering codes for "higher accuracy," stated qualitatively, citing no standard clause or error limit; the specific accuracy requirement follows current metering rules and the settlement contract.
- The functional descriptions of the ESA all-element smart meter and the ZSA embedded multi-function smart meter are qualitative (circuit-level / embedded metering and data upload) and contain no current, voltage, accuracy, or communication-rate figures; selection follows the product manual and this article is not procurement advice.
- The related solutions "energy-carbon autonomous system 4×3×2" and "digital electrical intelligent supervision system" are mentioned only to show where the data closed-loop is hosted; their technical details and metrics are not expanded here.
Frequently Asked Questions
Primary, Secondary and Tertiary Metering
When you meter for energy management