 FEXLINK Research Institute
The short answer
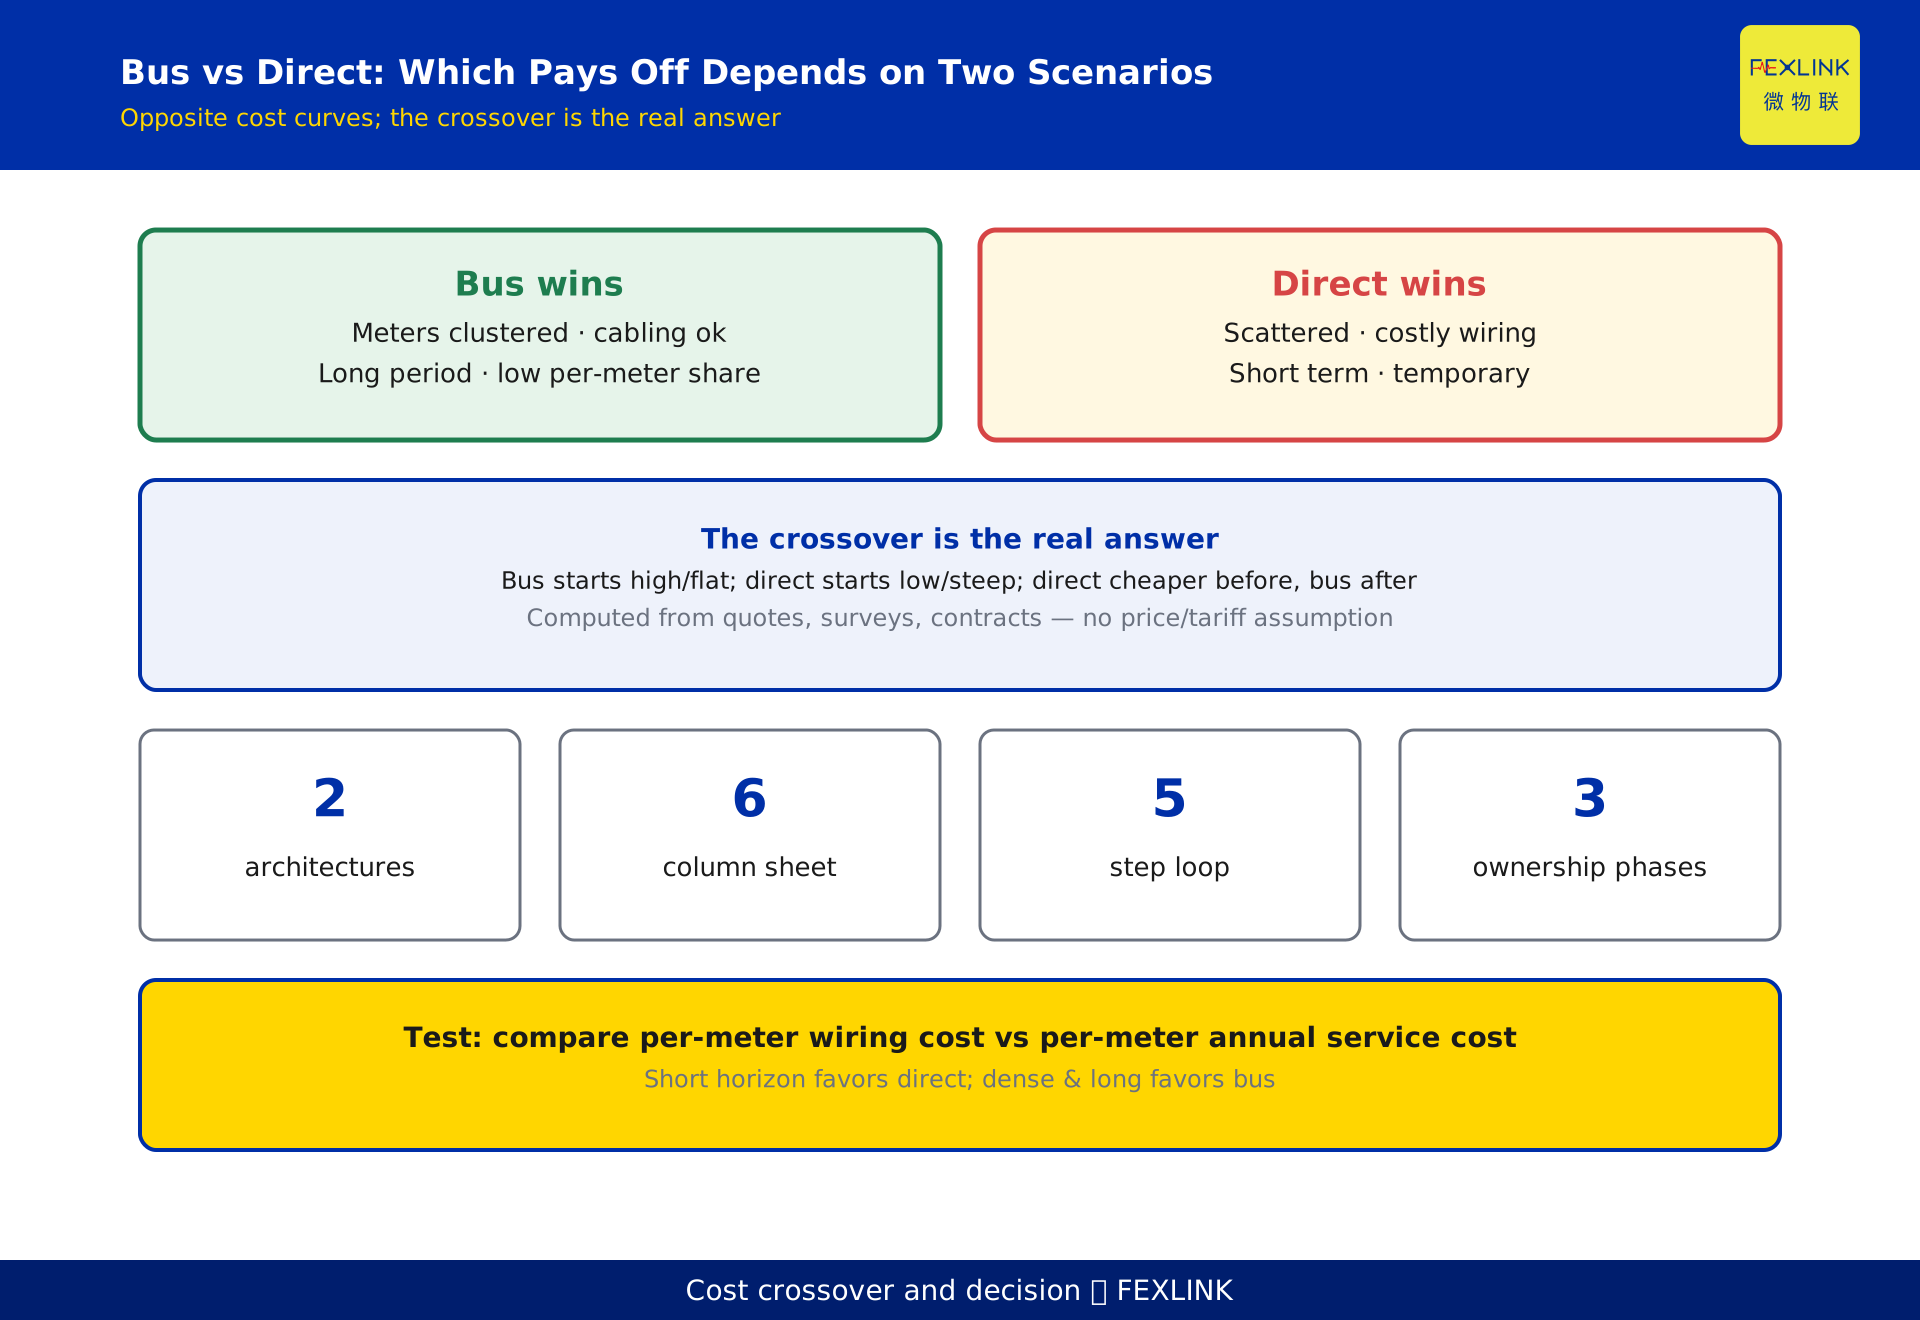
"Cheaper" is not unit-price comparison but total cost of ownership on one basis, plus the cost of failure. The two architectures have opposite cost shapes. A local RS-485 bus concentrates spend in the build phase — cable, labour and a concentrator are one-off, and adding a meter later costs little. Direct 4G at the meter removes group wiring but spreads tariff, power and truck-roll cost to every meter, every year. The decision rests on one-off per-meter wiring cost, ongoing per-meter per-year cost, and a fault-domain constraint: one broken bus link takes out a whole group, while a 4G fault hits one meter but adds more failure points. When meters are concentrated, wiring is feasible, and enough meters share a segment to absorb labour, the bus wins. When points are scattered, wiring is costly, or the horizon is short, direct upload wins. This article gives no unit prices or tariffs; it gives a comparable accounting framework.
1. Define "cheaper" as a computable quantity
Arguments stall because the basis differs: one side quotes hardware only, another folds in installation and operation, and one spreads cost over an operating horizon — so conclusions contradict.
Fix three things. Scope: list which devices, works and services on the link count toward the comparison, and who carries anything excluded. Horizon: spread ongoing cost over the same number of years and amortise build-phase spend into that window, or "cheap once" and "cheap over time" cannot meet. Granularity: reduce both totals to "per meter per year", since the schemes differ in meter count, grouping and expansion; only after normalisation are they comparable.
The usual rework is not a math error but discovering that an entire cost category was omitted — a power upgrade, or truck-roll fees for meter swaps.
2. Cost items: who pays, when
RS-485 is a shared-medium bus: many meters hang on one segment and a local concentrator forwards them upstream. Cost concentrates by group: cable and accessories, tray or conduit, laying plus outage-coordinated work, concentrator equipment, link commissioning and address planning. Most is one-off build spend that rises with distance and difficulty but is not linear in meter count — the more meters one segment covers, the less each carries.
Direct 4G at the meter drops the local group link; each meter joins the cellular network on its own. It saves group works but shifts cost to per point, per year: per-point communication tariff, independent power or battery upkeep, signal survey, SIM management, and truck-rolls to scattered points. This grows linearly with meter count across the operating life.
Common items — the meter itself, platform-side reception and store-and-forward, data alignment and register maintenance — do not enter the comparison but must be written into scope, or they get mistaken for a cost unique to one scheme. Lay the list out in three columns: one-off build / ongoing operation / common.
3. Reduce totals to "per meter per year"
The schemes differ in meter count, group count and expansion rhythm, so normalise in four steps.
One, amortise build spend across the meters covered to get one-off per-meter cost; if expansion is reserved, state whether the base is current meters or design capacity. Two, spread ongoing cost over the horizon and divide by the same meter count and years. Three, unify the time basis: turn one-off spend into an annual equivalent and book ongoing cost by year. Four, isolate the expansion increment: adding a meter on the bus is usually marginal works onto an existing link, whereas on the direct side it is a whole new point plus a new stream of ongoing cost.
The output is a recomputable worksheet. Mark any quantity you cannot obtain as "to be obtained" rather than filling an estimate, or the crossover will carry an assumption presented as a conclusion.
4. The crossover: from "which is cheaper" to "cheaper from which year"
Place the two cost curves on one axis: the bus starts high with a low slope; direct upload starts low with a high slope. Before the crossing direct upload is lower; after, the bus. That crossing is the real answer to "cheaper", driven by three inputs: one-off per-meter wiring cost, ongoing per-meter per-year cost, and the operating horizon.
If the horizon is shorter than the years at the crossing, or the points are temporary metering, direct upload's one-off advantage is hard to recover; when grouping is strong and the horizon is long, the bus tends to win. Anything steepening the slope (tariff hikes, more truck-rolls) pulls the crossing earlier; anything raising the start (construction difficulty, cross-site coordination) pushes it later.
This article provides no unit price, tariff, distance limit, node limit or specific years. The crossing must come from project quotes, site survey records and contract terms; an industry average matches no real site and destroys recomputability.
5. Fault domain: how many meters one break takes down
What is comparable is the fault domain: how many meters' data a single failure affects.
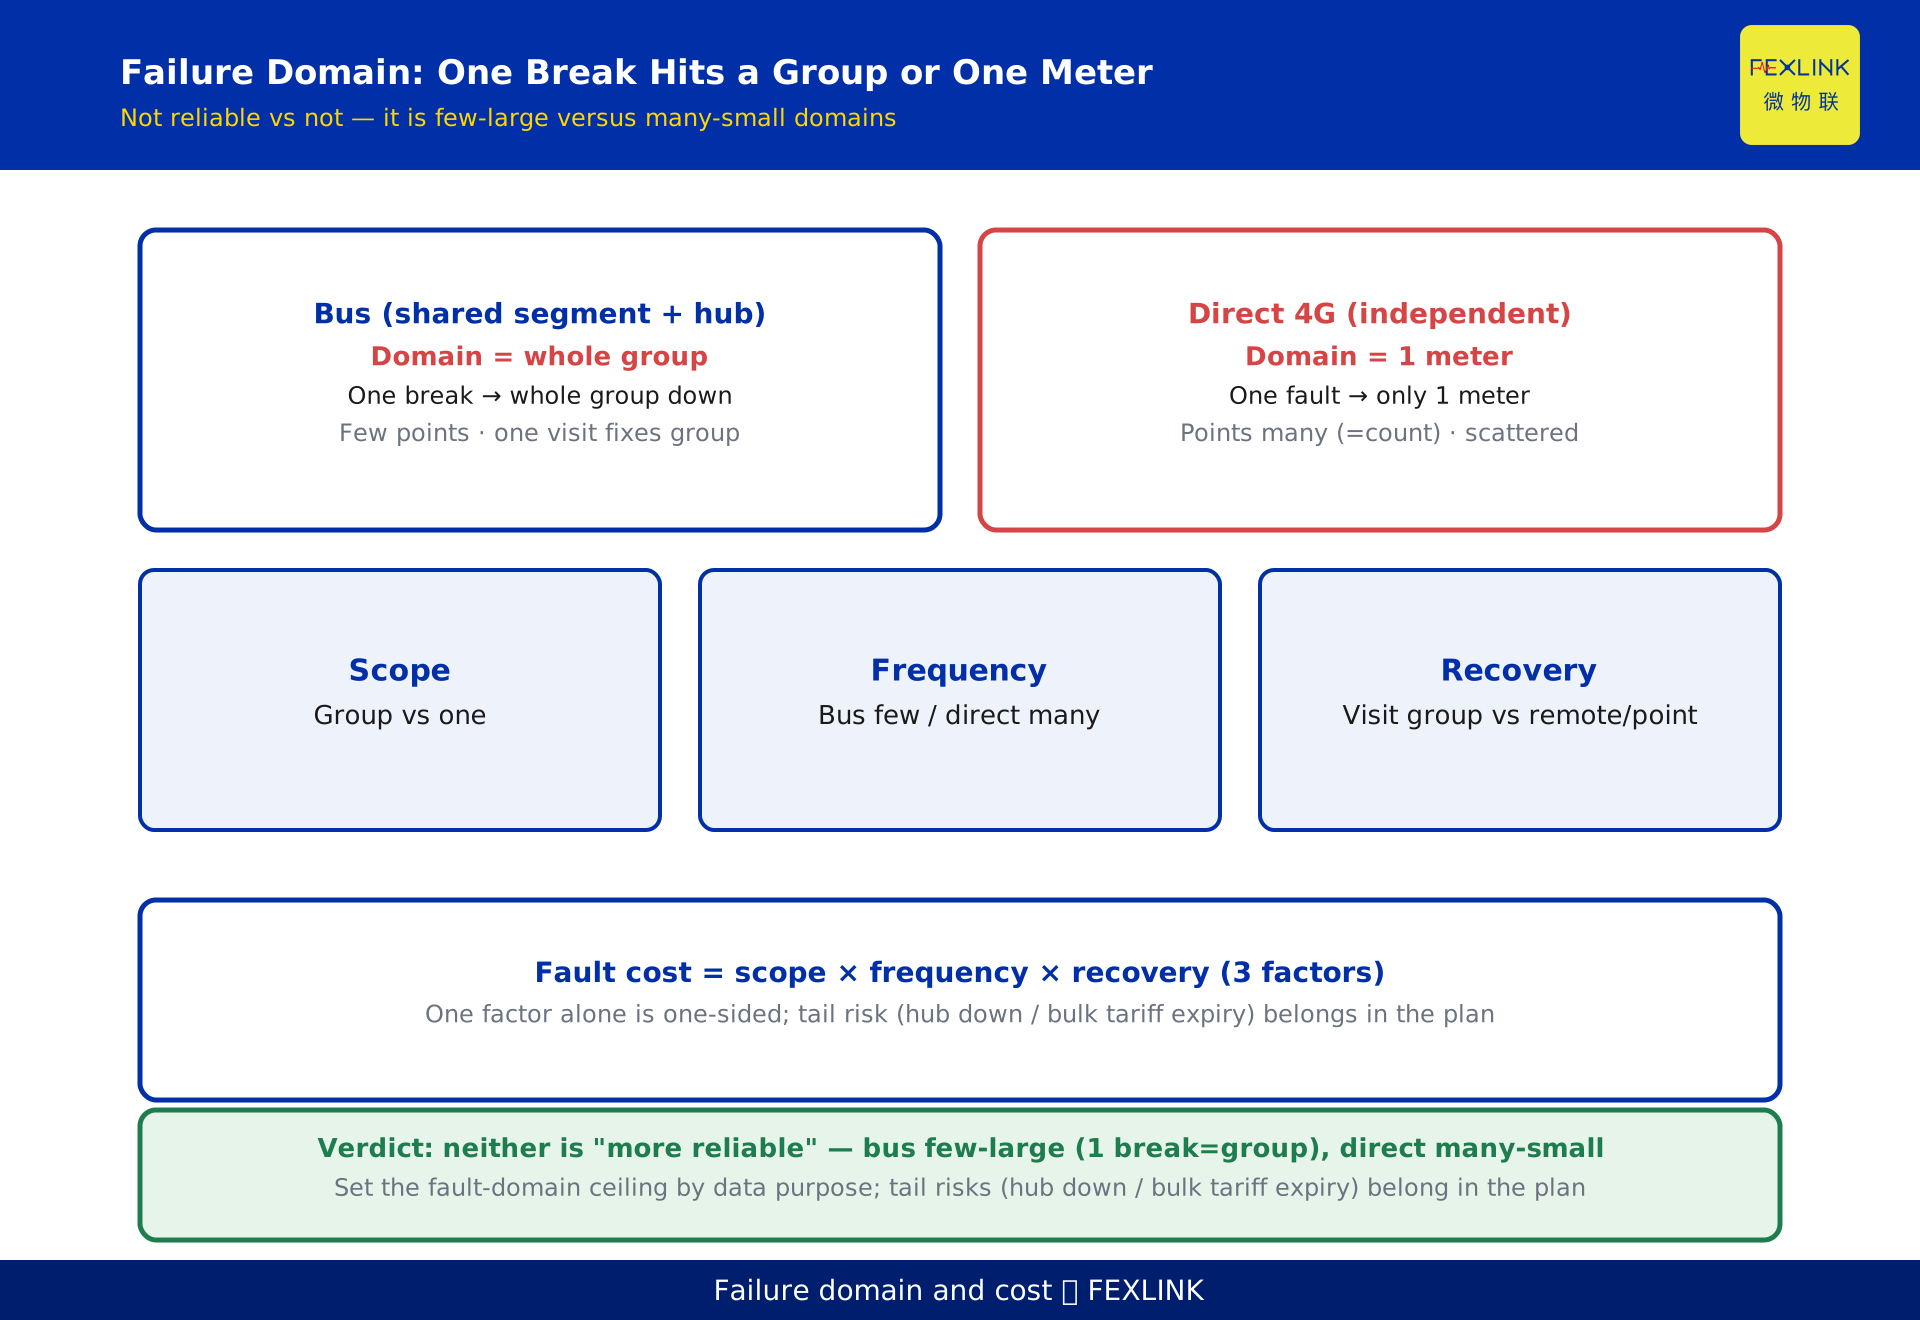
On the bus, meters share the link and concentrator. A link break, concentrator failure, power anomaly or address conflict hits the whole group; the upside is few failure points and a short path. On direct upload each point is independent, so a SIM lapse, a module fault or local signal decay usually affects one meter; the price is that failure points number in the same order as meters, and locating and truck-rolling rise with point count.
So it is not "reliable vs unreliable" but "few and large" vs "many and small" fault domains. For settlement data, losing a group is harder to backfill because one event wipes a whole reconciliation interval; for scattered monitoring points, per-point failure is easily covered by single-point re-collection. Write the data purpose first, then set the acceptable fault-domain ceiling.
6. Three factors of fault cost: blast radius, frequency, recovery time
Blast radius is the meters one event touches — on the bus it is set by group size, on direct upload usually a single point. Frequency tracks device count, environment and network: the bus has few shared devices so few events; direct upload has many points so many events, each small. Recovery time depends on whether a site visit is needed, whether spares are generic, and whether local caching with store-and-forward can bridge the break; the bus is mostly one visit to fix a group, while direct upload may be handled remotely or point by point.
The three multiply into the rough shape of fault cost; comparing only one yields a one-sided conclusion. More critical is the worst case, not the average: concentrator failure can stall a whole group, and batch tariff expiry or a platform misconfiguration can drop direct upload offline all at once. Both tail risks belong in the contingency plan.
7. Where the hidden costs actually land
Bus-side hidden cost sits in build and change phases: point ownership and address planning before grouping, link commissioning for polarity and termination matching, later link rework for expansion, cross-building coordination, and the power and environment works to keep the concentrator alive. If these one-off items sit in different work packages they are easy to miss during comparison.
Direct-upload hidden cost sits in operation: SIM lifecycle management, tariff and plan changes, re-survey after signal shifts, battery or power-part replacement, truck-roll labour, and platform overhead of many independent connections. Each line is small, but multiplied by point count and years it often decides where the crossing lands.
Keeping the two ledgers separate beats a vague "operations cost": different phases, parties and evidence.
8. The worksheet: a 6-column list and a 5-step loop
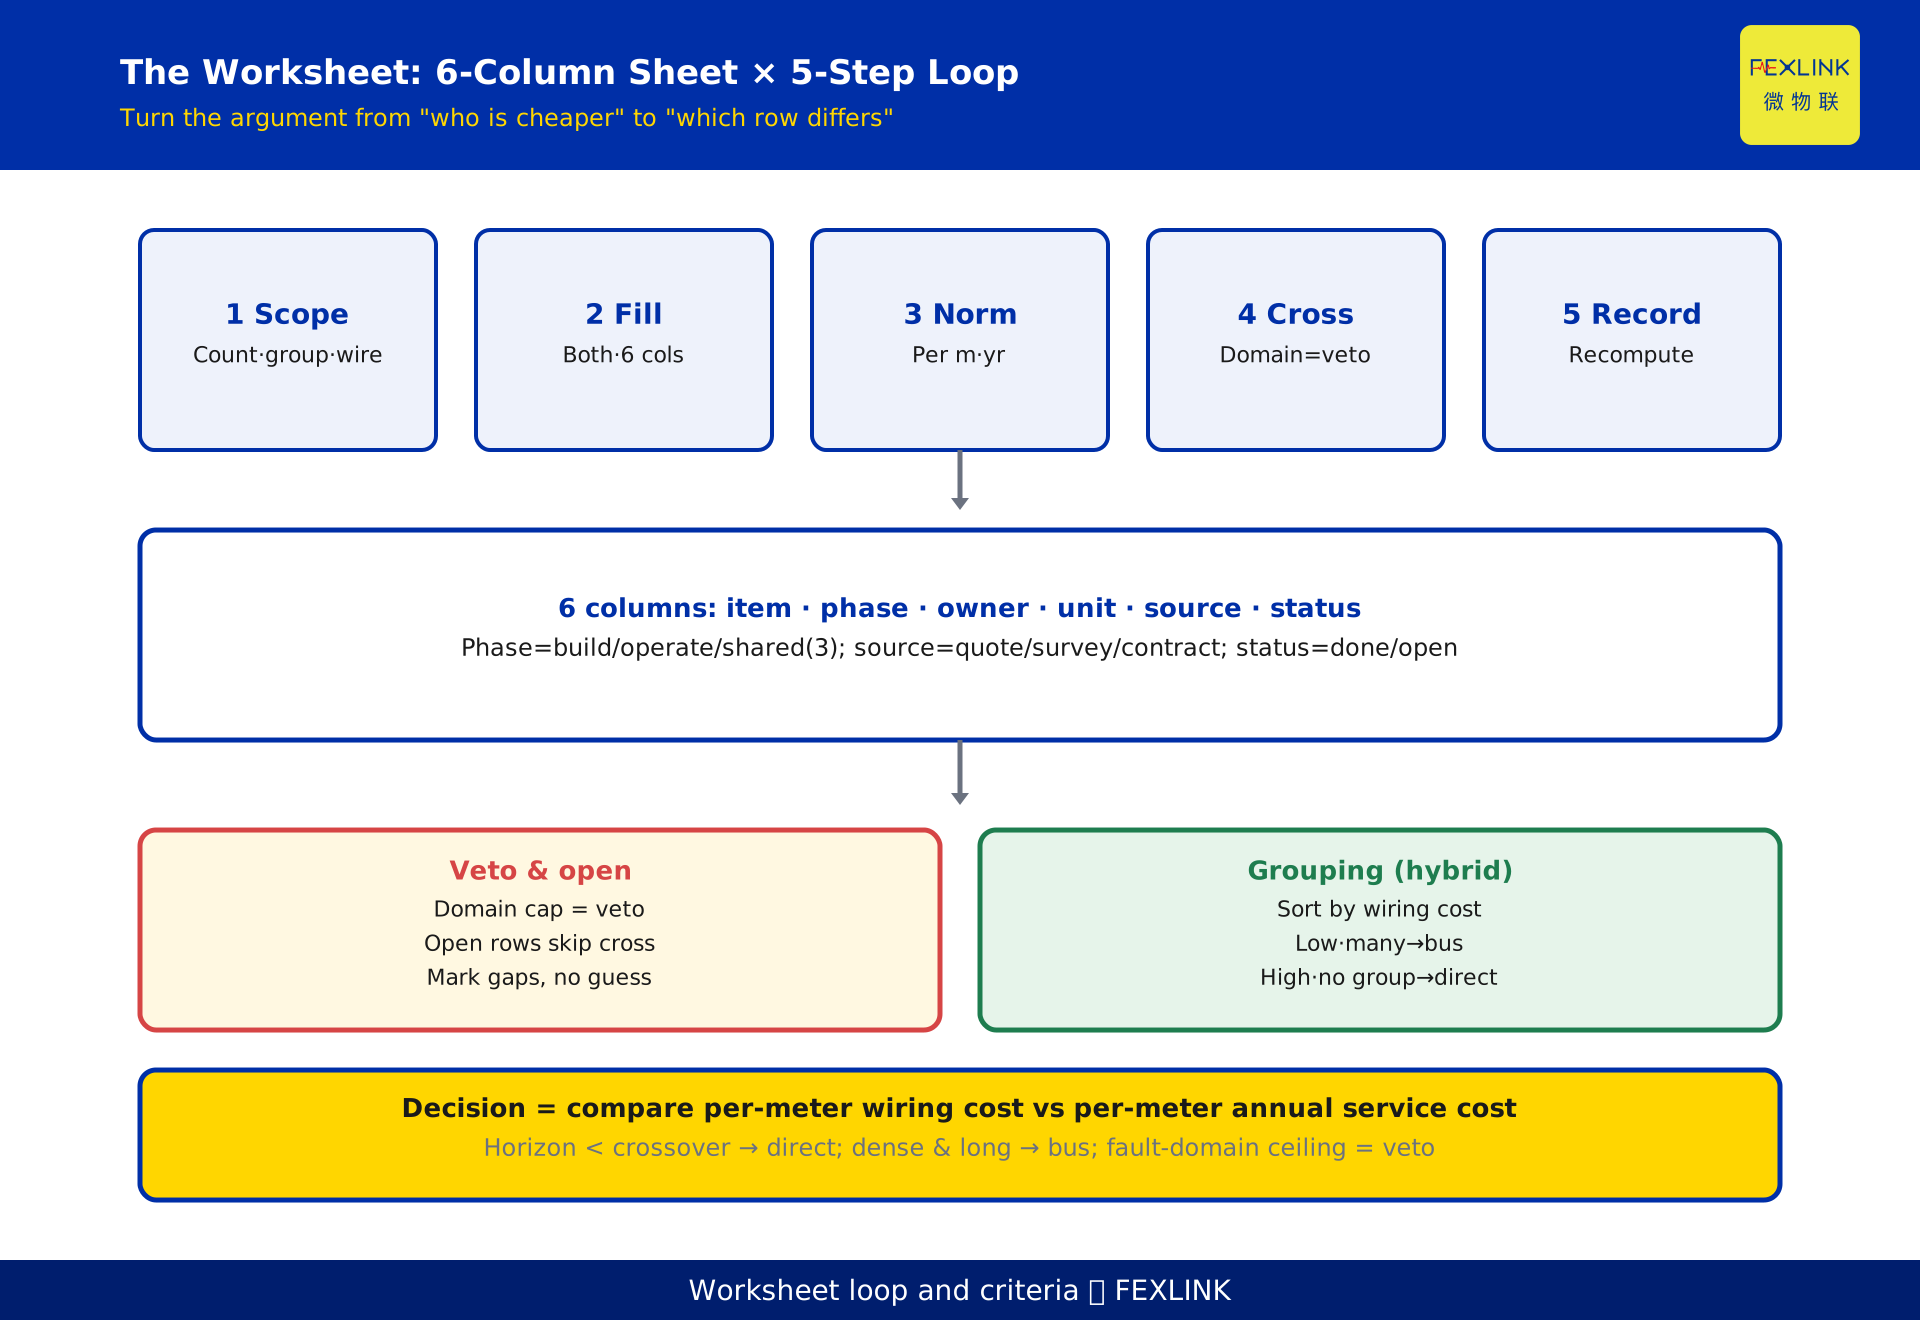
The worksheet has six columns: cost item, ownership phase (build / operation / common), responsible party, unit of measure, source of value, status (obtained / to be obtained). The first four guarantee comparability, the last two guarantee recomputability — "source of value" must point to a written quote or contract clause, never "industry experience"; "to be obtained" items do not enter the crossover calculation.
The five-step loop: one, inventory meter count and grouping; two, fill both schemes' cost items across the six columns, flagging gaps as to-be-obtained; three, normalise to per-meter per-year and list the expansion increment; four, compute cumulative cost and the crossing, with the fault-domain ceiling as a veto item; five, leave a trace of conclusion, assumptions and open items for owner and integrator confirmation, then recompute once completed.
The worksheet turns the argument from "I heard which is cheaper" into "which column differs"; when conclusions clash, compare columns.
9. Hybrid is not a compromise: group by crossing and fault-domain ceiling
Hybrid is often written as "can't decide, use half each", which is no conclusion. The trigger is: the site can be split into subsets where each subset's per-meter wiring allocation and fault-domain ceiling fall on opposite sides of the crossing, so grouping beats forcing one scheme across the project.
Rank by per-meter wiring cost after grouping, not merely by physical distance. Subsets with low allocation, many meters in a group, and continuous settlement data go to bus aggregation; subsets with high allocation, no grouping possible, or where a single truck-roll costs more than the data is worth, go to direct upload. In one plant retrofit, grouped meters in the main switchroom and scattered temporary metering at the boundary were placed in two subsets and compared separately. Each group records its crossing inputs and fault-domain ceiling, aligned on one platform for naming, timestamps and break store-and-forward.
This article and the same-series networking-selection guide divide labour: that one answers "how many link segments, how to configure each"; this one answers "of the two architectures, which pays off on lifecycle and fault cost, and where is the line". The two chain together; they should not substitute.
Products appear only as role references: FEXLINK CW-C1 (RS485 + Ethernet) is local access and wired backhaul after bus aggregation, while the ESX-series 4G gateways and SFA-G (4G meter) are cellular uplink and meter-side direct upload. Model names and capabilities are enterprise-disclosure and form no basis for price, performance or applicability.
FAQ
Q: Can you just give a threshold like "use the bus above N meters"?
No. Per-meter wiring allocation depends on distance, site conditions and coordination cost; the same meter count can land on either side of the crossing at different sites. A fixed threshold merely presents an assumption as a conclusion.
Q: More direct-upload points — does that make it less worthwhile?
Ongoing cost does trend up with point count, but only if per-meter wiring allocation is not higher. When wiring cost is extreme or the horizon is short, many points can still favour direct upload. The test is the two columns of values, not the point count.
Q: A bus break loses a whole group of data — isn't that less reliable than direct upload?
Compare blast radius, frequency and recovery time together. The bus has few failure points and one visit fixes a group; with local cache store-and-forward the gap can be backfilled. Direct upload has small individual impact but many events. Decide by fault-domain ceiling and data purpose.
Q: Won't hybrid mean paying both sides and ending up worse?
Hybrid saves only when the grouping rationale is the crossing inputs; if you split "because you couldn't decide", you may carry both sides' fixed investment. After grouping, recompute each group's cumulative cost against both pure schemes.
Q: What if the quote gives no written tariff or truck-roll figures?
Mark that column "to be obtained", output the comparison range with assumed boundaries and the open-item list, and fill no estimates. Values come from written quotes, survey records and contract terms; recompute once completed, and do not put open items into selection or acceptance documents before they are cleared.
Scope and limitations
This article applies to automatic metering projects choosing between local RS-485 bus centralized collection and meter-side 4G direct upload. It targets project owners and system integrators, and builds a recomputable cost and fault-domain worksheet at the selection stage; it is not for procurement or acceptance decisions.
This article provides no specific values for unit price, tariff, power, communication distance, node limit, operating years, failure rate or recovery time: the repository holds no checkable primary quotes, and these quantities vary with site and contract. Values must return to written quotes, survey records, contract clauses and commissioning tests; the discount rate and financial basis are project-specific. This article has no associated standards, makes no standard-number reference, cites no clauses, and performs no conformance judgement.
The method is engineering induction and constitutes no investment commitment, reliability guarantee or universal recommendation for either architecture. Examples are desensitised scenarios. The names and capabilities of CW-C1 (RS485 + Ethernet), the ESX-series 4G gateways, SFA-G (4G meter) and the edge-gateway multi-protocol access system are enterprise-disclosure level and serve only as role references; they do not enter conclusions, selection advice or acceptance criteria. This article only explains a method; it does not rewrite existing design documents, the topic statement or the project register, and does not negate the segmenting basis of same-series articles. All deliverables are DRAFT_PENDING_REVIEW, require independent review, and are not self-approved by the generator.
Frequently Asked Questions
Can you just give a threshold like "use the bus above N meters"?
No. Per-meter wiring allocation depends on distance, site conditions and coordination cost; the same meter count can land on either side of the crossing at different sites. A fixed threshold merely presents an assumption as a conclusion.
More direct-upload points — does that make it less worthwhile?
Ongoing cost does trend up with point count, but only if per-meter wiring allocation is not higher. When wiring cost is extreme or the horizon is short, many points can still favour direct upload. The test is the two columns of values, not the point count.
A bus break loses a whole group of data — isn't that less reliable than direct upload?
Compare blast radius, frequency and recovery time together. The bus has few failure points and one visit fixes a group; with local cache store-and-forward the gap can be backfilled. Direct upload has small individual impact but many events. Decide by fault-domain ceiling and data purpose.
Won't hybrid mean paying both sides and ending up worse?
Hybrid saves only when the grouping rationale is the crossing inputs; if you split "because you couldn't decide", you may carry both sides' fixed investment. After grouping, recompute each group's cumulative cost against both pure schemes.
What if the quote gives no written tariff or truck-roll figures?
Mark that column "to be obtained", output the comparison range with assumed boundaries and the open-item list, and fill no estimates. Values come from written quotes, survey records and contract terms; recompute once completed, and do not put open items into selection or acceptance documents before they are cleared.