 FEXLINK Research Institute
The short answer
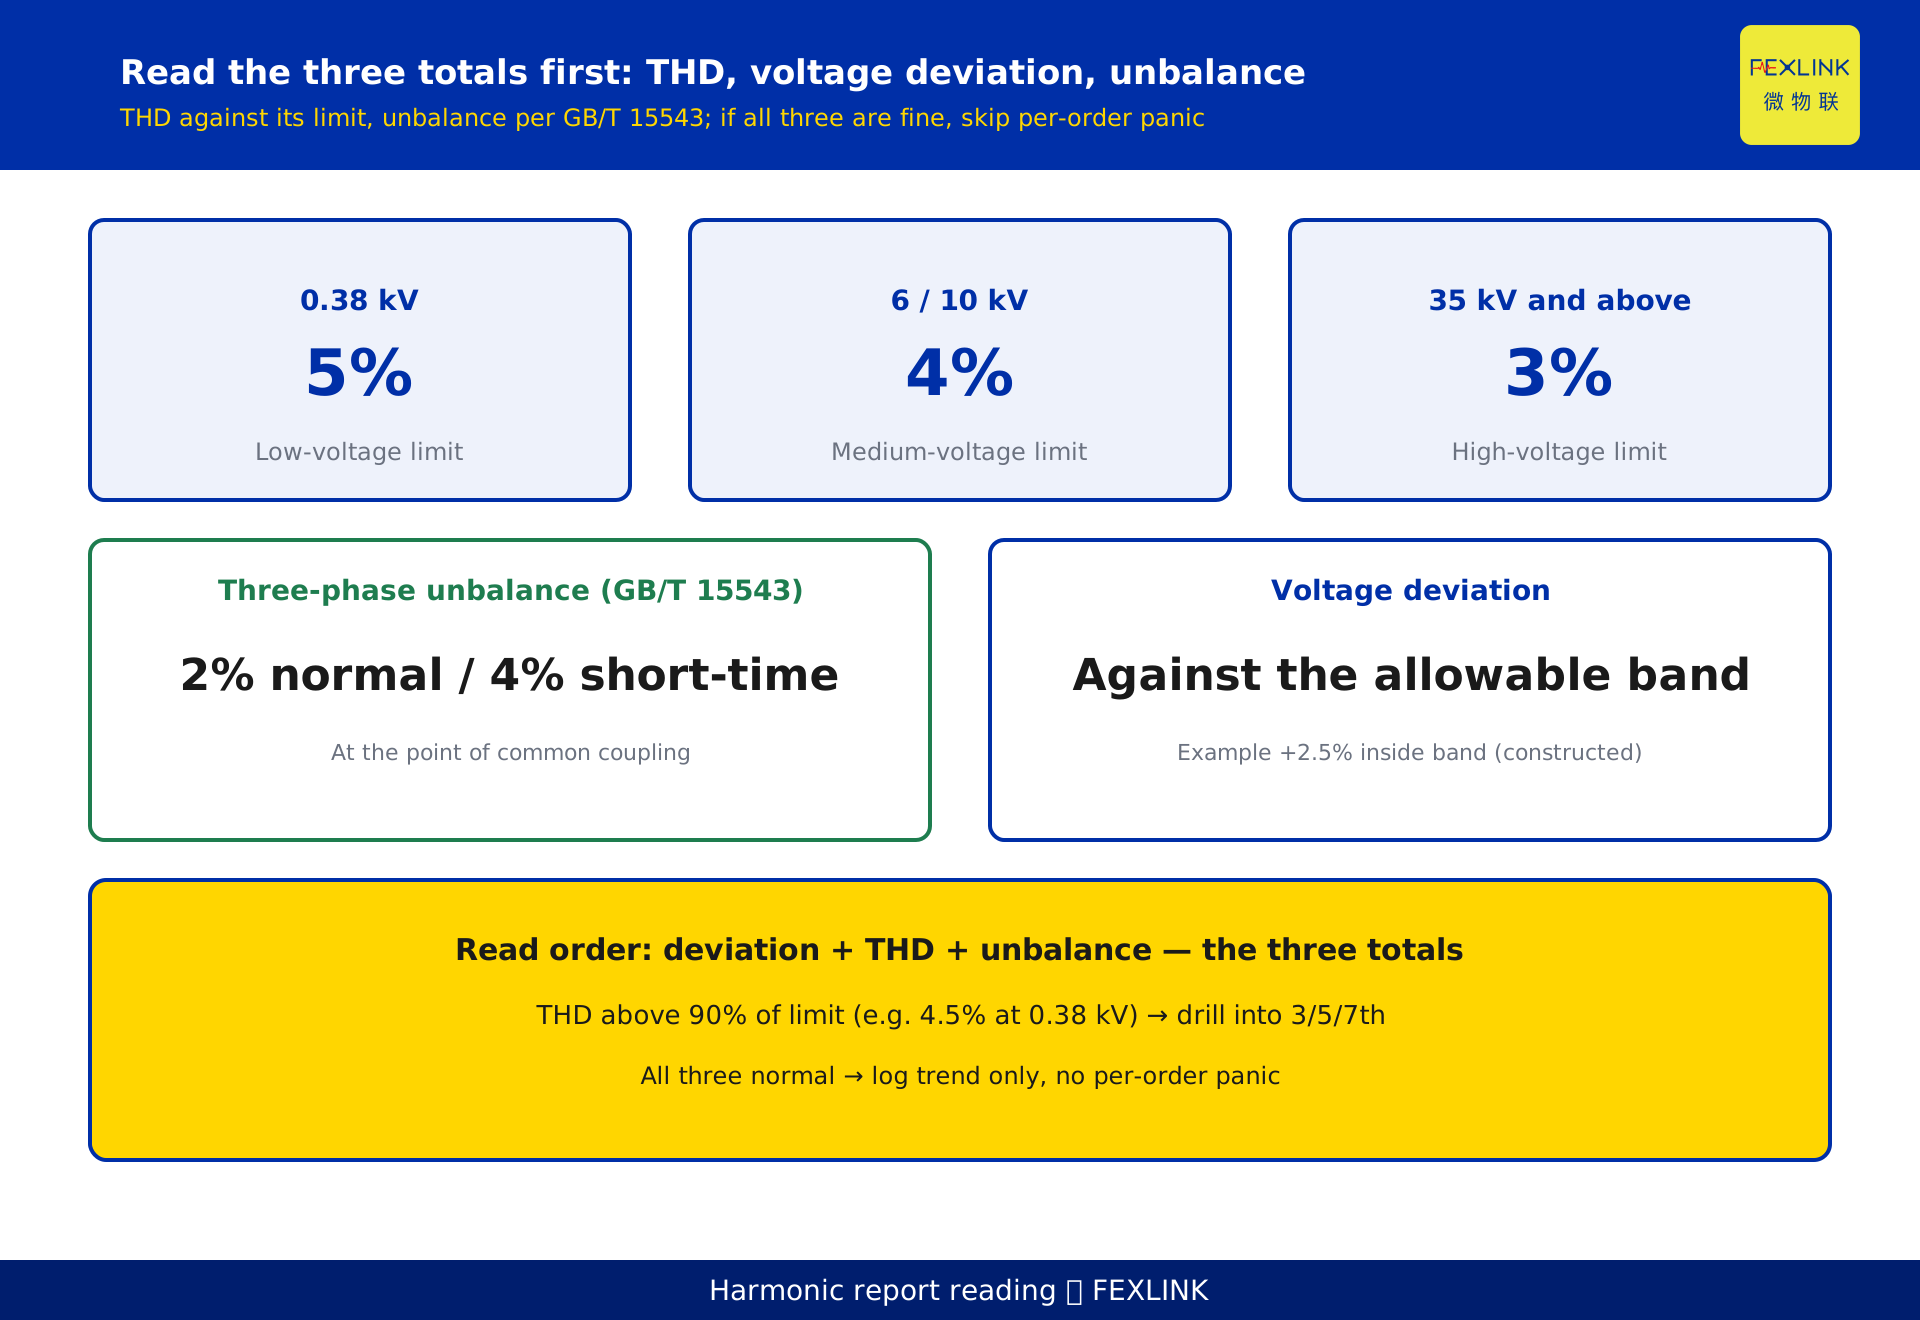
Do not let a power-quality report full of numbers scare you. Read it in the right order: totals first, individual orders second. Use voltage deviation, THD and the three-phase unbalance ratio to decide whether anything is wrong; if the totals are within limits, you rarely need to panic over individual harmonic orders. THD alarm lines follow GB/T 14549-1993 by voltage class: 5% at 0.38 kV, 4% at 6–10 kV, 3% at 35 kV and above. The unbalance ratio follows GB/T 15543: 2% normal, 4% short-time at the point of common coupling. Once a total approaches its limit, drill into the 3rd, 5th and 7th harmonics to locate the source.
1. Priority of indicators: totals before orders
A power-quality report packs dozens of quantities onto one page, and readers swing between two extremes — panic over every figure, or stop reading entirely. The fix is to read in two layers.
The first layer is totals: voltage deviation, voltage total harmonic distortion (THD) and three-phase voltage unbalance. These three judge whether anything is wrong; compare them with their limits and, in most cases, you can already qualify the system's health.
The second layer is per-order: the 2nd through 31st harmonic distortion, zero-sequence and negative-sequence components. Their job is to locate the source after something is wrong, not to manufacture anxiety.
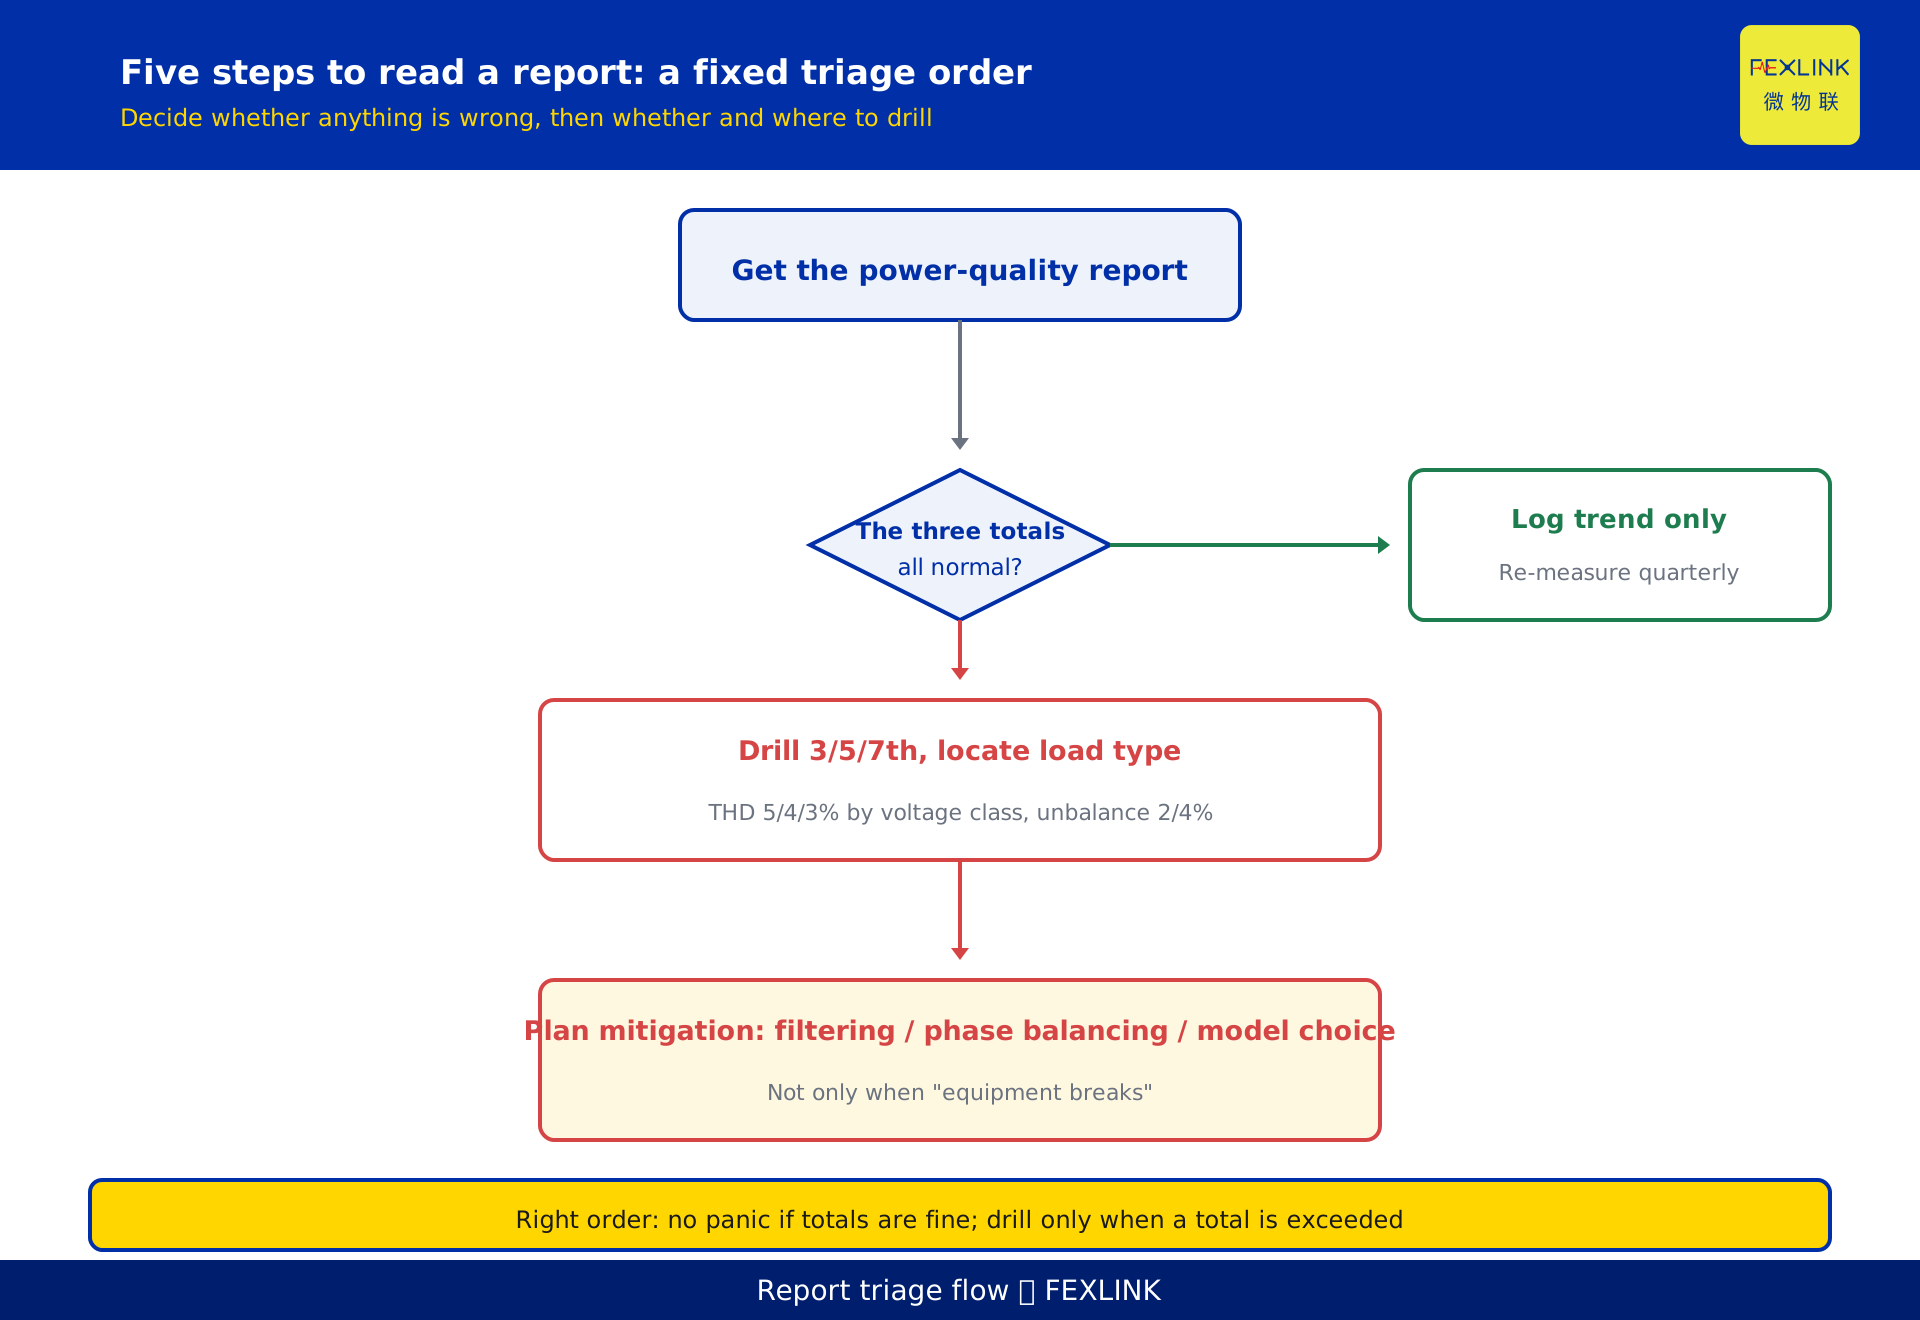
So the first step is not to hunt for the largest harmonic order, but to check whether the three totals are within limits. If they are, log per-order data as trend; if one approaches or crosses its limit, drill into the orders to find which dominate. This order alone removes about 80% of needless panic.
2. When is THD an alarm: matching the limits
THD (Total Harmonic Distortion) is the aggregate of harmonic content in voltage (or current) relative to the fundamental. It is most often misread as "lower is always better, and any absolute value triggers an alarm". In reality it only means something when compared with the limit for its voltage class.
The headline limits for harmonic voltage (phase voltage) THD, per GB/T 14549-1993, are:
- 0.38 kV low-voltage network: 5%
- 6 kV / 10 kV network: 4%
- 35 kV and above network: 3%
Three caveats. First, these are voltage THD limits, not current harmonic limits; GB/T 14549's per-order current allowable values depend on short-circuit capacity, voltage class and the user's agreed contract capacity, far too complex to reproduce here — use the effective standard text for specific values. Second, the higher the voltage class, the tighter the limit, because harmonics on the high-voltage side spread across the whole network. The headline values cited here follow GB/T 14549-1993; for a real project, confirm the effective edition and the local utility's technical agreement.
A practical rule: THD within 70% of the limit is the relaxed zone, 70%–90% is the watch zone, and above 90% you should prepare to drill into the orders and plan mitigation. For the 0.38 kV limit of 5%, THD above 3.5% (70%) deserves attention, and above 4.5% (90%) you should trace the source.
3. Harmonics 2nd–31st: what the report actually shows
Reports commonly list harmonics up to the 2nd–31st (orders 2 through 31, even and odd). Why stop at 31? The engineering consensus is that covering 2nd–31st already captures the harmonic signature of virtually all non-linear loads; higher orders (33rd and above) drop sharply in magnitude and impact, so routine assessment does not need to list them all.
Even-order harmonics (2, 4, 6 …) are normally tiny. If an even order stands out, it often signals asymmetry, arc-type loads or a measurement anomaly — itself a signal worth flagging separately. Among odd orders, the 3rd and its multiples (3, 9, 15 …) are zero-sequence in nature, while 5, 7, 11, 13 are negative/positive-sequence — the basis for inferring load type from the dominant order.
You do not need to watch every order. Focus on the big ones: 3, 5, 7, 11, 13. Of these, the 3rd, 5th and 7th appear most often and are easiest to trace.
4. What loads typically cause the 3rd, 5th and 7th
This is the key increment of report reading — translating a "number" into a "load". The engineering-consensus correspondence is:
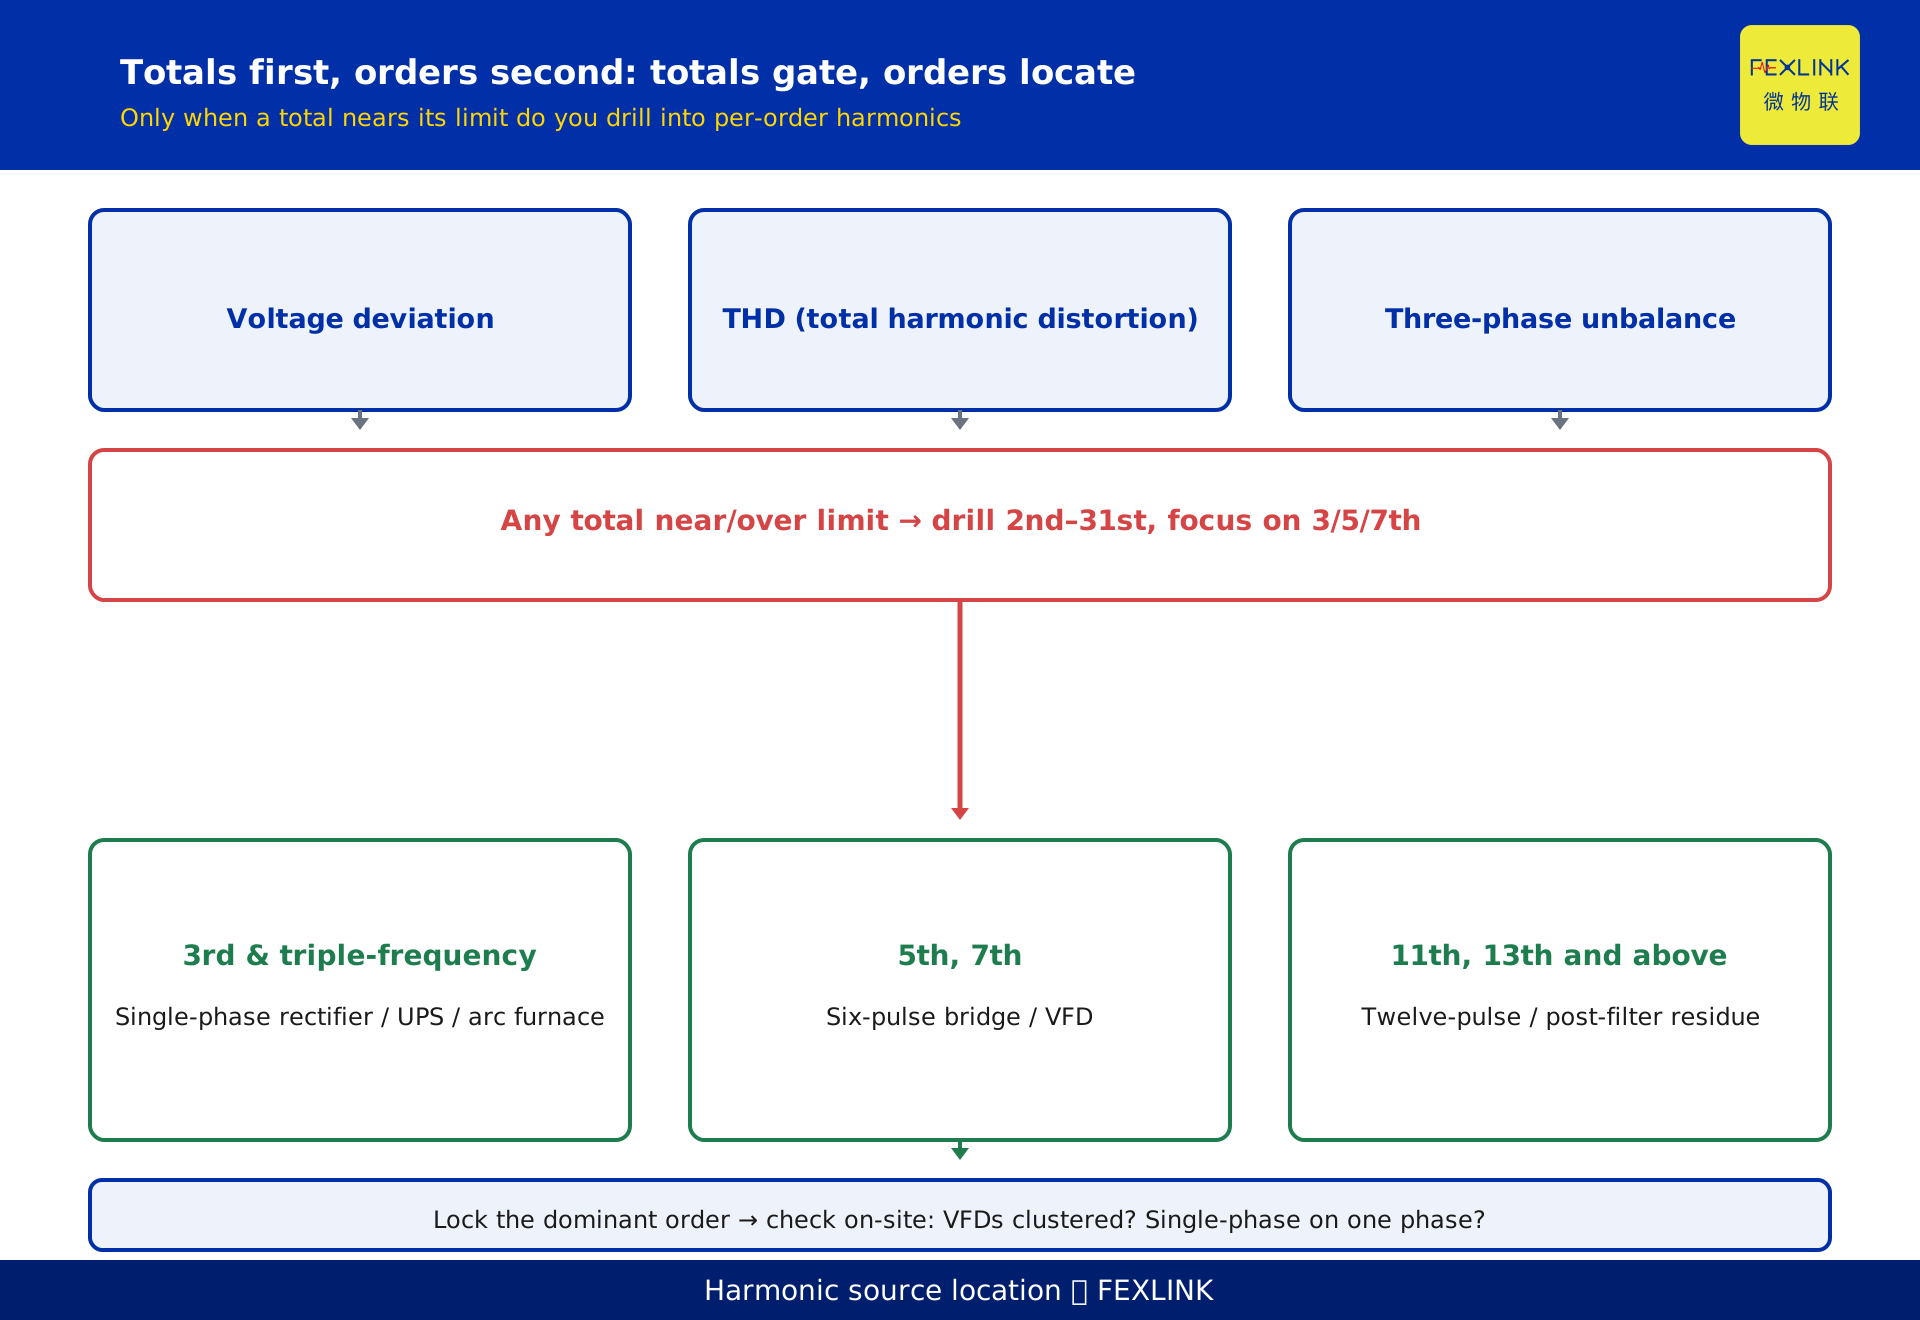
- 3rd and triple-frequency harmonics (3, 9, 15 …): often produced by single-phase rectifiers, switched-mode power supplies, UPS and electric-arc furnaces — unbalanced three-phase or large single-phase loads. They make three-phase currents asymmetric; the zero-sequence harmonics stack on the neutral and are the classic cause of neutral overheating.
- 5th and 7th harmonics: often produced by three-phase six-pulse rectifier bridges, typically variable-frequency drives, AC-DC-AC transmissions, DC supplies and large controlled rectifiers. A six-pulse rectifier's signature is 5, 7, 11, 13, with 5 and 7 the largest.
- 11th, 13th and above: more typical of twelve-pulse and higher rectification, larger AC-DC-AC equipment, or the residue after some filtering.
So if the 3rd stands out, check whether single-phase loads are too heavy and whether neutral current is high; if the 5th and 7th stand out, check VFD/rectifier operation and whether reactors or filters were fitted. That is the concrete handle of "locate the source by order".
5. Reading the unbalance ratio and which standard applies
Unbalance is usually split into voltage and current unbalance. The "three-phase unbalance ratio" most often seen in reports is the ratio of negative-sequence to positive-sequence component of voltage (or current), expressed as a percentage. The governing standard is GB/T 15543 "Power quality — Three-phase voltage unbalance" (current edition GB/T 15543-2008).
GB/T 15543 sets the voltage unbalance at the point of common coupling at 2% normal and not exceeding 4% short-time (e.g. during motor starting). Current unbalance must be judged together with transformer capacity, conductor thermal rise and equipment tolerance; there is no single universal headline limit like there is for voltage, so use the equipment rating and site operating rules.
A practical rule: if voltage unbalance stays above 2% long-term, check the three-phase load distribution; above 4% is the upper edge of short-time allowance, and sustained values should be treated as abnormal and scheduled for correction. Unbalance and the 3rd harmonic are often siblings — both come from three-phase asymmetry — so they frequently appear together in the same report and can be investigated jointly.
6. Combined judgement across three fields: what to read first
Put the three pieces together and you get a fixed "combined judgement order" for any report:
- Voltage deviation: first see whether voltage has left the allowable band; large deviation alone triggers protection misoperations and equipment problems.
- THD: compare with the limit for its voltage class (0.38 kV 5% / 6–10 kV 4% / 35 kV 3%) to decide whether the totals are at risk.
- Three-phase unbalance ratio: compare with GB/T 15543 (2% normal, 4% short-time) to judge asymmetry.
- Per-order harmonics: if the first two steps are both relaxed, log orders as trend only; if a total approaches its limit, focus on which of the 3rd/5th/7th dominates.
- Source and mitigation: from the dominant order, infer the load type and pick the mitigation handle.
The core of this order is "totals before orders" — if the totals are within limits, fancy per-order values are not urgent; if a total is exceeded, the orders tell you why.
7. How products make it operational: from report to action
Reading the report is not the end; operationalising it is. To turn the method above into sustainable operation, devices must collect the data steadily and harden the rules.
The ESE power-quality monitor continuously and long-term collects voltage, current, per-order harmonics and unbalance at key busbars and circuits, and emits structured reports so the "totals before orders" rule has data to run on. The FSE power-quality measurement and control unit adds control on top of monitoring, and can take part in local mitigation or interlocking once the harmonic or unbalance source is confirmed. Together they upgrade "reading meters by hand" into "rule-based screening".
Above that, the solution layer uses the Taiyi central-control hub Qianzhi engine M06-M12 power-quality check-up to aggregate multi-point reports, run same-period benchmarking and trend alerts, and give a first-cut verdict — totals within limits or not, which order dominates, likely source — for a human to confirm. Model, range and communication interface are customisable options per the selection manual; the products do not make the compliance decision, they only run the data logging and the rules.
8. Constructed example: how to read an anonymised report
All figures below are constructed to illustrate the method, anonymised, representing no real customer, campus or project; they are not a compliance decision or dispute evidence.
Suppose a campus 0.4 kV low-voltage switchroom monthly report reads: voltage deviation +2.5% (inside the allowable band); voltage THD 4.2% (below the 0.38 kV 5% limit, relaxed zone); three-phase voltage unbalance 1.8% (below the GB/T 15543 2% normal, close but not exceeded); among per-order harmonics, 5th at 3.6%, 3rd at 1.9%, 7th at 1.1%, everything else below 1%.
Read in the order above: the three totals (deviation, THD, unbalance) are all inside their headline limits — conclusion: no obvious limit event overall, no need to panic. Drill into the orders: the 5th at 3.6% is the largest; given "5th often comes from a six-pulse rectifier bridge", you may suspect VFDs or rectifier-type loads on site; but since it does not push THD over the limit, log it as a watch item and re-measure quarterly rather than launch a mitigation project now.
This example shows the method, not any real site: clear the three totals first, then drill only if needed, and infer the source from the dominant order.
FAQ
Q: The report lists a long string of harmonic orders — which should I watch?
Watch the 3rd, 5th and 7th first; they are the largest, most common and easiest to trace. The 3rd points to asymmetric loads like single-phase rectifiers, UPS and arc furnaces; the 5th and 7th point to VFD six-pulse rectifier bridges. Log the rest as trend; do not panic over every order.
Q: Is lower THD always better, and at what value should it alarm?
It is not an absolute-value alarm; it is matched to the voltage-class limit per GB/T 14549-1993: 5% at 0.38 kV, 4% at 6–10 kV, 3% at 35 kV. The practical rule is relaxed below 70% of the limit, watch zone 70%–90%, drill and plan mitigation above 90%. Specific limits follow the effective edition.
Q: The unbalance ratio and the 3rd harmonic are always high together — is that normal?
Very common, and they are siblings — both come from three-phase asymmetric loads (large single-phase loads, rectifiers, arc types). GB/T 15543 sets voltage unbalance at 2% normal, 4% short-time; above 2% long-term you should check the load distribution and look at the 3rd harmonic at the same time. Investigating them together is more efficient.
Q: Can I just copy GB/T 14549's per-order current allowable table into the article?
Not recommended. That table depends on short-circuit capacity, voltage class and agreed contract capacity, and is too complex to copy safely; this article cites only the voltage THD headline limit and points to the standard text. Per-order current allowable values follow the effective standard and the local utility's technical agreement.
Q: Is one monitor enough?
It depends on what you want to see. To view a single overall point, one ESE power-quality monitor at a key location suffices; to locate specific load sources you need multiple points on major feeders and suspected load circuits, combined with the local capability of the FSE power-quality measurement and control unit. The layout follows the site topology and selection manual.
Scope and limitations
- This is a parameter and data interpretation article: how to read the numbers on a power-quality report, what to read first, and the limit/source mapping. Its increment is the indicator priority (totals before orders) plus limit mapping plus load-source location; it does not re-derive how harmonics are computed (that is KD-0502's FFT–THD principle).
- Standards: the THD headline limits 0.38 kV 5% / 6–10 kV 4% / 35 kV 3% come from GB/T 14549-1993; the unbalance 2% normal / 4% short-time comes from GB/T 15543-2008. Both follow the effective edition. This article does not reproduce GB/T 14549's per-order current allowable table; specific values follow the effective standard text and the local utility's technical agreement.
- The correspondences — 3rd/triple-frequency from single-phase rectifiers, SMPS, UPS, arc furnaces; 5th/7th from six-pulse rectifier bridges (VFDs, AC-DC-AC drives); harmonics covered to 2nd–31st capturing most non-linear loads — are engineering-consensus magnitudes and mappings for source-location guidance, not a replacement for per-load measurement and compliance decisions.
- All values in sections 2, 5, 6 and 8 — 5%, 4%, 3%, 2%, 4%, +2.5%, 4.2%, 1.8%, 3.6%, 1.9%, 1.1% — are constructed examples to illustrate the method, anonymised, representing no real customer, campus, project or quotation. Real judgement uses site measurements, the effective standard and equipment ratings.
- Product references (ESE power-quality monitor, FSE power-quality measurement and control unit, Taiyi central-control hub Qianzhi engine M06-M12 power-quality check-up) follow the latest product knowledge base; range, accuracy and interface are customisable options and this is not purchasing advice.
Frequently Asked Questions
The report lists a long string of harmonic orders — which should I watch?
Watch the 3rd, 5th and 7th first; they are the largest, most common and easiest to trace. The 3rd points to asymmetric loads like single-phase rectifiers, UPS and arc furnaces; the 5th and 7th point to VFD six-pulse rectifier bridges. Log the rest as trend; do not panic over every order.
Is lower THD always better, and at what value should it alarm?
It is not an absolute-value alarm; it is matched to the voltage-class limit per GB/T 14549-1993: 5% at 0.38 kV, 4% at 6–10 kV, 3% at 35 kV. The practical rule is relaxed below 70% of the limit, watch zone 70%–90%, drill and plan mitigation above 90%. Specific limits follow the effective edition.
The unbalance ratio and the 3rd harmonic are always high together — is that normal?
Very common, and they are siblings — both come from three-phase asymmetric loads (large single-phase loads, rectifiers, arc types). GB/T 15543 sets voltage unbalance at 2% normal, 4% short-time; above 2% long-term you should check the load distribution and look at the 3rd harmonic at the same time. Investigating them together is more efficient.
Can I just copy GB/T 14549's per-order current allowable table into the article?
Not recommended. That table depends on short-circuit capacity, voltage class and agreed contract capacity, and is too complex to copy safely; this article cites only the voltage THD headline limit and points to the standard text. Per-order current allowable values follow the effective standard and the local utility's technical agreement.
Is one monitor enough?
It depends on what you want to see. To view a single overall point, one ESE power-quality monitor at a key location suffices; to locate specific load sources you need multiple points on major feeders and suspected load circuits, combined with the local capability of the FSE power-quality measurement and control unit. The layout follows the site topology and selection manual.