 FEXLINK Research Institute
The short answer
Maximum demand is a basis for the basic charge on your bill: it equals the largest value among all "average powers over a defined interval (commonly 15 minutes)" within a billing period. To read demand from a meter, the point is not total consumption but finding the few 15-minute windows whose average power was pushed highest. Under a two-part tariff the basic charge can be billed on transformer capacity or on maximum demand, and you pick whichever is lower. Read the meter's demand curve and demand registers, locate the peak window, and stagger the load — that directly cuts the billed demand.
1. The basic charge has two formulas: capacity or demand
Large industrial and most high-voltage commercial users are on a two-part tariff: bill = energy charge + basic charge (plus a power-factor adjustment and surcharges). The basic charge itself has two formulas, and the user usually chooses one:
- On transformer capacity: basic charge = capacity (kVA) × capacity rate (CNY per kVA per month).
- On maximum demand: basic charge = billed demand (kW) × demand rate (CNY per kW per month).
Both target the same transformer and the same load, yet the result can differ by tens of thousands. The only rule that matters: compute both bills and take the lower one. Actual rates come from the local utility's current retail tariff schedule; do not borrow numbers from other regions or past years.
2. How maximum demand is computed: the 15-minute sliding window
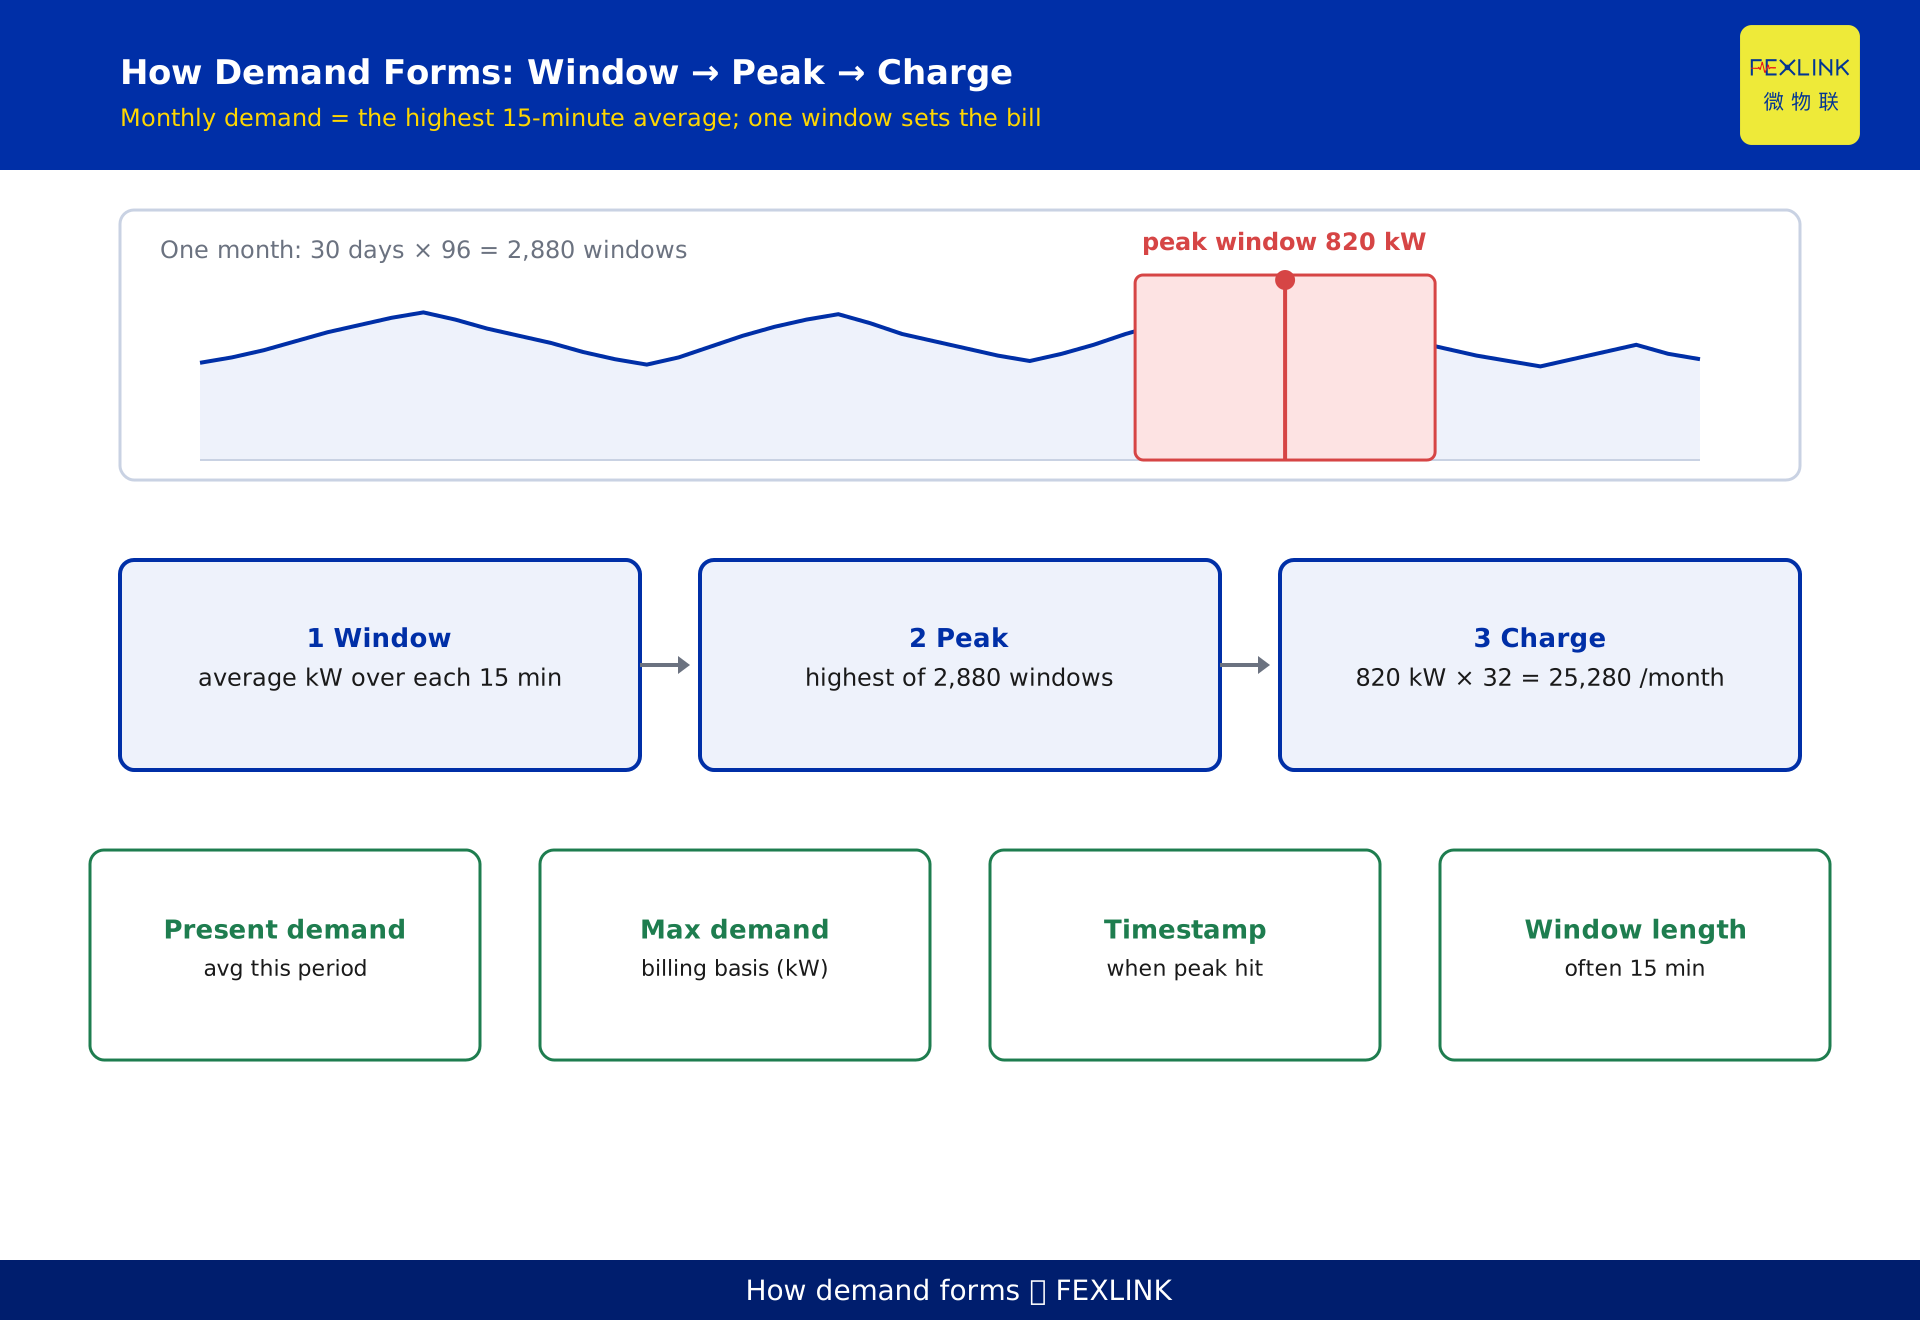
"Maximum demand" is not the peak of instantaneous power; it is the peak of a "windowed average." The common practice is the 15-minute sliding window:
- Time is cut into consecutive 15-minute windows; each window takes the average active power over that interval.
- Across all windows in the month, take the one with the largest average.
- That largest average is the month's billed demand (kW).
A day holds 24 hours × 4 = 96 windows; a month about 2,880 windows (30-day illustration). Only one window decides the whole month — even if the other 2,879 windows are low, one 15-minute spike sets the demand charge for the entire month. That is the mechanism behind "short spikes eat the bill": you cut energy but not that one window, and the demand charge stays untouched.
3. The meter's demand registers: how to read them
A smart meter's demand record is not a single number but a set of fields. Read them to locate the offending window:
- Present demand: the sliding average power from the start of the period to now.
- Maximum demand: the largest window average seen this period — the billing basis.
- Time of maximum demand: when the peak window occurred — the starting point for investigation.
- Demand window length: how long an interval the meter uses (commonly 15 minutes; also 1, 5, or 30, per meter setting).
- Settlement / reset period: how often the demand value is cleared and recomputed (commonly monthly), which drives the declaration and review rhythm.
Map the "time of maximum demand" onto the production schedule and you often see it directly: machines started together at shift change, or several large drives kicking off at once. That is the handle for peak shaving.
4. Capacity or demand: which is cheaper
The decision is a ratio. Define load factor k = monthly billed demand ÷ transformer capacity, and break-even k* = capacity rate ÷ demand rate. Demand billing is cheaper when k < k*; otherwise capacity billing wins.
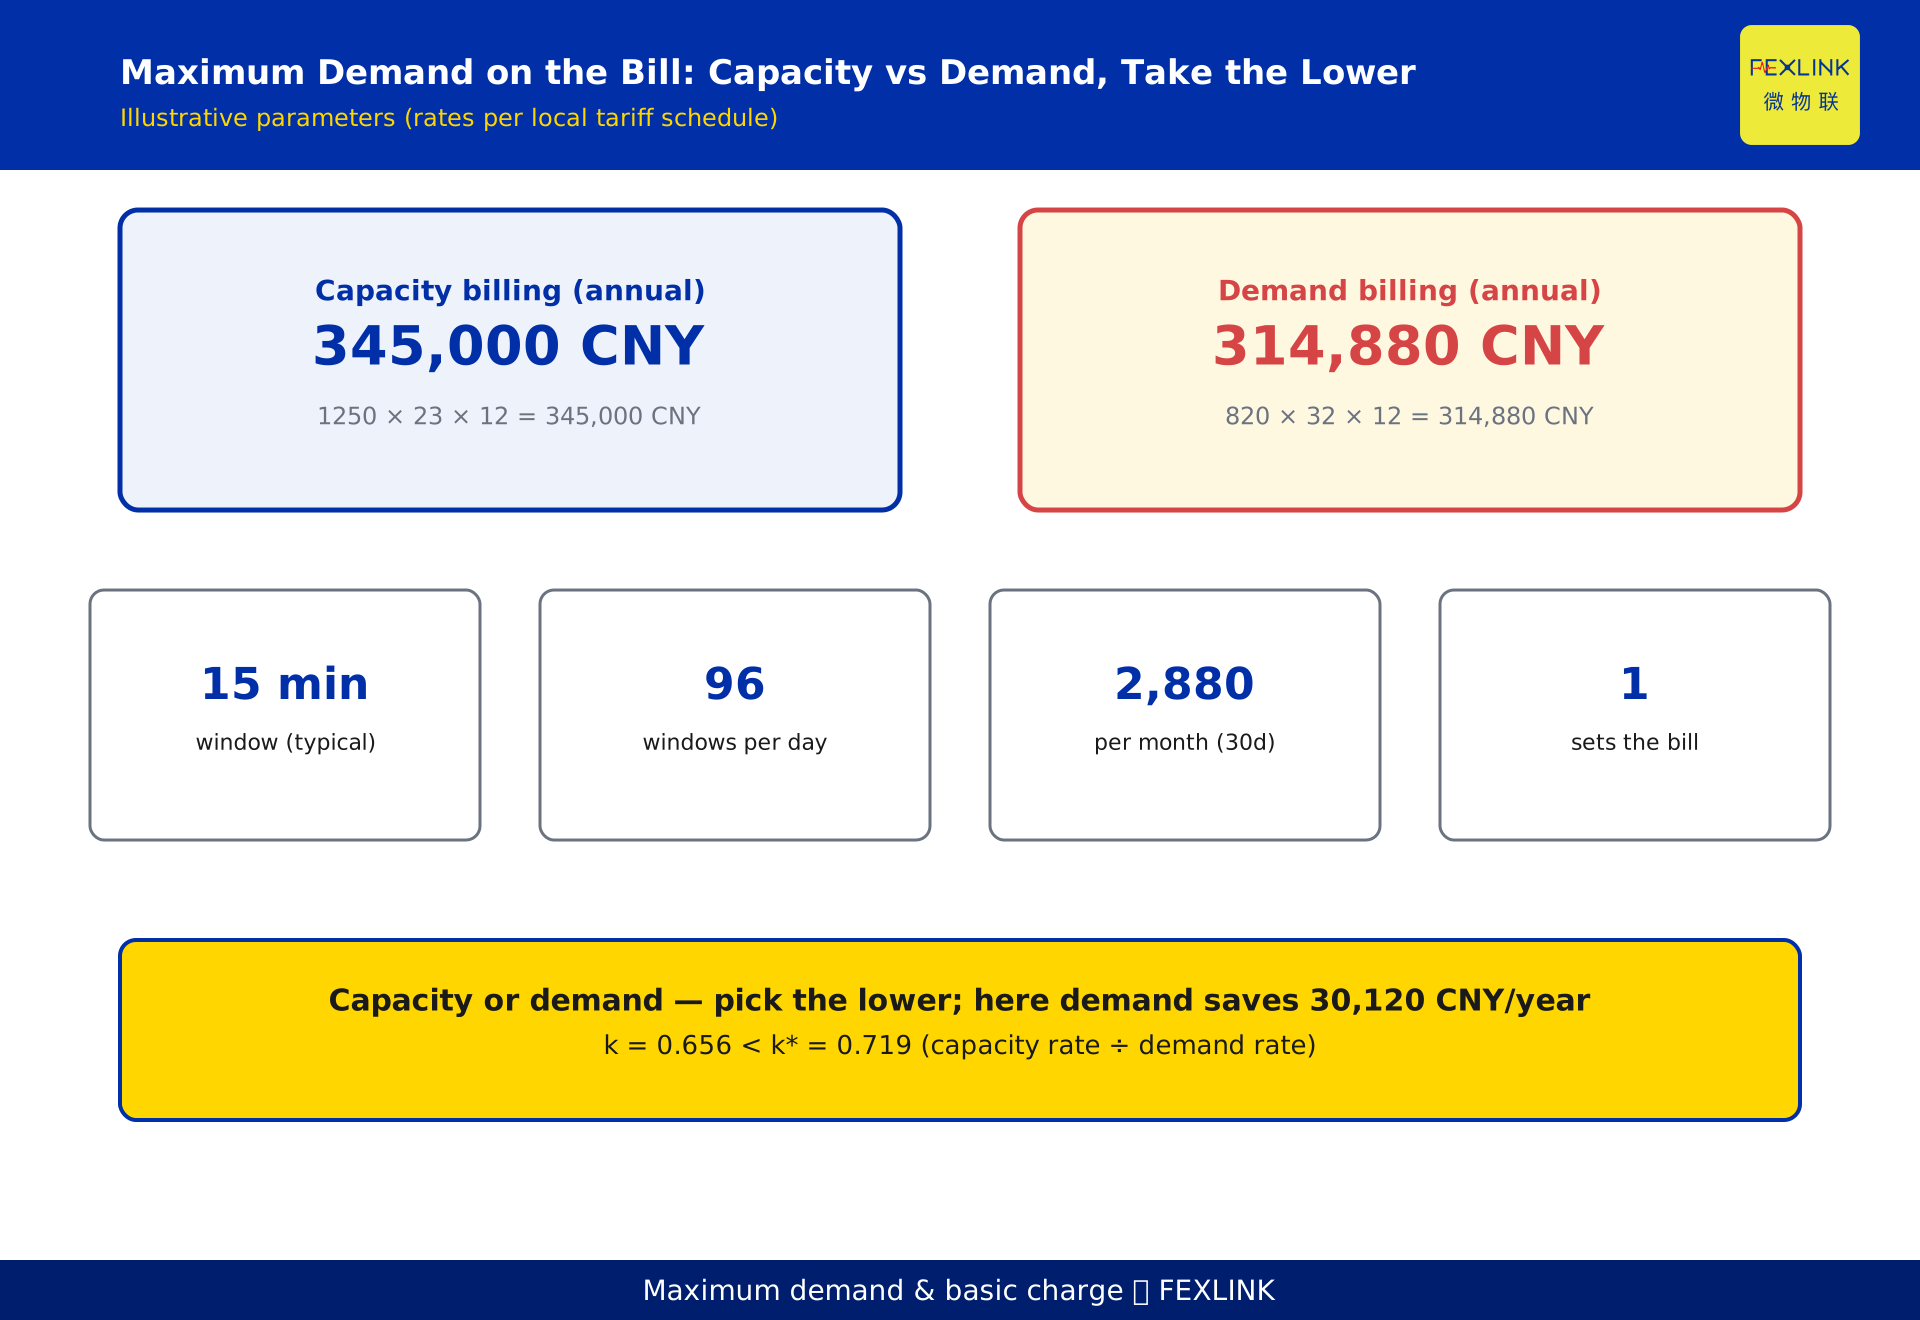
Below is a set of illustrative parameters constructed to show the arithmetic (not any real customer; actual rates from the local tariff schedule): a plant with 1250 kVA transformer, 820 kW billed demand, capacity rate 23 CNY/kVA·month and demand rate 32 CNY/kW·month.
- Capacity charge = 1250 × 23 × 12 = 345,000 CNY/year
- Demand charge = 820 × 32 × 12 = 314,880 CNY/year
- Choosing demand billing saves 30,120 CNY/year, with zero retrofit — just one billing-method change.
- Check: k = 820 ÷ 1250 = 0.656, k* = 23 ÷ 32 = 0.719, 0.656 < 0.719, so demand is cheaper, matching the two-bill conclusion.
The lesson is clear: compute both bills before deciding; do not pick capacity by habit. Many plants stay on capacity billing simply because it was the default at installation and was never reviewed.
5. Finding the shaving point on the demand curve: a worked scenario
A machinery plant (desensitized, generic) runs two 1250 kVA transformers and sits at 820 kW billed demand month after month. Reading the meter's demand registers shows the time of maximum demand clusters at "15 minutes after the morning shift starts," matching three large motors — air compressor, hydraulic station, main drive — starting almost simultaneously and pushing that one 15-minute window's average to 820 kW.
This is the classic "simultaneous-start spike": no single device is huge, but stacked together for 15 minutes they set the month's demand. Other periods are flat, yet the bill is locked by that one window.
6. Three practical moves to shave the peak
Once the peak window is located, the idea is to spread the stacked power across time:
- Staggered start: delay the three large devices' start times by more than 5 minutes so fewer run inside any one 15-minute window. In this scenario, staggering drops the peak window from 820 kW to 710 kW, cutting billed demand by 110 kW.
- Soft start / variable frequency: use soft starters or VFDs to suppress inrush current and lower the window's average power.
- Load scheduling: move movable high-power steps to low-load periods so they do not pile onto the fixed peak.
Continuing the illustrative rate (32 CNY/kW·month): each 1 kW cut in billed demand saves 32 × 12 = 384 CNY/year; 110 kW saves 42,240 CNY/year. Again, the rate is illustrative; actual figures follow the local tariff schedule.
7. How products surface the demand data
Locating the demand window requires data readable by window and by circuit. The ESA all-element smart meter (for example ESA-22131-R, with demand recording and 15-minute sliding-window statistics, reading maximum demand and its timestamp per circuit) answers "which line, which moment." The ZSA-22243-R also provides demand-record fields with sliding-window statistics and timestamp marking. Both export the meter's demand fields directly, removing manual reading and estimation.
Upstream, combined with the digital electrical supervision system and demand-management optimization, the 96 daily and 2,880 monthly windows are rendered automatically, so the peak window, its time, and the responsible equipment are visible at a glance — turning "find the shaving point" from guesswork into reading a curve.
8. Annual review and declaration-value management
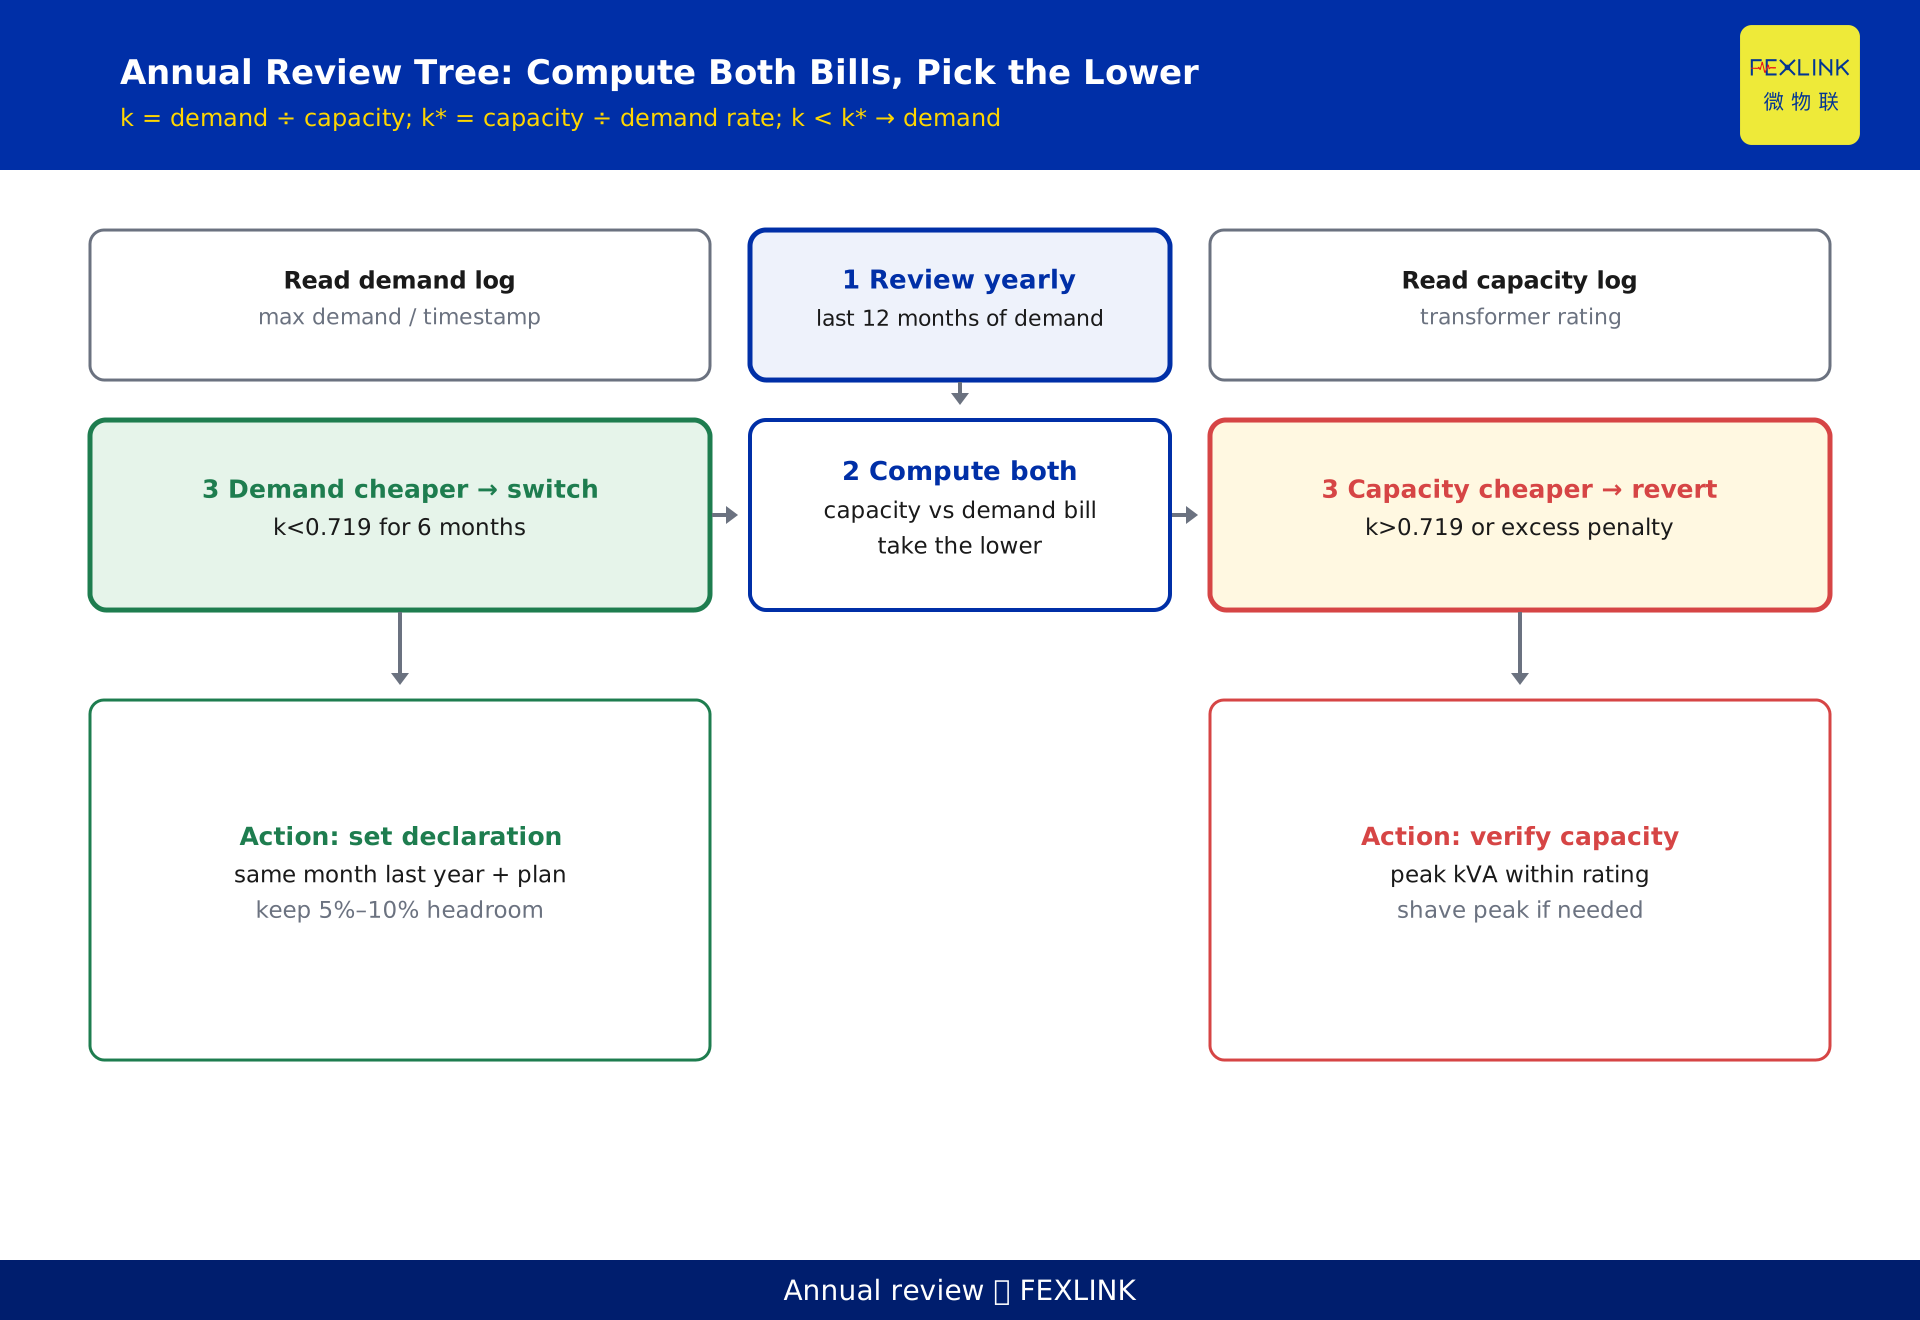
Demand is not set once. Review it every year: take the last 12 months of billed demand, recompute both bills, and decide whether to switch method; if on demand billing, also manage the declaration value.
The declaration value is usually set from "same month last year's demand + production-plan correction," with a 5%–10% headroom — too little and an overshoot triggers doubled excess-demand billing; too much and you simply overpay. Watch the signal: if k stays clearly below break-even for 6 straight months, demand billing is stable; if k climbs for 3 straight months, return to capacity or shave the peak. Billing-method changes are limited per year, so settle 12 months of data before filing.
FAQ
Q: Maximum demand or transformer capacity — which do I pay the basic charge on?
Compute both bills: capacity charge = capacity × capacity rate, demand charge = billed demand × demand rate, and take the lower. The test is k = monthly demand ÷ capacity; demand is cheaper when k is below "capacity rate ÷ demand rate." Actual rates follow the local utility's current tariff schedule.
Q: Why did my total energy drop but the demand charge did not?
Because demand looks at "the worst 15 minutes," not the monthly average. You lowered most periods, but if one window is pushed up by simultaneously started equipment, billed demand does not fall. Cutting energy is not cutting the peak; the demand charge only recognizes that one highest window.
Q: What is the "time of maximum demand" in the meter for?
It is the starting point for finding the shaving point. Map it onto the production schedule and you often see a concentrated start at shift change, several large devices starting together, or a fixed process. Find it and you know which segment to stagger.
Q: How much headroom should the declaration value keep?
About 5%–10%. Too little and any overshoot draws doubled excess-demand billing; too much and you voluntarily overpay the basic charge. Base the declaration on the same month of the last 12 months, plus a production-plan correction.
Q: Is demand billing always cheaper than capacity billing?
No. Demand wins only when k is below break-even (capacity rate ÷ demand rate). Plants with inherently high load factor whose peak consistently approaches the transformer rating are cheaper on capacity. So compute both bills; do not assume.
Scope and limitations
- The maximum-demand and basic-charge methods discussed here apply to large industrial and high-voltage commercial users on two-part tariffs; single-part tariff users have no basic charge and can skip the capacity/demand choice.
- The 15-minute sliding window is a common utility convention, but window length (1 / 5 / 15 / 30 minutes) and settlement period vary by utility and meter; specifics follow the local utility and meter settings, and this article uses the most common 15-minute window.
- The rates (23 CNY/kVA·month, 32 CNY/kW·month) and example parameters (1250 kVA, 820 kW, 30,120 CNY/year saved, 110 kW cut after shaving, 42,240 CNY/year saved) are constructed to illustrate the arithmetic and represent no real customer or project; actual capacity and demand rates follow the local utility's current tariff schedule.
- The models and demand-recording functions of the ESA all-element smart meter (ESA-22131-R) and ZSA-22243-R follow the latest selection manual and product knowledge base; this article is not a selection or procurement recommendation.
- Definitions and collection rules for maximum demand and demand charges follow the local current tariff schedule and supply contract; if a standard is revised or policy changes, the quantitative conclusions here require rechecking.
Frequently Asked Questions
Maximum demand or transformer capacity — which do I pay the basic charge on?
Compute both bills: capacity charge = capacity × capacity rate, demand charge = billed demand × demand rate, and take the lower. The test is k = monthly demand ÷ capacity; demand is cheaper when k is below "capacity rate ÷ demand rate." Actual rates follow the local utility's current tariff schedule.
Why did my total energy drop but the demand charge did not?
Because demand looks at "the worst 15 minutes," not the monthly average. You lowered most periods, but if one window is pushed up by simultaneously started equipment, billed demand does not fall. Cutting energy is not cutting the peak; the demand charge only recognizes that one highest window.
What is the "time of maximum demand" in the meter for?
It is the starting point for finding the shaving point. Map it onto the production schedule and you often see a concentrated start at shift change, several large devices starting together, or a fixed process. Find it and you know which segment to stagger.
How much headroom should the declaration value keep?
About 5%–10%. Too little and any overshoot draws doubled excess-demand billing; too much and you voluntarily overpay the basic charge. Base the declaration on the same month of the last 12 months, plus a production-plan correction.
Is demand billing always cheaper than capacity billing?
No. Demand wins only when k is below break-even (capacity rate ÷ demand rate). Plants with inherently high load factor whose peak consistently approaches the transformer rating are cheaper on capacity. So compute both bills; do not assume.