 FEXLINK Research Institute
The short answer
There is no single number answering "how much 5th- or 7th-order harmonic is noncompliant." GB/T 14549-1993, *Power Quality — Harmonics in Public Supply Networks* (current; issued 1993, in force 1994, no replacement to date), splits assessment into two ledgers. The voltage side limits total harmonic distortion of voltage (THDu) and individual harmonic voltage ratios, in percent. The current side limits harmonic currents injected at the point of common coupling (PCC), in amperes. Voltage limits are read by voltage level; current limits are quoted for a reference short-circuit capacity and must be scaled by the PCC's actual minimum capacity first. The same 5th-order current can pass on a strong grid and fail on a weak one.
Three steps: fix the voltage level, compare THDu and each ratio against voltage limits, then scale tabulated ampere limits by the capacity ratio and compare with measured currents. The common mistake is mixing the ledgers: voltage and current limits have different quantities and denominators, so they cannot be compared directly.
1. Two ledgers: percentage or current?
Reports carry three kinds of harmonic data that look alike but differ:
- THDu: rms of all harmonic voltages over the fundamental, in percent — how badly the voltage waveform is distorted.
- Individual harmonic voltage ratio HRU_h: the h-th harmonic voltage over the fundamental, in percent; 5th and 7th ratios belong here.
- Individual harmonic current I_h: rms of the h-th harmonic current, in amperes (sometimes a share of fundamental) — what the user injects.
Percent limits apply to the first two, ampere limits to the third. Asking "is 5% of 5th harmonic over the limit" mixes a voltage percentage with a current figure. Identify the column before choosing a table. THDi, also a percentage, has no general limit parallel to THDu here.
2. Scope: the PCC, not inside the device
The standard applies to 50 Hz public networks up to 110 kV and sets limits at the point of common coupling (PCC), plus the harmonic current a user may inject there. The PCC is normally the ownership boundary: the standard assesses injection into the public network, not internal generation. The same drive reads differently at its own bus and at the PCC, because transformer impedance, shunt capacitors and line impedance sit in between. Equipment-terminal values are therefore not comparable to PCC limits.
Use a harmonic instrument meeting the standard, and take a statistical value over a period (commonly the 95th percentile), not a single instantaneous reading; a brief spike and a weekly percentile can give opposite verdicts. This article covers only how to read the limits once data is in hand; measurement practice follows the standard text.
3. Voltage side: limits by voltage level
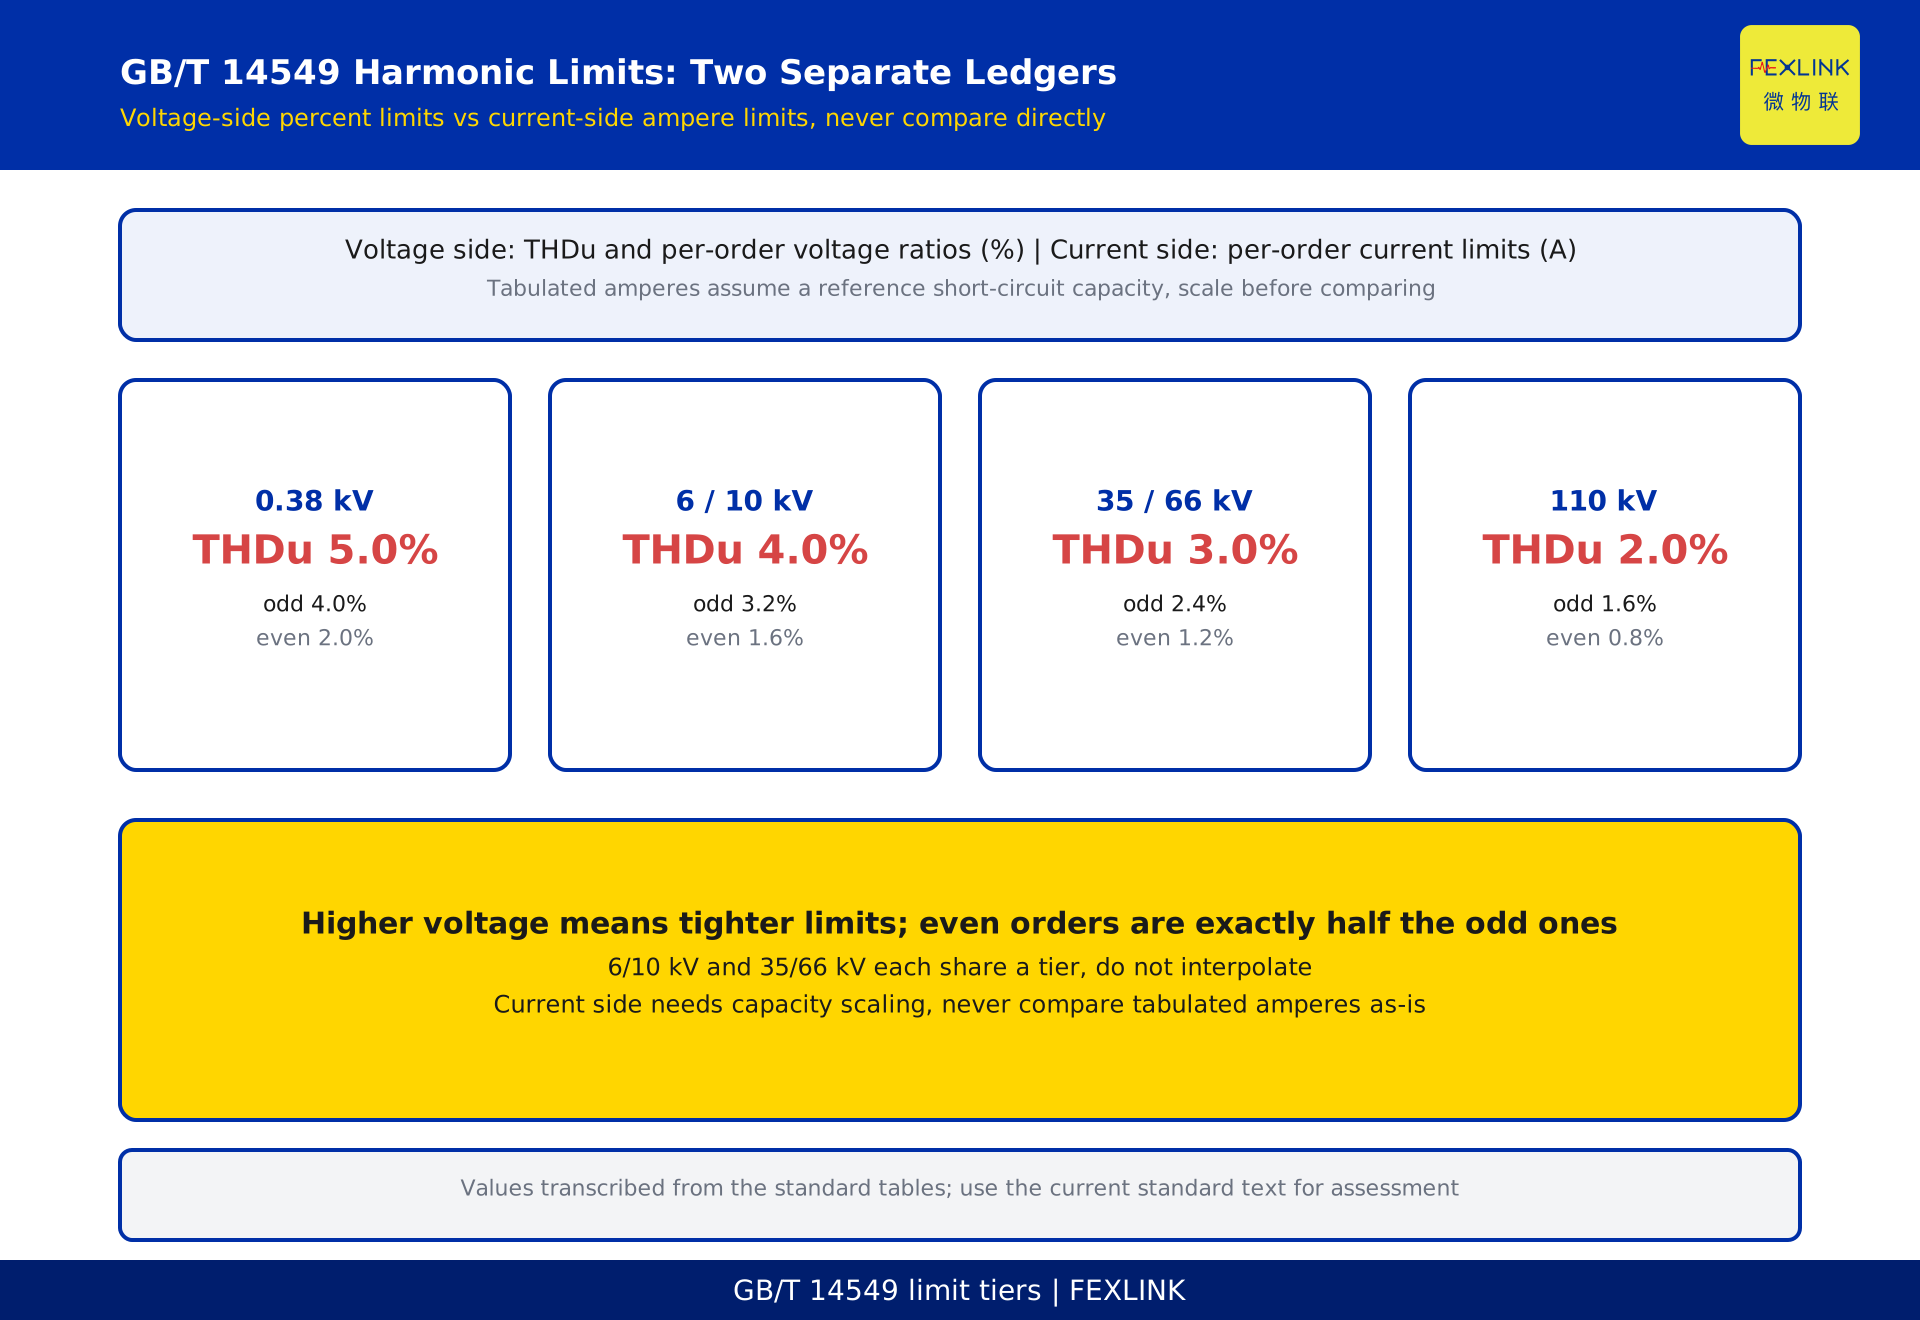
| Nominal voltage | THDu | Odd HRU | Even HRU |
|---|---|---|---|
| 0.38 kV | 5.0% | 4.0% | 2.0% |
| 6 kV, 10 kV | 4.0% | 3.2% | 1.6% |
| 35 kV, 66 kV | 3.0% | 2.4% | 1.2% |
| 110 kV | 2.0% | 1.6% | 0.8% |
Three points. Higher voltage means tighter limits, from 5.0% at 0.38 kV to 2.0% at 110 kV, since a high-voltage bus serves more users. 6 kV shares a tier with 10 kV, 35 kV with 66 kV — do not interpolate a separate 66 kV value. Even-order limits are exactly half the odd-order ones; even harmonics should barely appear, so a significant even component signals asymmetry or faulty equipment. Verdict: measured THDu must not exceed the tier limit and every HRU_h its odd/even limit — both must hold.
4. Current side: a reference capacity is assumed
This table is most often misread. It gives per-order current limits in amperes, but each tier is tied to a reference short-circuit capacity:
| Nominal voltage | Reference S_k1 | 5th | 7th | 11th | 13th |
|---|---|---|---|---|---|
| 0.38 kV | 10 MVA | 62 A | 44 A | 28 A | 24 A |
| 10 kV | 100 MVA | 20 A | 15 A | 9.3 A | 7.9 A |
| 35 kV | 250 MVA | 12 A | 8.8 A | 5.6 A | 4.7 A |
| 110 kV | 750 MVA | 9.6 A | 6.8 A | 4.3 A | 3.7 A |
(Tabulated values from the standard; see the standard text for all orders. 6 kV shares the 10 kV tier.)
Reference is the key: these amperes are not the final line. The PCC's actual minimum capacity S_k2 usually differs from the reference S_k1, so limits scale linearly:
I_h = I_hp × S_k2 / S_k1
I_hp is the tabulated limit, S_k1 the tier's reference capacity, S_k2 the PCC's actual minimum capacity. A stiffer grid allows more injected current for the same voltage distortion; a weak grid compresses the allowance. This proportionality is the pivot of current-side assessment. Note that a larger 5th allowance (62 A) than 11th (28 A) reflects the spectrum of typical loads, not looser control — each order is judged against its own figure.
5. Capacity scaling: strong and weak grids disagree
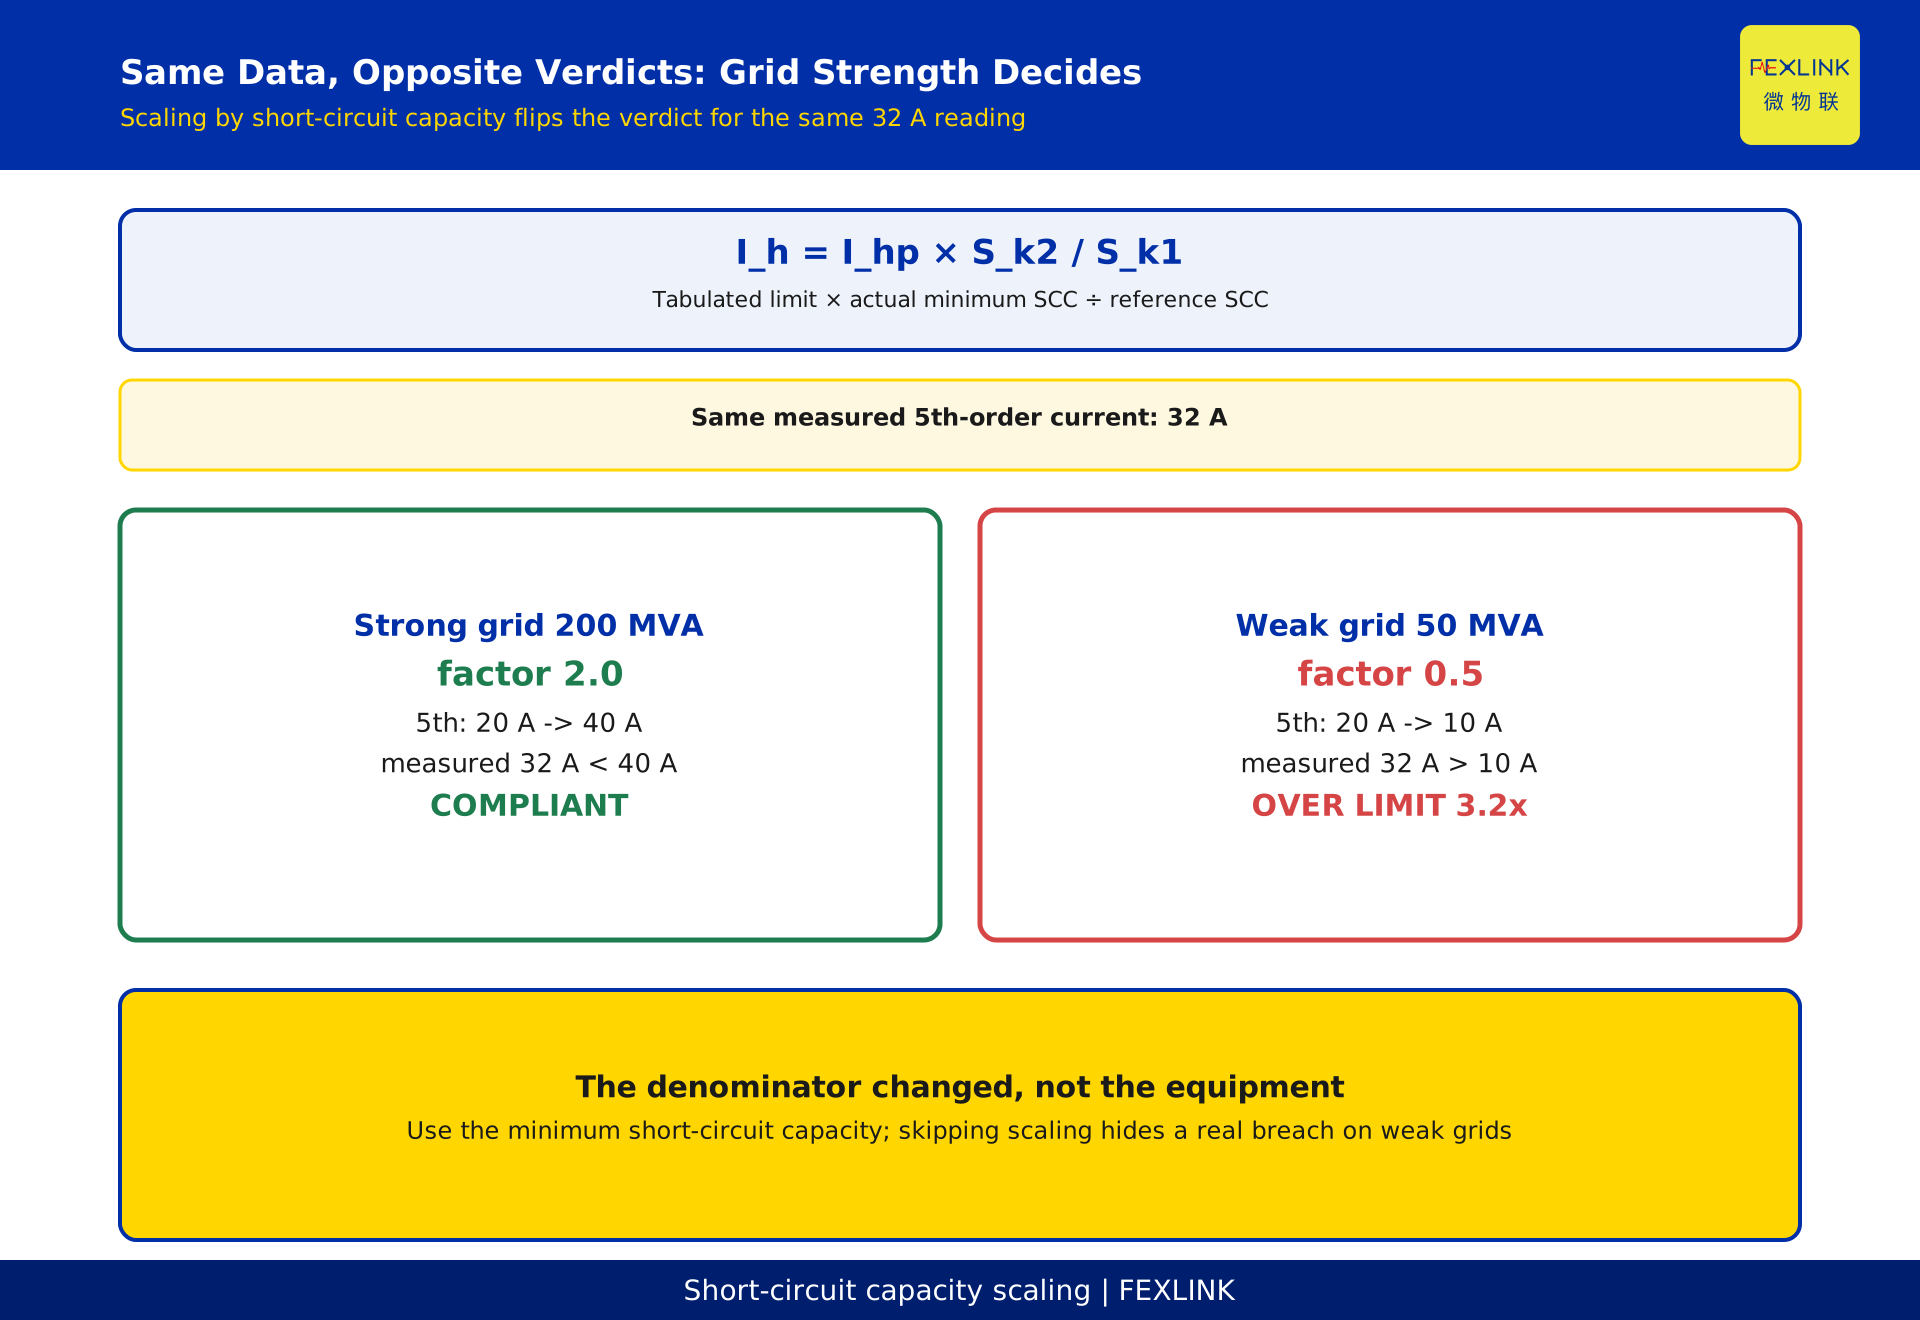
The formula produces a surprising but correct result: the same data flips verdict when capacity changes. At 10 kV (reference 100 MVA, tabulated 5th limit 20 A):
- 200 MVA: factor 2.0, limit 20 × 2.0 = 40 A.
- 50 MVA: factor 0.5, limit 20 × 0.5 = 10 A.
With 32 A measured: compliant on the strong grid (32 < 40), over by 3.2× on the weak one (32 > 10). Identical data, opposite verdicts — the same drive fails behind a small plant transformer yet passes near the main bus because the denominator changed. Use the minimum capacity (minimum operating configuration), since the maximum hides risk; obtain S_k2 from the utility or a short-circuit study, never from transformer rating.
6. Worked example: 10 kV at 200 MVA
A 10 kV PCC has minimum capacity 200 MVA; the monitor reports (figures constructed, not a real project):
- Voltage: THDu = 3.4%, 5th HRU 2.8%, 7th HRU 1.5%.
- Current: 5th 32 A, 7th 26 A.
Step 1, tier. 10 kV → "6, 10 kV" tier: THDu 4.0%, odd HRU 3.2%, even 1.6%.
Step 2, voltage. 3.4% < 4.0%; 2.8% and 1.5% both < 3.2%. Voltage side clears.
Step 3, current after scaling. Factor 200/100 = 2.0. 5th: 20 × 2.0 = 40 A, measured 32 A, pass. 7th: 15 × 2.0 = 30 A, measured 26 A, pass. Compliant.
Skipping the scaling would wrongly flag both: 32 A against tabulated 20 A, 26 A against 15 A. The error direction differs — on a strong grid it marks a pass as a fail; on a weak grid (factor below 1) it marks a fail as a pass, which is dangerous. Reverse check: at 50 MVA (factor 0.5), allowances are 10 A and 7.5 A, so 32 A is 3.2× the allowance and 26 A about 3.5×. The same report goes from fully compliant to two orders badly over.
7. Why the 3rd, 5th and 7th orders dominate
Spectrum. Six-pulse rectification (drives, UPS, DC supplies) produces characteristic orders 6k±1: 5, 7, 11, 13... Current falls roughly as 1/h, so the 5th and 7th are largest and hit limits first. How a waveform is decomposed belongs to spectral-analysis theory (see the FFT-principles article); this article assumes per-order data exists.
The 3rd is special. The 3rd and its multiples are zero-sequence: in a four-wire system they add in the neutral instead of cancelling, causing neutral overload. The standard lists an allowance for the 3rd too (62 A at 0.38 kV, 20 A at 10 kV, the same figures as the 5th at those tiers); sites dense with single-phase rectifiers, lighting and switch-mode supplies should watch it.
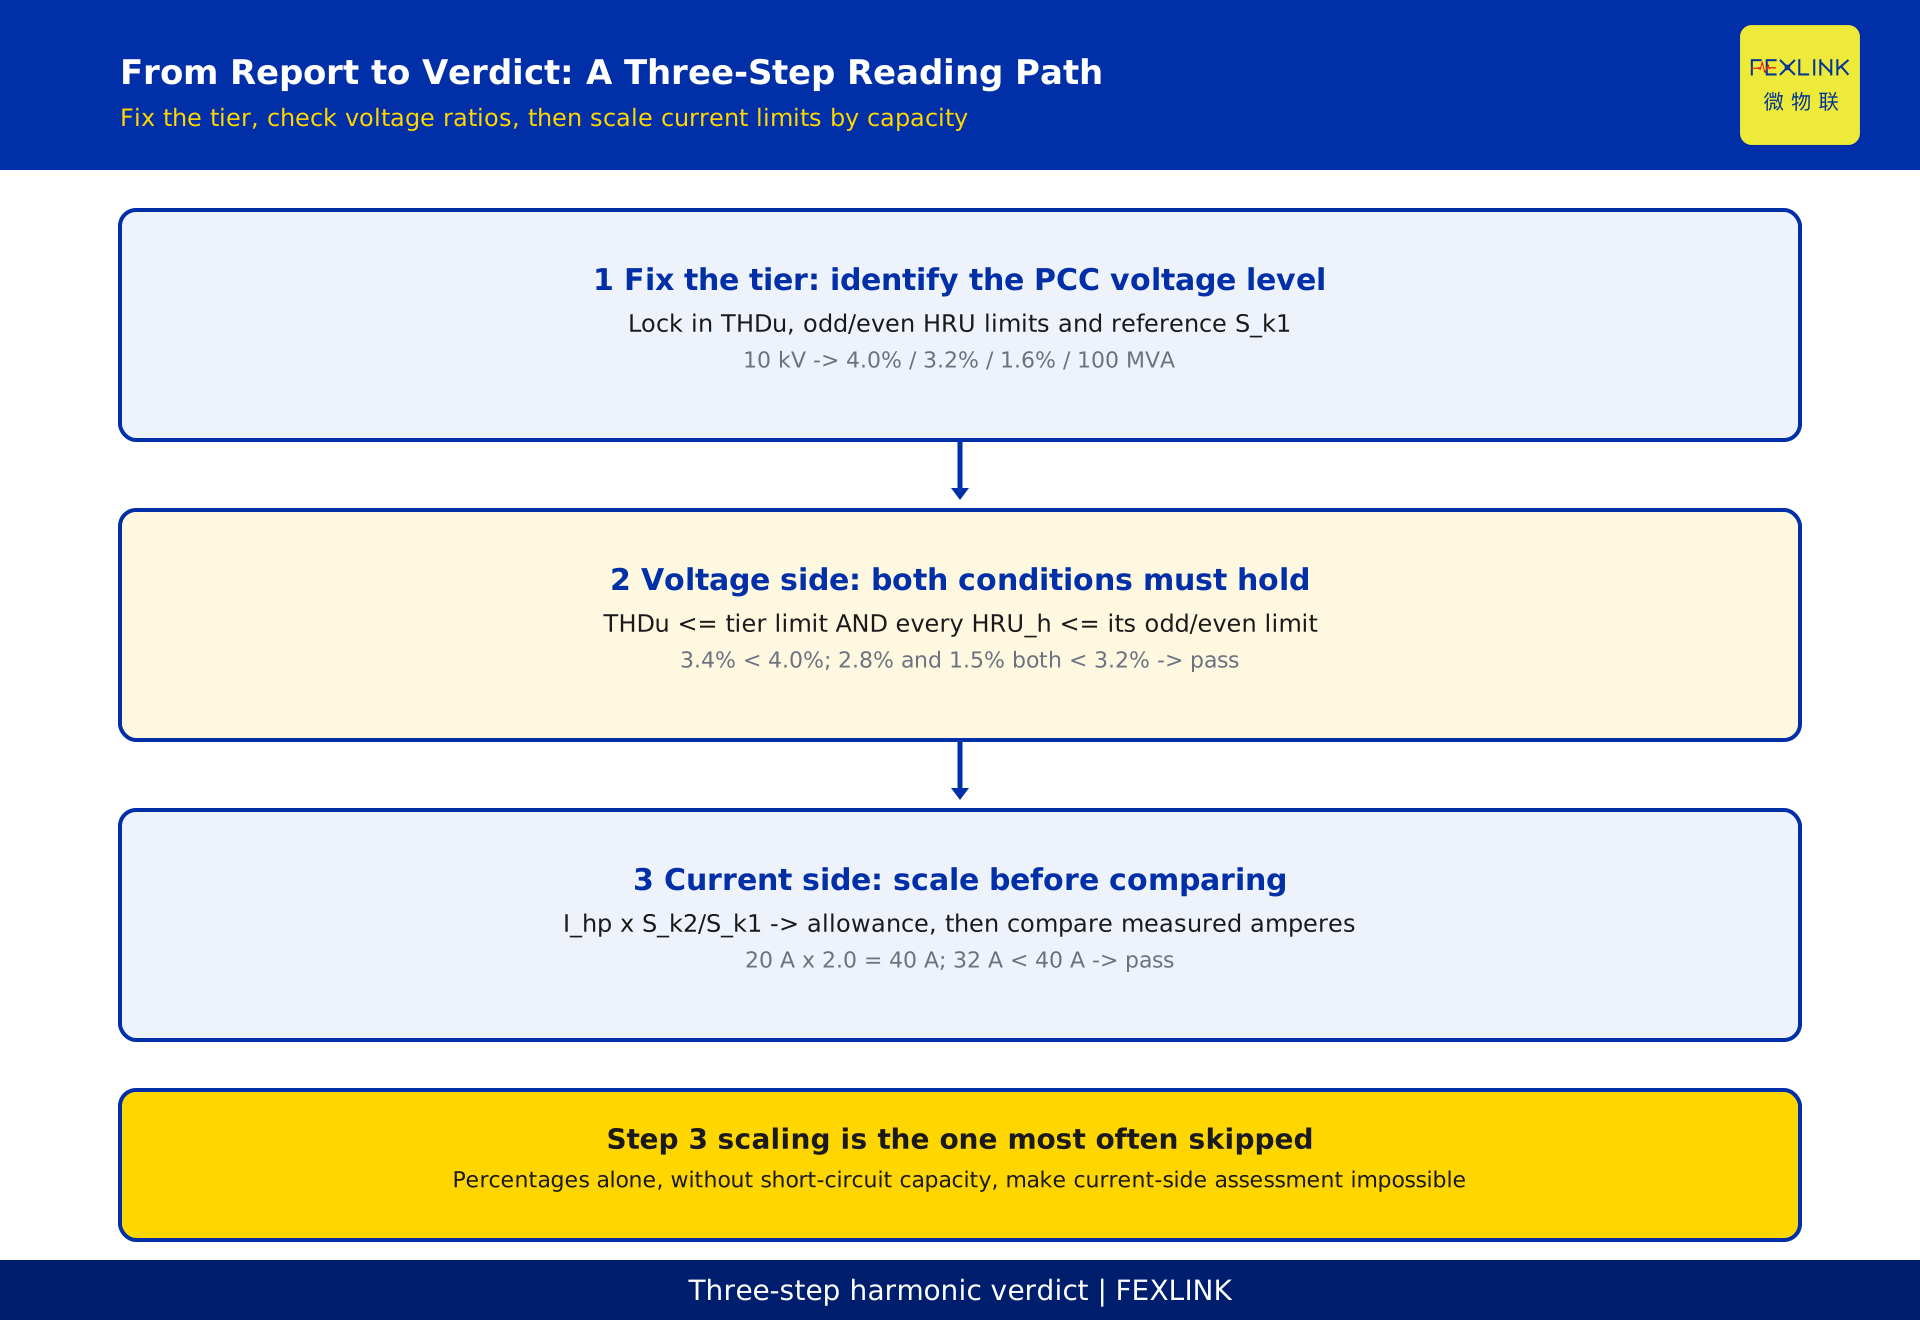
8. Three steps from report to verdict
- Fix the tier: identify the PCC voltage level; lock in THDu, odd/even HRU limits and S_k1.
- Voltage: THDu must not exceed the tier limit and every HRU_h its odd/even limit; both must hold.
- Current: take S_k2, compute S_k2/S_k1, scale each tabulated order limit, compare with measured currents; where sources share a PCC, allocate and take the statistical value as the standard requires.
Step 3 is most often skipped and is exactly what this article adds. If a report gives only percentages and no short-circuit capacity, current-side assessment is impossible — request the data from the utility.
9. Five traps
- Comparing a voltage limit with current data (or the reverse); THDi has no general limit parallel to THDu.
- Skipping the capacity scaling: a pass becomes a fail on a strong grid, a fail becomes a pass on a weak one.
- Measuring at the wrong point: values inside equipment or on a branch cannot be checked against PCC limits.
- Applying one blanket percentage, or reading a larger 5th allowance as permission to exceed it.
- Ignoring shared tiers and halved even limits: 6/10 kV and 35/66 kV each share a tier; even limits are half the odd ones. Interpolating invents a limit that does not exist.
FAQ
Q: What percentage of 5th harmonic is noncompliant?
None in general. Voltage side: check HRU_5 against the tier's odd limit (0.38 kV 4.0%, 6–10 kV 3.2%, 35–66 kV 2.4%, 110 kV 1.6%). Current side: scale the ampere allowance by capacity, then compare measured amperes. The units differ.
Q: Why is the 5th allowance larger than the 11th?
Allowances follow the spectrum of typical loads; each order is judged against its own figure. A 62 A allowance with 70 A measured still fails.
Q: What if short-circuit capacity is unavailable?
Do not estimate it — the limit depends entirely on S_k2/S_k1. Request the minimum-configuration capacity or short-circuit study from the utility.
Q: If THDu passes, is everything fine?
No: the voltage side needs a compliant THDu and every individual ratio within its limit; the current side needs its own scaled comparison. Any breach at any order is a failure.
Q: Does one brief spike count?
No. The standard specifies a measurement and assessment method, commonly the 95th percentile over a period; take that value before comparing.
Q: Can this serve as an acceptance or penalty basis?
No. A formal conclusion must come from a qualified party under the current standard text, at an agreed measurement point and assessment rule; if revised, the latest version governs.
Scope and limitations
- This article covers only how to read GB/T 14549-1993's limit system, how to scale by short-circuit capacity, and how to judge a report. It excludes harmonic generation physics and FFT spectral analysis (FFT-principles article) and quick single-number lookups (THD quick-reference article). Boundary: "limits and scaling" vs "how the data is computed" vs "checking one number fast".
- Limit values are transcribed from the standard's tables to illustrate the method; for actual assessment, acceptance and selection use the tables and text of the current standard. Status verified as current; only the name and current status are cited, with no clause numbers, and no accuracy classes, measurement windows or mitigation indices invented.
- All Section 6 figures (10 kV, 200 MVA, THDu 3.4%, 5th 32 A, etc.) are constructed for illustration and represent no real customer, project or device.
- Scaling uses the standard's linear relation
I_h = I_hp × S_k2 / S_k1; phase-summation coefficients for allocating indicators among multiple sources are not developed and must follow the standard text. - This is not an acceptance verdict, mitigation design, or selection or purchasing recommendation; mitigation, filter sizing and monitor selection require site measurement and current product documentation.
Frequently Asked Questions
What percentage of 5th harmonic is noncompliant?
None in general. Voltage side: check HRU_5 against the tier's odd limit (0.38 kV 4.0%, 6–10 kV 3.2%, 35–66 kV 2.4%, 110 kV 1.6%). Current side: scale the ampere allowance by capacity, then compare measured amperes. The units differ.
Why is the 5th allowance larger than the 11th?
Allowances follow the spectrum of typical loads; each order is judged against its own figure. A 62 A allowance with 70 A measured still fails.
What if short-circuit capacity is unavailable?
Do not estimate it — the limit depends entirely on S_k2/S_k1. Request the minimum-configuration capacity or short-circuit study from the utility.
If THDu passes, is everything fine?
No: the voltage side needs a compliant THDu and every individual ratio within its limit; the current side needs its own scaled comparison. Any breach at any order is a failure.
Does one brief spike count?
No. The standard specifies a measurement and assessment method, commonly the 95th percentile over a period; take that value before comparing.
Can this serve as an acceptance or penalty basis?
No. A formal conclusion must come from a qualified party under the current standard text, at an agreed measurement point and assessment rule; if revised, the latest version governs.