 FEXLINK Research Institute
Direct answer
A pump motor trips on overload now and then, and nobody can tell whether the pump is jammed or the electrical side is overloaded. The distinction lies in the current waveform and how long it lasts. A mechanical overload from flow variation follows the operating condition and can be explained by starting inrush; an electrical overload from insulation decay or low voltage keeps the current high under steady conditions without falling back. Add the temperature-rise trend as confirmation and the two causes separate. The order is waveform first, then duration, then temperature, not replacing the cable at every trip. This article covers interpretation and troubleshooting order only; it states no specific settings, protection parameters or performance commitments.
The digital electrical intelligent supervision system is registered by name only, with no expansion of dimensions, layers or elements. This article states no standard number, year, clause, limit, permissible value or conformity judgement. Associated products are registered by name only, with no parameters and no selection advice; the whole piece carries no measured data, no limits, no ratios, no cost figures and no effect commitments.
1. Turn "intermittent overload" into observable objects
What we hear on site is "the motor keeps tripping", "the cable was replaced but it still trips" and "it trips intermittently". These are consequences, not alignable objects. The first step is to translate them into quantities that can be pointed to on a drawing and aligned in a record: current magnitude, how current changes over time, how long the overload lasts, when it happens and how temperature moves.
Talking about replacing cables or protectors straight away mistakes an interpretation problem for a component fault. This article gives only which quantities to watch and in what order; it gives no current magnitude, time limit, multiple or pass boundary.
2. Why pump load varies naturally
A pump is not a constant load. Its shaft power changes with flow, head, valve opening and tank level. A changing inlet level, valve adjustment, pumps rotating in sequence or air in the line all make the mechanical load swing.
Load swing shows directly in motor current. Larger flow and wider valve opening mean heavier mechanical load and higher current; the reverse means lower. This kind of rise comes from the operating condition and falls back when the condition eases. Understand that and you will not mistake normal variation for a fault.
So "intermittent" is normal for a pump, not a synonym for abnormal. What must be separated is not "whether there is variation" but "whether the variation can be explained by the operating condition".
3. Three current shapes: normal swing, starting inrush, electrical overload
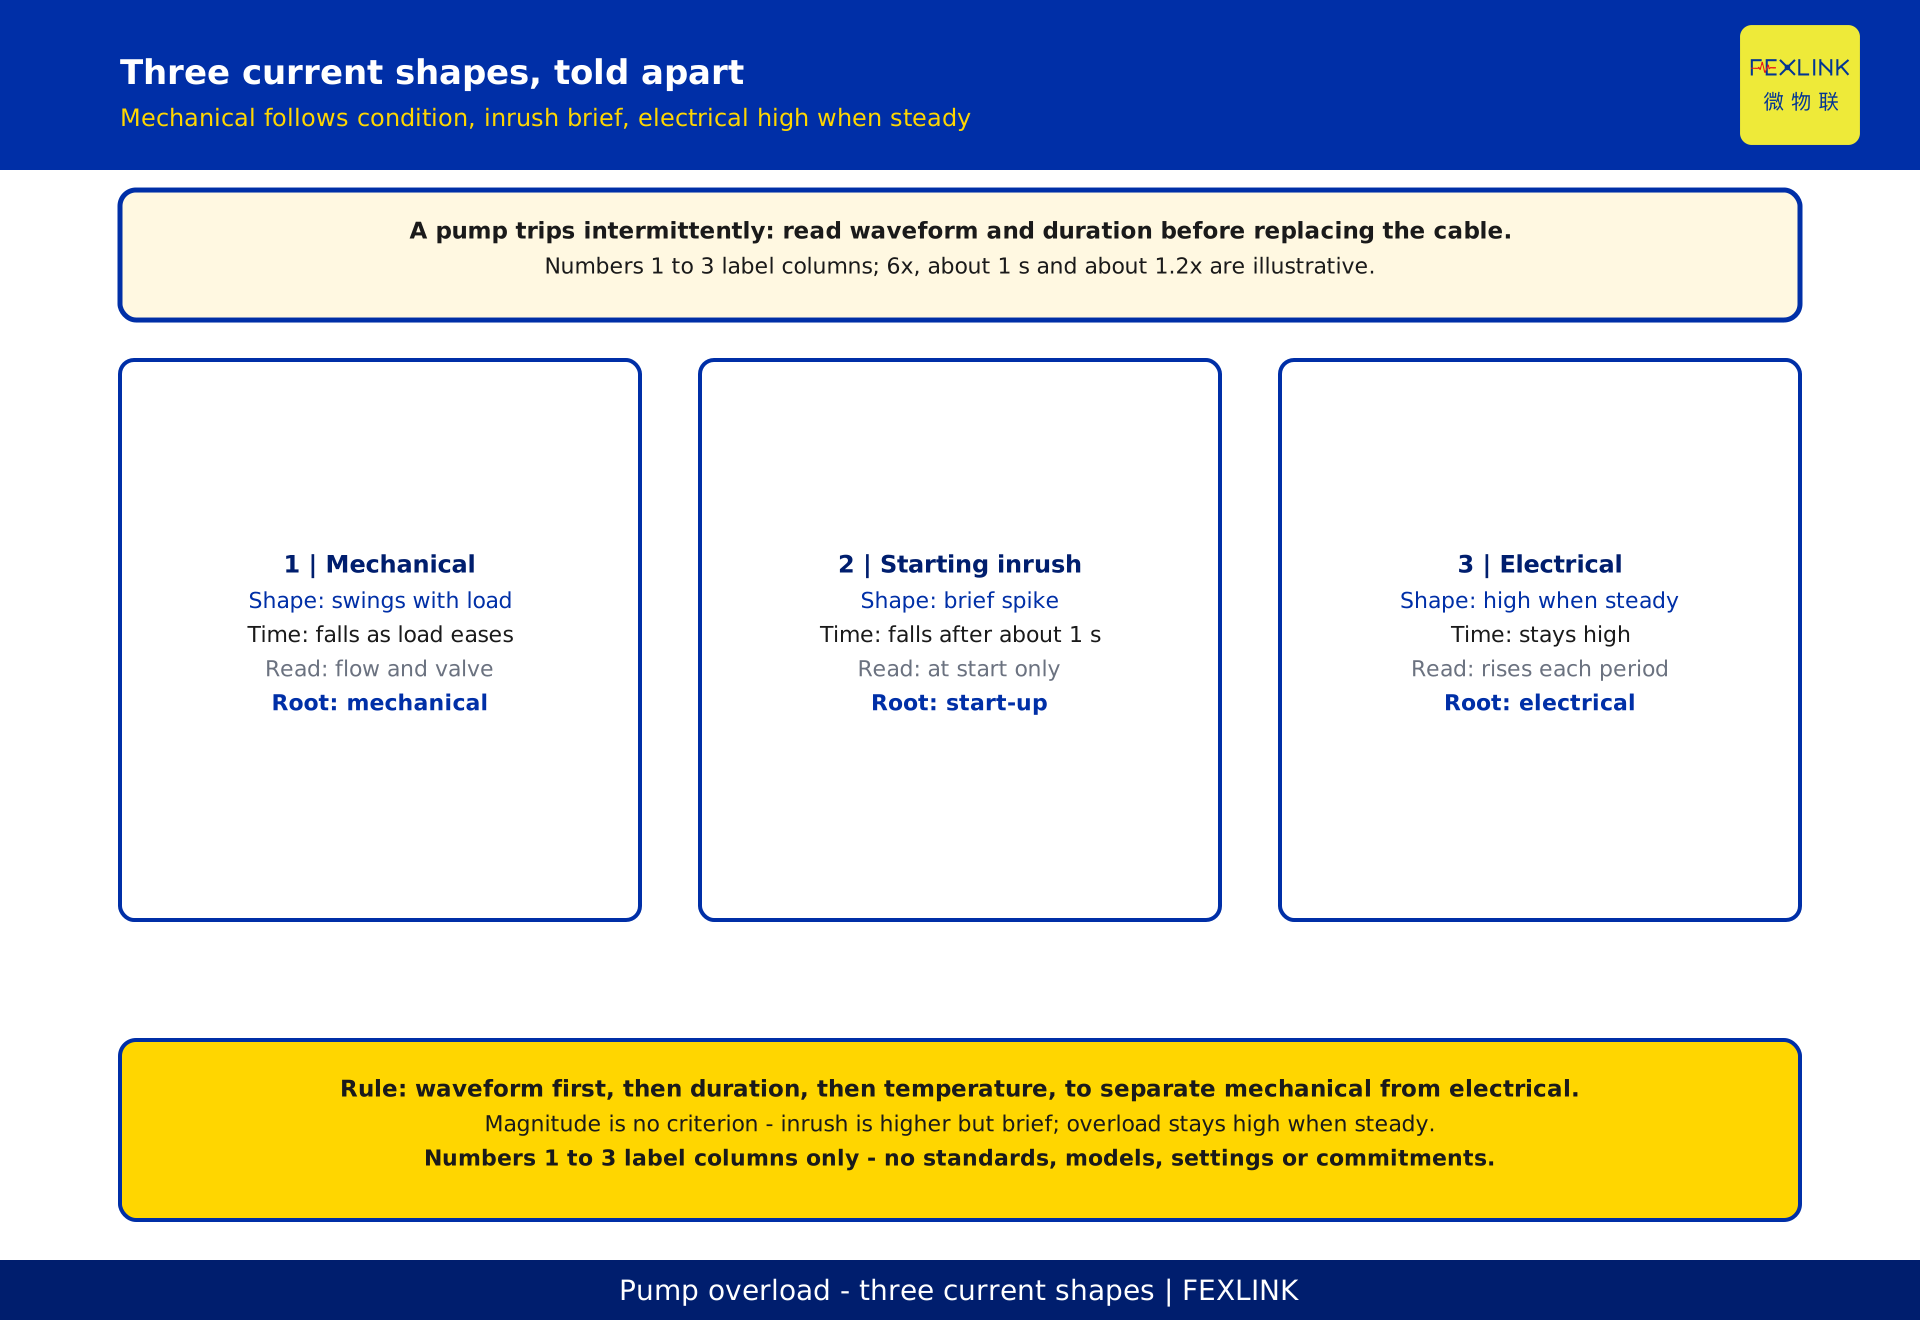
The current at a trip site actually mixes three shapes of different nature; separating them is the first step of interpretation.
The first is condition swing: current rises and falls with flow and valve opening, in step with operation, returning to normal once conditions settle. It is the load's background.
The second is starting inrush: at the instant of start the current briefly spikes, then quickly drops back to running level; it lasts a very short time and appears only at start-stop moments.
The third is electrical overload: insulation decay, winding faults or low supply voltage keep the current high even under steady conditions, not falling with the condition and not disappearing over time.
Protection sees the sum of all three. Misjudgement takes the first or second for the third: current is high, so an electrical fault is assumed, parts are replaced, and the problem remains.
4. Mechanical overload: current follows the condition
The signature of mechanical overload is that high current tracks the operating condition closely. When flow is high, the valve is wide open or the level is low, current rises; when the condition eases, current falls. Put the current record and the condition record on one time axis and the peaks and troughs line up.
It often comes with explainable starting inrush: each start spikes then drops, and the trip falls at a start or condition change. The root is on the mechanical side, a heavy load or piping issue, not cable insulation.
Conversely, if current is high while conditions are steady, flow unchanged and the valve untouched, mechanical overload is hard to invoke and the electrical side must be investigated. This single check, whether it lines up with the condition, is the first gate in separating the two.
5. Electrical overload: high current under steady conditions
The biggest difference from mechanical overload is that electrical overload does not follow the condition. Insulation decay, inter-turn winding faults or low supply voltage make the motor draw more current at the same flow and valve opening, continuously high and not falling back.
Its time signature differs too. Mechanical overload rises and falls with the condition, while electrical overload is a flat high line under steady conditions, or a slow climb over time. Compare the same condition across different periods: if current under one condition is a little higher each time, that is a strong signal.
Low voltage deserves separate attention. When voltage drops, the motor draws more current to hold its output, appearing as high current under steady conditions. This is not an insulation fault but is still an electrical-side cause, judged by aligning voltage and current records.
6. Recognising starting inrush: a reproducible interpretation example
Starting inrush is the easiest to confuse with electrical overload, because both show a current spike. The difference lies in duration and fall-back: inrush spikes only at start, lasts a short time then falls, while overload stays high. The following constructed numbers demonstrate the interpretation; values are illustrative assumptions with desensitised context, matching no real pump and serving no protection setting.
Let the rated current of a pump be the baseline 1 (illustrative). At start the current briefly spikes to about 6 times, then falls to running level after about 1 second — the shape of inrush: high magnitude, short duration, then fall-back. If a trip occurs about 1 second after a start and a complete spike and fall-back were recorded before it, that is explainable starting inrush, not electrical overload under steady conditions.
Now the other two shapes. Under mechanical overload current swings around 1.2 times with the condition and falls when the condition eases. Under electrical overload current is also around 1.2 times but stays high, not falling, under steady conditions. Similar magnitude; the difference is whether it follows the condition and whether it falls back.
| Shape | Constructed signature (illustrative) | Duration behaviour | Interpretation |
|---|---|---|---|
| Starting inrush | briefly about 6 times | falls after about 1 second | only at start-stop, then falls |
| Mechanical overload | about 1.2 times, swings with condition | falls when condition eases | in step with flow and valve |
| Electrical overload | about 1.2 times under steady conditions | stays high, no fall | a little higher each time at same condition |
7. Temperature rise as confirmation
Beyond current, temperature rise is an independent line of confirmation. Winding and terminal temperature record the cumulative effect of overload: mechanical overload swings with the condition and temperature follows; electrical overload persists and temperature climbs period after period under the same condition.
Temperature shows chronic problems better than current. Current may look normal at one moment, but long-term excess heat leaves a trend trace. Arrange temperatures of the same pump under the same condition over time and see whether they climb: a way to judge electrical-side decay.
Temperature and current must share one clock to align "is temperature rising while current is high". This article only says which positions to watch and how to keep evidence; it states no temperature value, rise rate or alarm threshold.
8. Putting three lines of evidence together: a judgement table
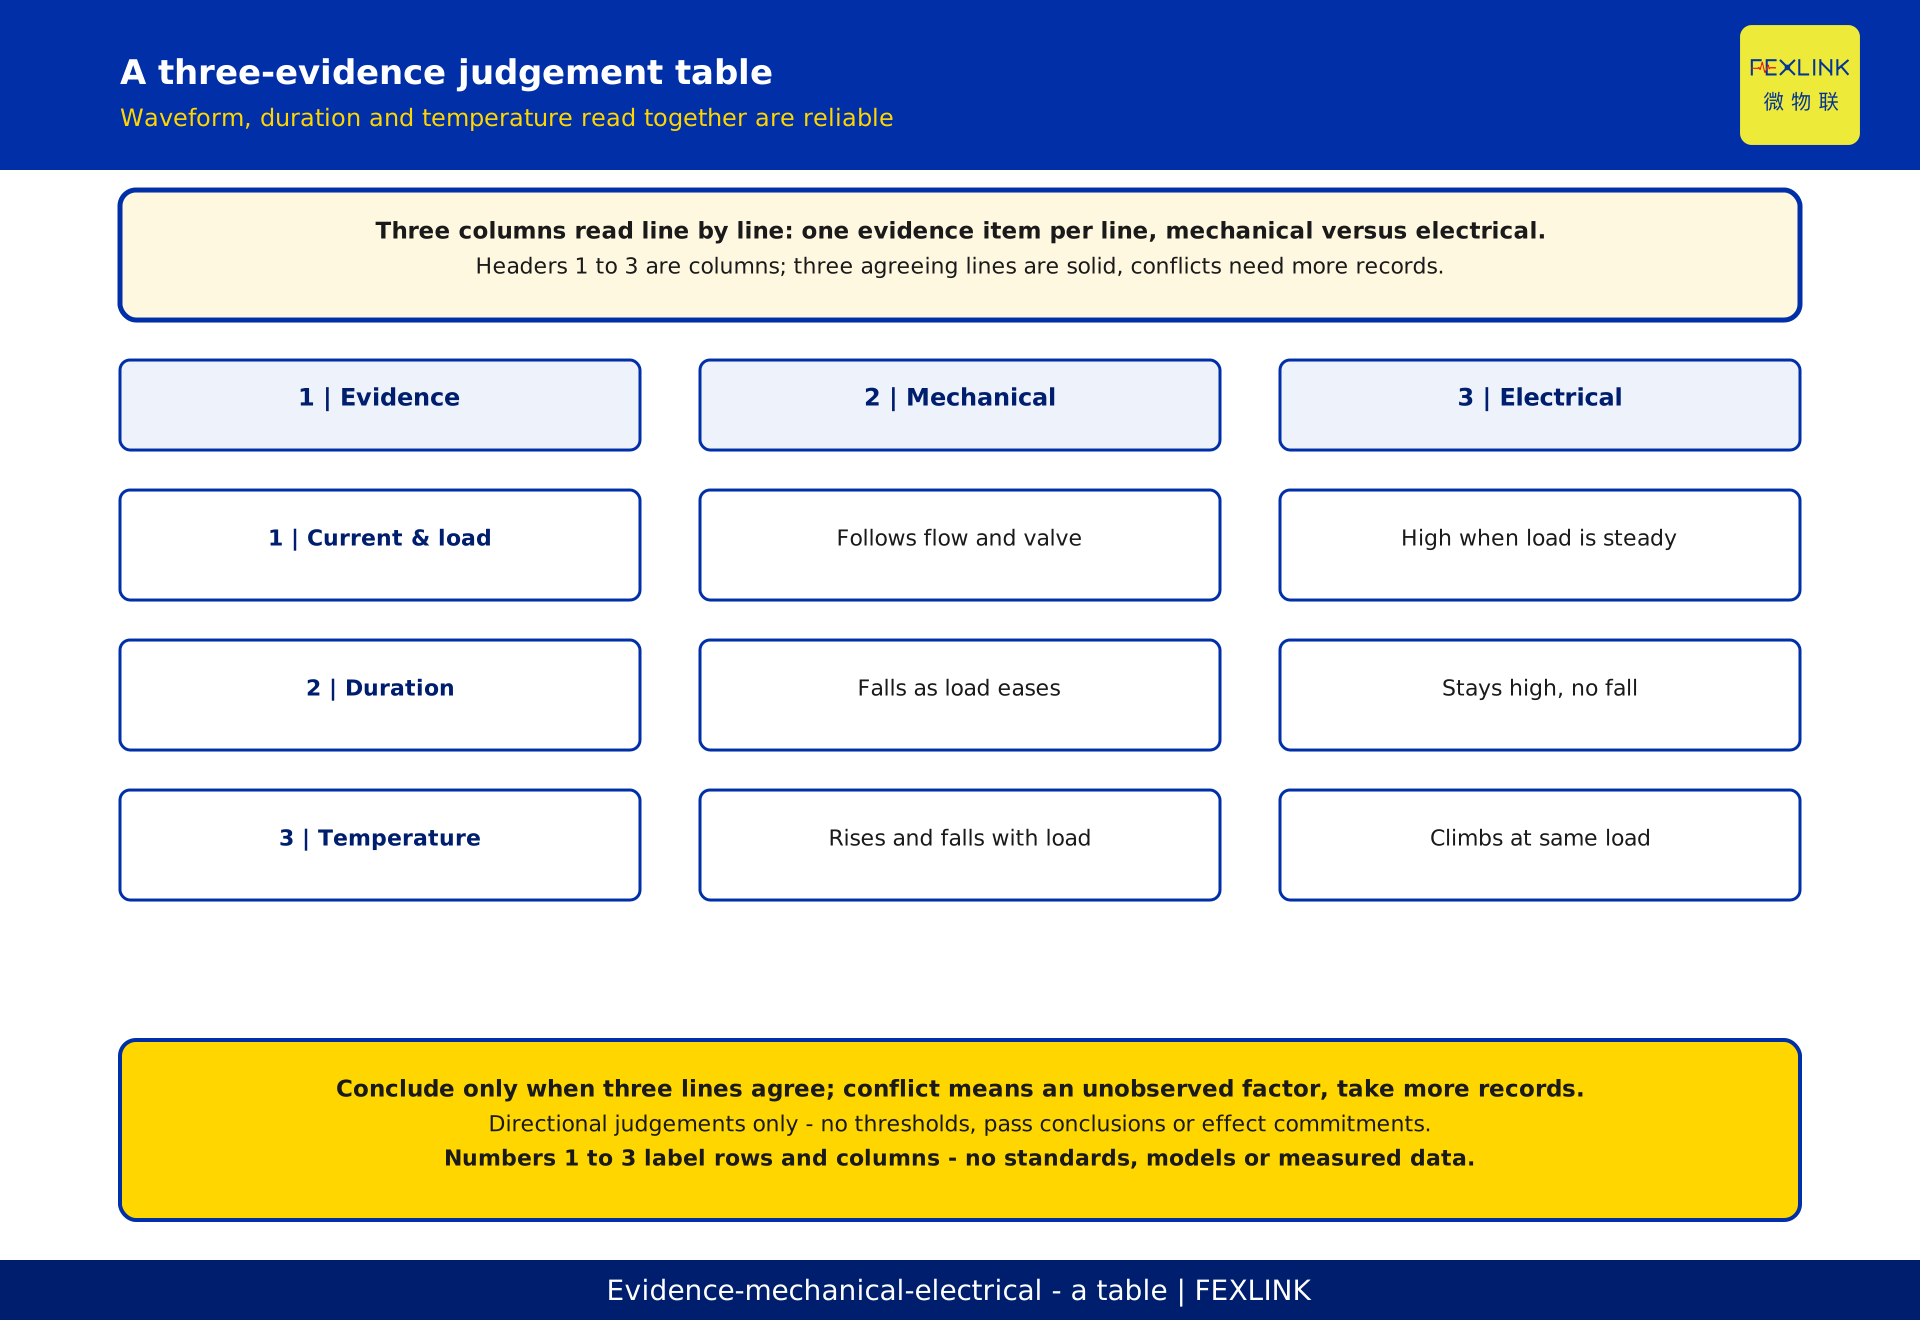
A single line misleads; three together are reliable: waveform for shape, overload duration for fall-back, temperature trend for accumulation. The table maps the three evidence lines to the two causes, giving only directional judgements, no thresholds or actions.
| 1 | Evidence | 2 | Mechanical overload | 3 | Electrical overload |
|---|---|---|---|---|---|
| Current and condition | rises and falls with flow and valve | stays high under steady conditions | |||
| Overload duration | falls when condition eases | stays high, no fall | |||
| Temperature trend | rises and falls with condition | climbs period by period at same condition |
Only when the three lines agree is the interpretation solid. If they conflict, an unobserved factor remains and more records should be taken. Whether a value exceeds a limit is confirmed by qualified parties against current texts and project files.
9. On-site troubleshooting order
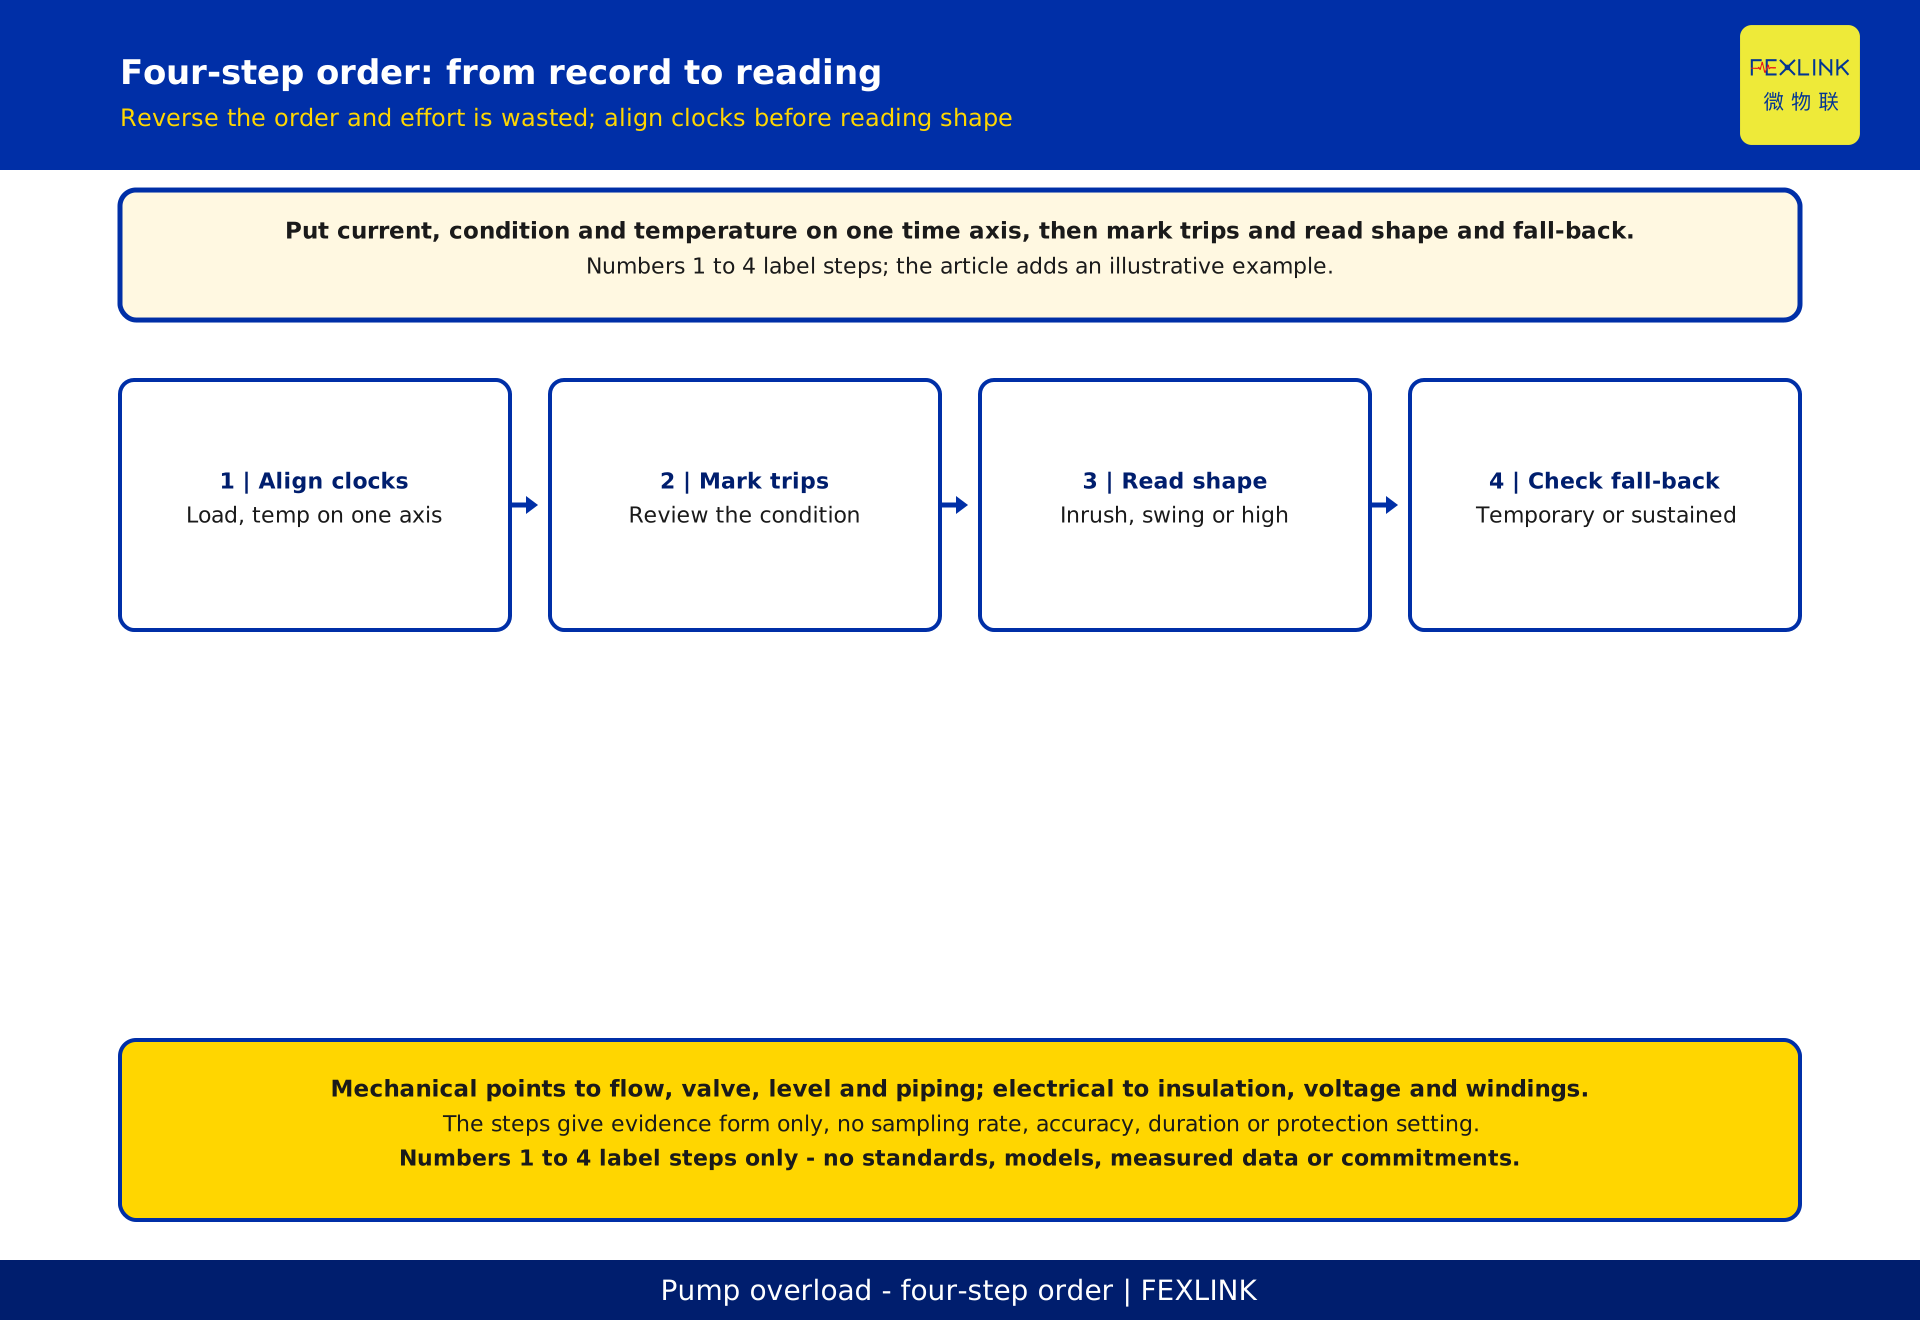
Order matters; reversing it wastes effort. Step 1, align clocks and put current, condition and temperature records on one time axis. Step 2, mark each trip moment and review the condition then. Step 3, read the current shape: inrush, condition swing or steady high. Step 4, see whether current and temperature fall after the trip, to judge a temporary inrush or a sustained overload.
With these four steps, decide where to look: mechanical side points to flow, valve, level and piping; electrical side to insulation, voltage and windings. The steps give only evidence form, no sampling rate, accuracy, duration or protection setting.
Separation from adjacent topics: crane sag covers how inrush causes voltage sag across system impedance and spreads outward; this piece covers how one pump's current shape separates mechanical from electrical overload — different objects and questions. Unattended pump stations cover which quantities to watch; this piece covers how to interpret once they are watched.
10. How products and the solution fit in
Mapping the interpretation onto devices, each data source has a role. The ESA all-element smart meter collects electrical parameters such as current and voltage, the basis for reading waveform and voltage. The EST multi-channel temperature controller continuously records winding and terminal temperatures, the source for the temperature-rise trend. The digital electrical intelligent supervision system brings electrical parameters, condition and temperature onto one time axis for aligned interpretation.
These products are registered by function and name only; no ranges, accuracy, channel counts or interfaces are expanded, no effects promised, and no selection or purchase advice given. Specifications follow the product technical data.
FAQ
Q: If the motor trips on overload, will replacing the cable with a thicker one fix it?
Not necessarily. If high current is a condition swing or heavy mechanical load, a thicker cable solves nothing; if it is electrical overload, first tell insulation decay from low voltage. Read waveform, duration and temperature, then decide what to replace.
Q: Does high current mean an electrical fault?
No. Starting inrush is higher but brief then falls; mechanical overload swings with the condition and falls when it eases. Only current that stays high under steady conditions points to the electrical side. Shape and duration, not magnitude, are the criterion.
Q: Why does the same pump sometimes trip and sometimes not?
Usually the condition or the start moment changes. With heavy condition, a wide valve or right at start, the current spike crosses the threshold; under light, steady operation it does not. This "unpredictability" is a difference in condition and timing, not a fault appearing and vanishing; aligning records on one time axis shows it.
Q: Why look at temperature separately — is current not enough?
Current is a state at one moment; temperature reflects accumulation over a period. A chronic electrical problem may not show in current but climbs period by period in temperature under the same condition. Two lines confirming each other make the interpretation solid.
Q: Which article should I read — this one, crane sag, or unattended pump stations?
It depends on the question. For how inrush causes voltage sag and affects nearby sensitive equipment, read the crane-sag piece. For which quantities an unattended station should watch, read the pump-station piece. For how to separate mechanical from electrical overload when a pump trips intermittently, read this one; the contribution here is judging electrical overload under steady conditions.
Scope and limitations
This applies to water-utility mechanical and maintenance staff separating mechanical from electrical overload in intermittent pump-motor trips using current waveform, overload duration and temperature-rise trend; it covers interpretation and troubleshooting order. It does not cover breaker trip-curve selection, protector settings, crane sag propagation or unattended monitoring configuration, each with its own article.
The rated-current baseline 1, about 6 times, about 1 second and about 1.2 times are all constructed illustrative assumptions, used only to demonstrate interpretation and magnitude with desensitised context, matching no real pump and serving no protection setting; actual values follow motor parameters, supply conditions and on-site measurement.
This article states no standard number, year, clause, limit, permissible value or conformity judgement; no current magnitude, operating time, temperature-rise rate, alarm threshold or pass boundary, with specific criteria following current effective standard texts, design files and on-site verification results. It is not a mandatory technical requirement.
Products and the solution are registered by name and function only; no ranges, accuracy or interfaces are expanded, no framework invented and no selection advice given. Effect data such as energy-saving rate or trip-reduction rate never enter the conclusion; final judgement of safety events rests with qualified parties, and this article is no safety commitment. All deliverables await review and owner verification; the author does not self-approve, and nothing is published.
Frequently Asked Questions
If the motor trips on overload, will replacing the cable with a thicker one fix it?
Not necessarily. If high current is a condition swing or heavy mechanical load, a thicker cable solves nothing; if it is electrical overload, first tell insulation decay from low voltage. Read waveform, duration and temperature, then decide what to replace.
Does high current mean an electrical fault?
No. Starting inrush is higher but brief then falls; mechanical overload swings with the condition and falls when it eases. Only current that stays high under steady conditions points to the electrical side. Shape and duration, not magnitude, are the criterion.
Why does the same pump sometimes trip and sometimes not?
Usually the condition or the start moment changes. With heavy condition, a wide valve or right at start, the current spike crosses the threshold; under light, steady operation it does not. This "unpredictability" is a difference in condition and timing, not a fault appearing and vanishing; aligning records on one time axis shows it.
Why look at temperature separately — is current not enough?
Current is a state at one moment; temperature reflects accumulation over a period. A chronic electrical problem may not show in current but climbs period by period in temperature under the same condition. Two lines confirming each other make the interpretation solid.
Which article should I read — this one, crane sag, or unattended pump stations?
It depends on the question. For how inrush causes voltage sag and affects nearby sensitive equipment, read the crane-sag piece. For which quantities an unattended station should watch, read the pump-station piece. For how to separate mechanical from electrical overload when a pump trips intermittently, read this one; the contribution here is judging electrical overload under steady conditions.