 FEXLINK Research Institute
The short answer
A voltage sag in a fab does not cost you the few seconds of lost output. It costs the wafers inside the process at that moment, plus the time to restart the line. And if your power monitoring only looks at energy and power, it is structurally blind to that event, because a sag barely registers in an energy metric.
What actually works is three things: push monitoring down to the tiers where responsibility can be located, record every sag with the same five fields, and use one yardstick to decide which machine is protected first. Together they form a four-stage loop: monitor, record, grade, govern.
One clarification first. A sag is a transient event, and no monitoring device can tell you the voltage is about to collapse. What it can do is compress the discovery time from "wait for the alarm, then dig through records" to "the system already left a timestamped event", and the localization time from "search tier by tier" to "look at direction and tier". What is warned about is the spread of the loss, not the dip.
I. Why energy-based monitoring misses sags
Energy, power and demand are integrals or time averages, and a sag is far too short to move them. If voltage is reported only as a minute-level or daily average, the dip is smoothed away and the dashboard stays flat.
The result on the floor is familiar. A tool trips: the controller resets, the drive alarms, the batch is aborted. An engineer checks for a recent trip or reclose, finds nothing, and files it as component aging or a random fault. Replace the module, keep running. The same tool "occasionally" stops three times in months and nobody can explain them, because the facts that mattered were never recorded: how deep, how long, when.
That is the shift that must happen. A sag is an event, not a reading, and must be captured as a discrete record with timestamp, residual voltage and duration rather than averaged into a statistic. The goal changes: not a pretty curve, but a guarantee that every dip leaves a comparable record.
II. Two source sides, and what to check first
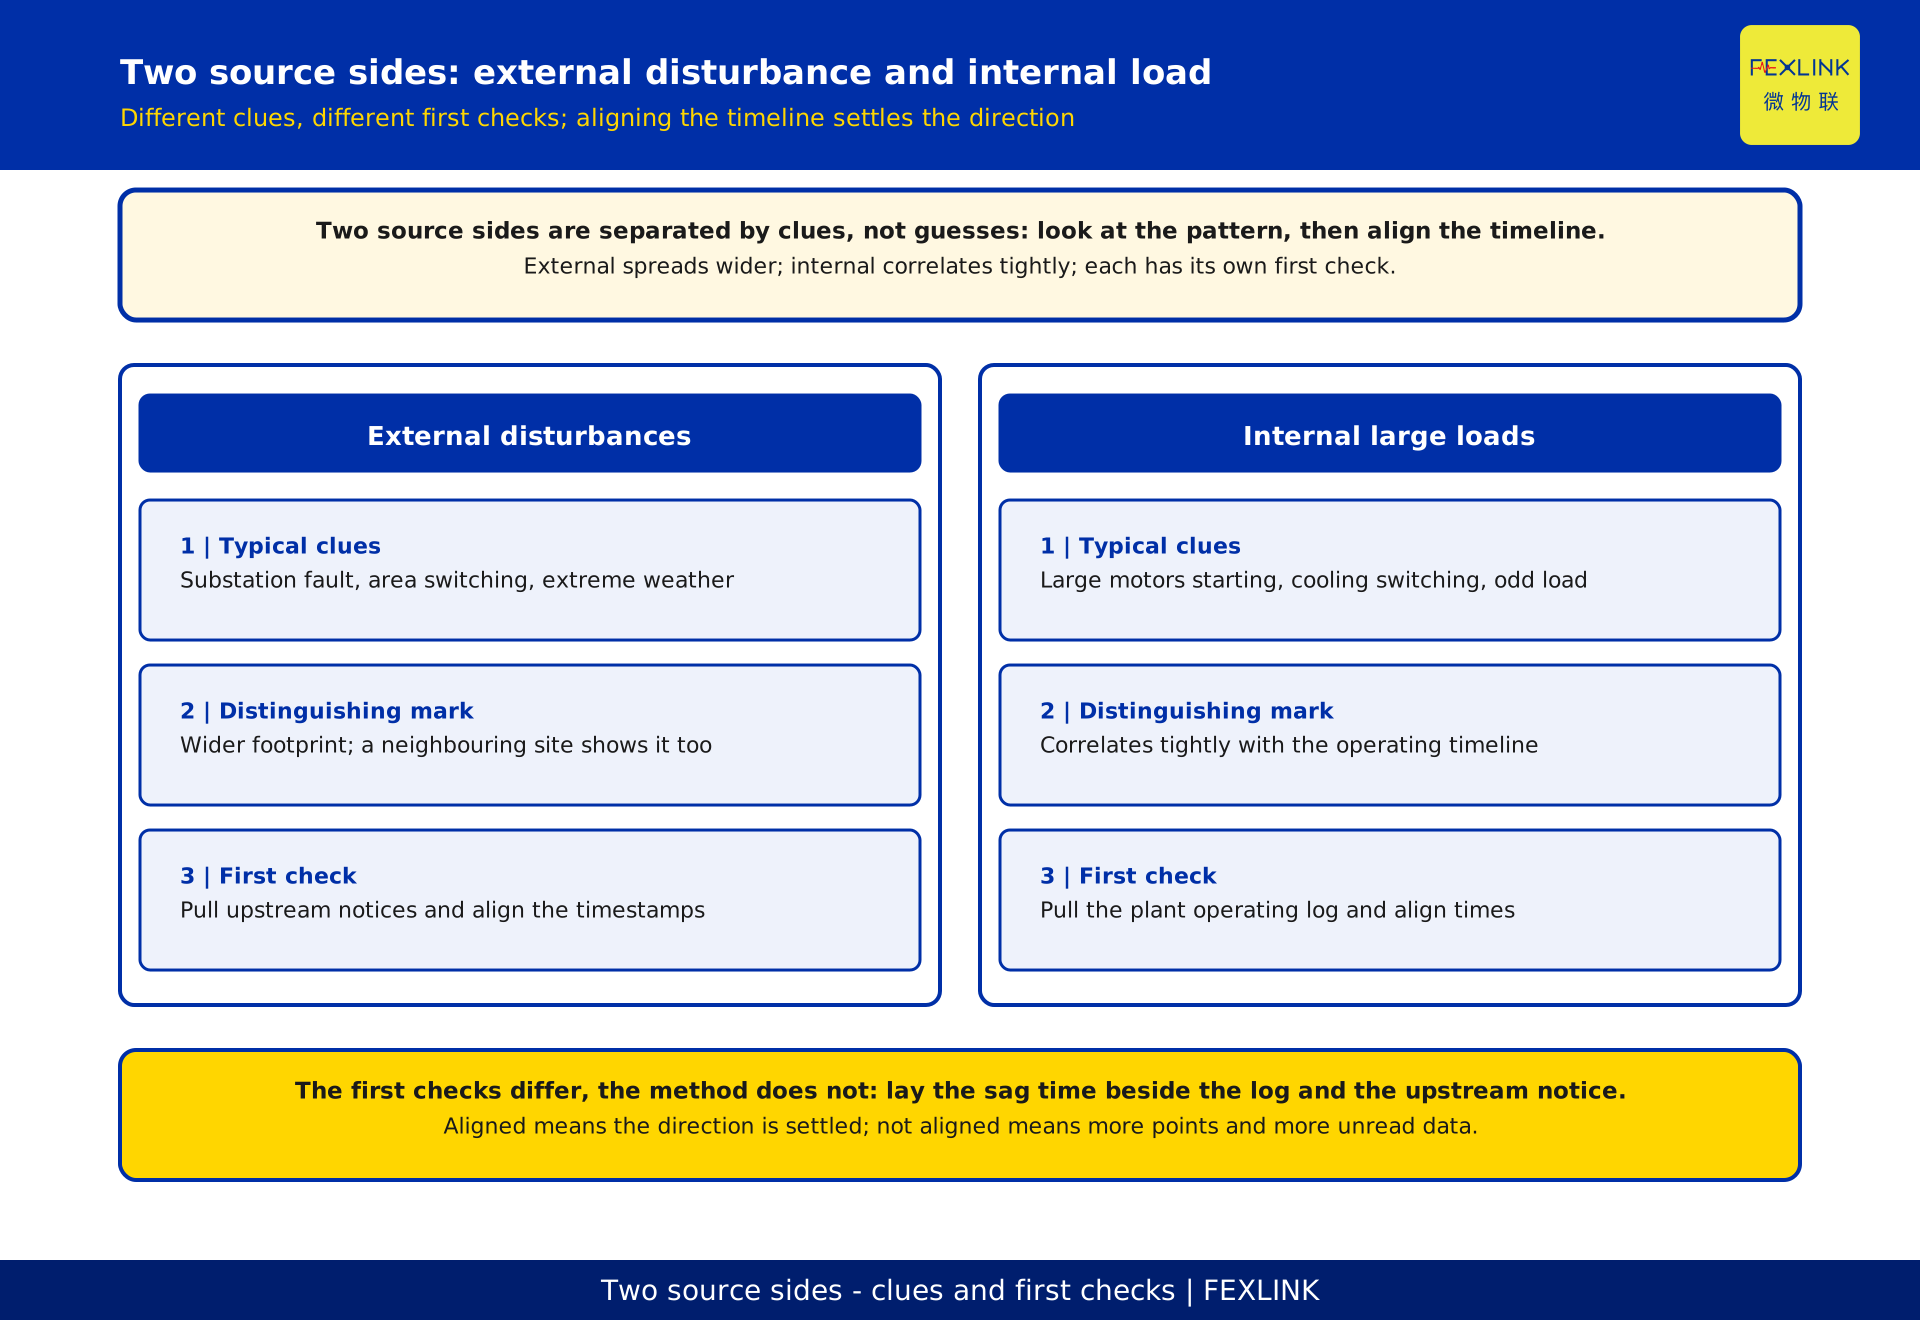
Sags arrive from two directions, and the diagnostic clues differ completely.
| 1|Source side | 2|Typical clues | 3|First action |
|---|---|---|
| External grid | Substation fault, area maintenance switching, extreme weather, a large neighbouring customer | Pull upstream dispatch notices and outage plans, align timestamps to the external window |
| Internal large load | Large motors starting and stopping, cooling and compressed-air switching, unexpected plant-in-load | Pull the plant operating log, align timestamps to load operation times |
External disturbances tend to have a wider footprint than your own plant. If a neighbouring site shows the same behaviour in the same window, that points outward, and they arrive in clusters rather than alone. Internal sources correlate tightly with the operating timeline, sometimes down to one start command.
So the highest-value first step is not buying more hardware, it is time alignment: lay the timestamp of every sag event alongside the internal large-load operating log and upstream maintenance announcements. Once they line up, the direction is settled. If not, extra points only produce more data nobody can read.
III. Three monitoring tiers: incomer, utility panels, process-area PCC
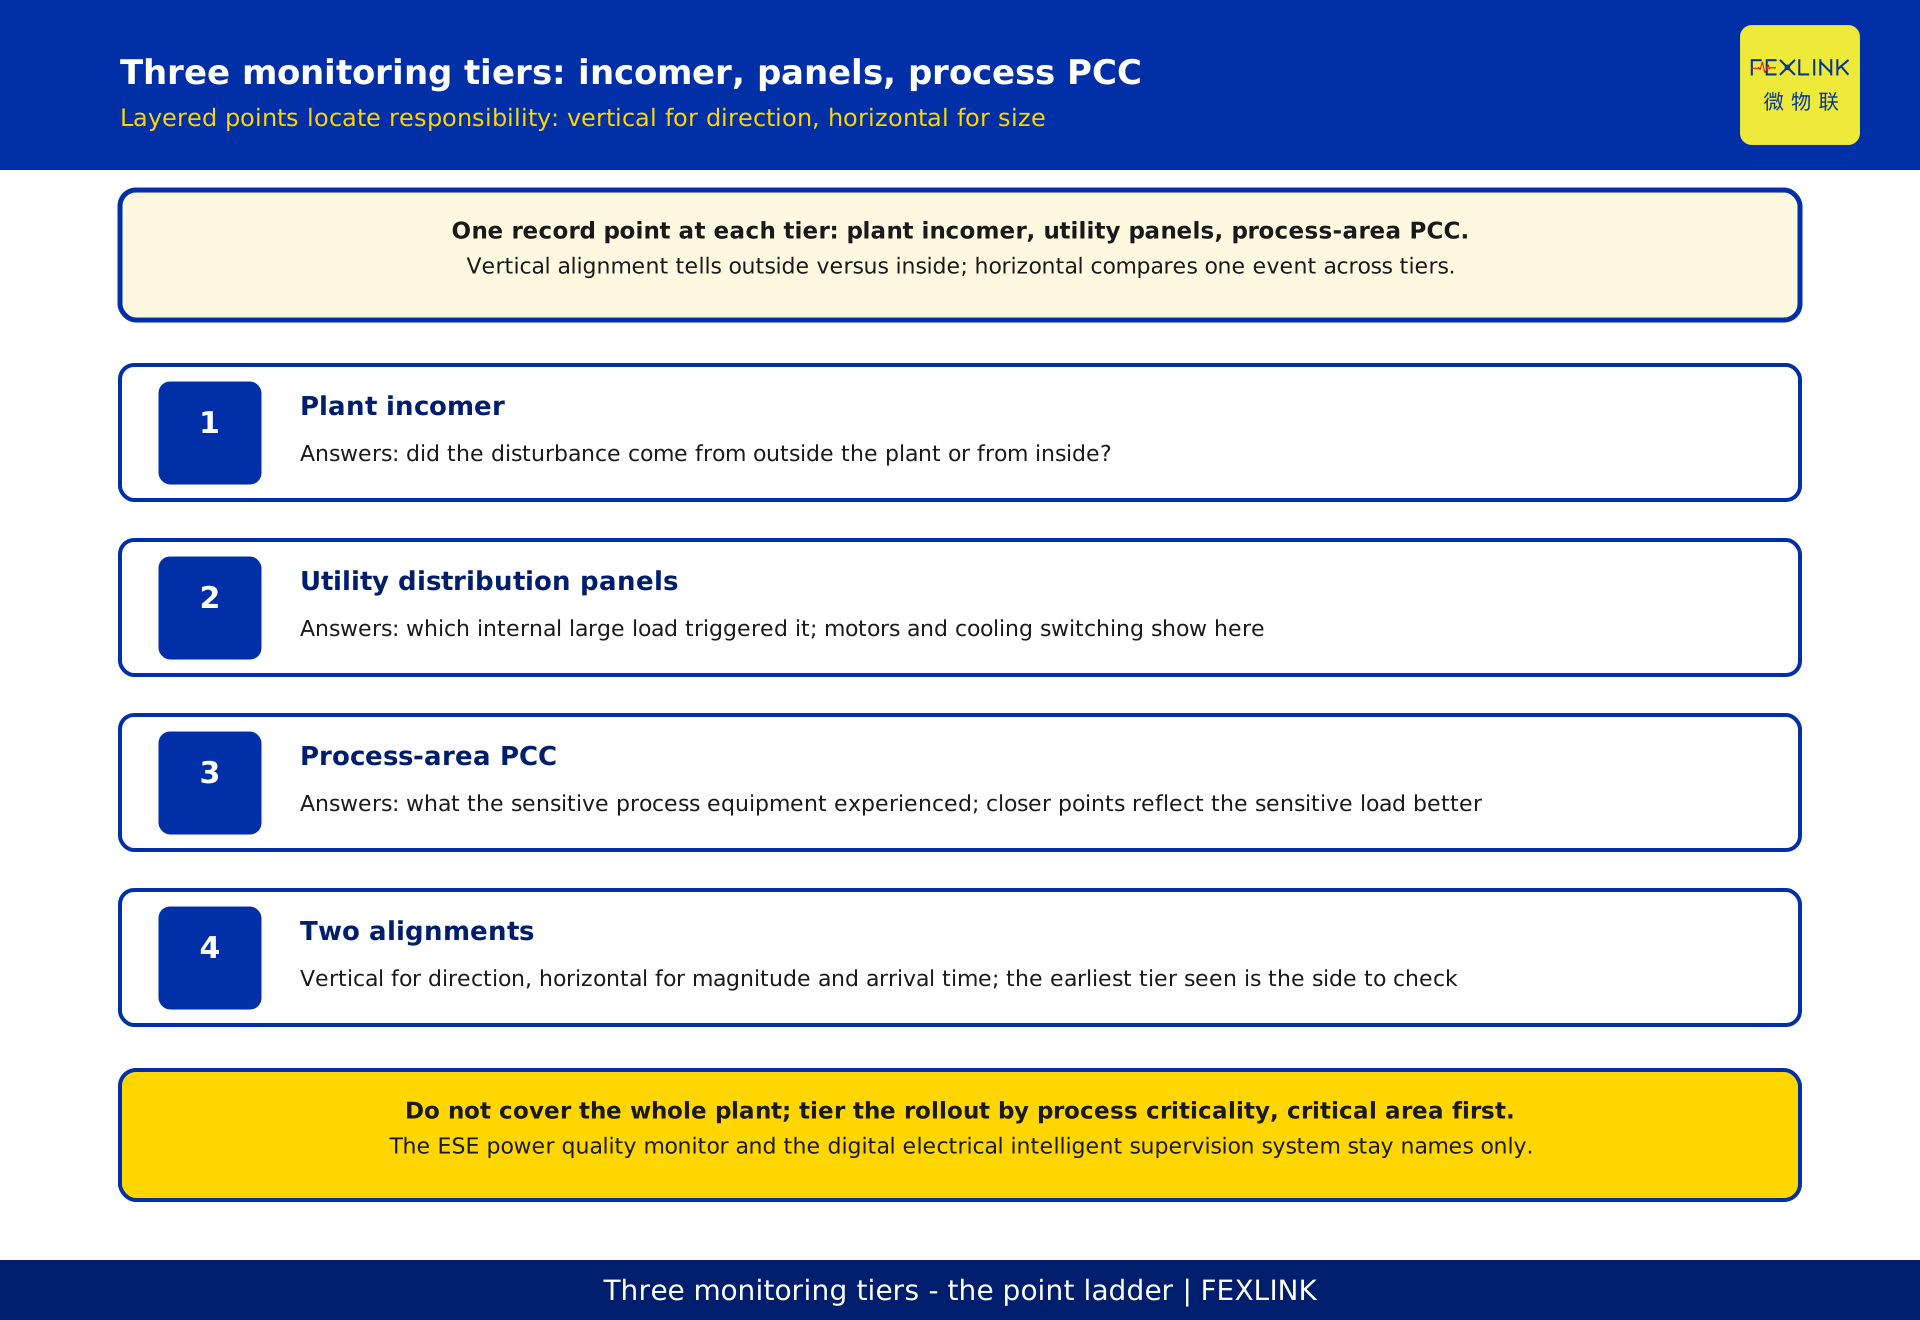
To answer "whose fault is it" inside the plant, monitoring has to be layered.
| 1|Tier | 2|Location | 3|Question it answers |
|---|---|---|
| 1 | Plant incomer | Did the disturbance come from outside the plant |
| 2 | Utility distribution panels | Was some large internal load the trigger |
| 3 | Process-area PCC (point of common coupling) | What the sensitive process equipment experienced |
With all three online you get two kinds of alignment. Vertical alignment tells you whether the disturbance came from outside or was generated inside. Horizontal alignment compares the magnitude and arrival time of the same event across tiers.
If several points log the same disturbance, the time difference indicates the propagation direction: whichever tier sees it first is the side to investigate. That turns "something happened" into "here is where it is".
Covering the whole plant is neither realistic nor necessary. Tier the rollout by process criticality instead: build the tier 3 points in the most critical process area first, then add the incomer so the external boundary can be recognised, extending to the utility tier only where needed. The closer a point sits to the equipment, the better it reflects the sensitive load.
IV. Five fields that make a sag record comparable
For events to be compared, every record has to carry the same five fields.
| 1|No. | 2|Field | 3|What you lose without it |
|---|---|---|
| 1 | Residual voltage | You know it dipped, not how deep, so events cannot be ranked |
| 2 | Duration | You know how low, not how long, so it cannot be compared to tolerance |
| 3 | Timestamp | It cannot be aligned with operating logs, so attribution is guesswork |
| 4 | Direction | You cannot tell an imported disturbance from an internal one, so remediation lands wrong |
| 5 | Recovery shape | You cannot separate a sag from a short interruption, so the response is wrong |
Field 3 is the most underrated. If the timestamp is precise enough to align against logs, the investigation shifts from inference to cross-checking. If not, alignment never happens.
A common format buys one more thing: only events in the same format and judged by the same criteria can be counted as a frequency. When one location keeps producing the same event shape for months, it stops being a random fault and becomes a manageable pattern, and that justifies remediation.
V. The equipment tolerance curve: direction only
An equipment tolerance curve relates two variables: duration on the horizontal axis, residual voltage after the disturbance on the vertical axis, with the boundary marking the combinations the equipment rides through.
This article uses the curve for one purpose only, direction. Plot the measured residual voltage and duration as a point and see which side of the boundary it falls on. The direction gives remediation priority directly: outside the boundary first, hugging it next, far inside can wait.
Three caveats matter. First, plot comparison only makes sense if the plant uses one source of curves and one set of criteria. Second, this article ranks by direction only and issues no pass or fail judgement; standard numbering, limits and conformity assessment belong to standard interpretation. Third, the curve feeds grading rather than ending the loop, turning "this machine is vulnerable to this event" into a rankable list.
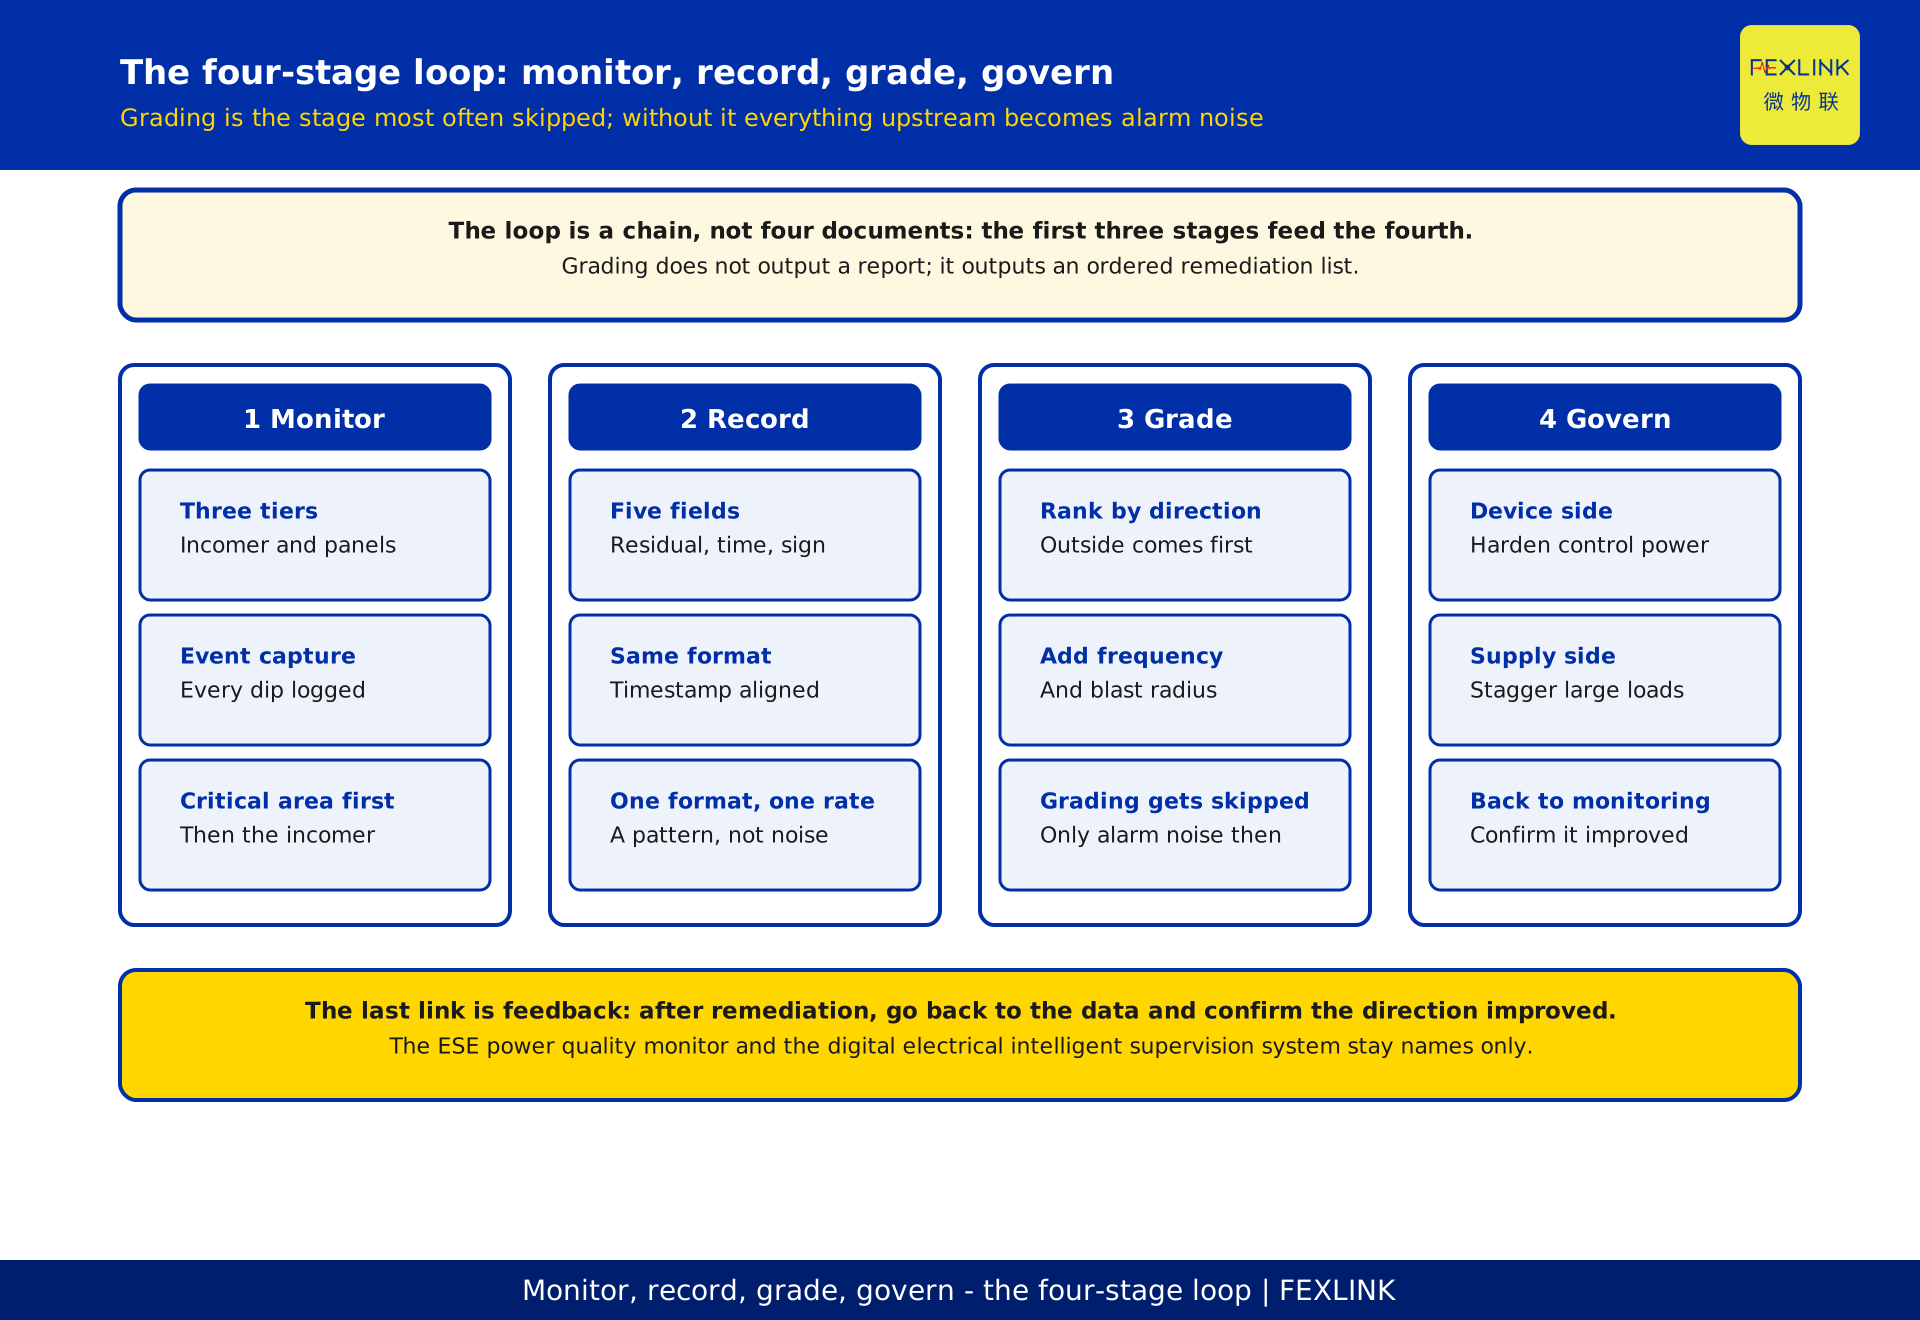
VI. The four-stage loop: monitor, record, grade, govern
The stage most often skipped is grading.
1 Monitoring: event-level capture at the three tiers, so every dip leaves a record. 2 Recording: written in the common five-field format, timestamps aligned enough to check against external logs. 3 Grading: ranked by plot direction, frequency and blast radius, producing a priority list someone can execute. 4 Governance: funding device-side and supply-side measures in that order.
If grading is missing, everything upstream degrades into another layer of alarm noise: events every day, every one raised, and nobody knows what to fix first. Grading outputs not a report but an ordered remediation list.
Closing the loop takes one more link. After remediation, go back to the monitoring data and confirm the plot direction for the affected point has improved. Without it, remediation ends when the invoice is paid, the effect cannot be verified, and the next round of priorities has no evidence.
VII. Ranking remediation by vulnerability
Three dimensions are available: how narrow the process window is, how often the event repeats, and how directly it hits work in progress.
Two mistakes are common here. The first is ranking by equipment value, but value and the vulnerability of work in progress are not proportional: a cheap machine in a critical step deserves protection ahead of an expensive one in a non-sensitive step. The second is ranking by estimated loss, but the cost of a sag is hard to calculate because the value in process keeps changing, so the funding argument never closes.
A more workable approach crosses vulnerability against frequency. High vulnerability and low frequency can usually be handled once on the device side. High frequency and moderate vulnerability is better addressed on the supply side. Both high goes to the top.
Remediation has two lines. The device side covers control power conditioning, uninterruptible supply support, isolation and surge protection, and hold-up time settings. The supply side covers upstream switching coordination, staggering of large internal loads, and dynamic voltage recovery. Which line you take depends on whether the data points to the source direction, which the three-tier layout and direction field answer.
VIII. Common mistakes
The first mistake is assuming that fitting a power quality monitor means you are monitoring sags. Whether event-level capture exists depends on whether the device outputs standalone sag entries with timestamp, residual voltage and duration, not on whether a curve exists.
The second is reading early warning as knowing in advance that a dip is coming. As above, what can be brought forward is diagnosis and localization, not the dip.
The third is drawing conclusions from a single point. One point cannot resolve direction or responsibility; it can only say something happened.
The fourth is treating flicker or a short interruption as a sag. Flicker is a sustained magnitude problem; a short interruption is a drop to near zero held for a period. They call for different responses, and mixing them drags remediation off target.
IX. Where this article stops
This article covers monitoring configuration and the closed loop for cleanroom scenarios, and leaves out the following.
How to read the tolerance curve itself, how to take the axes, and how to judge a cloud of plotted points belong to standard interpretation, handled in a dedicated article; here the curve only says which side of the boundary a point falls on.
How to lay out monitoring points is discussed separately for harmonic remediation, where the object of judgement is a frequency, not an isolated event.
Source-side treatment of flicker and voltage fluctuation is another line of work, aimed at sustained magnitude swings from large impact loads, not the transient dip here.
The ESE power quality monitor and the digital electrical intelligent supervision system are registered here by name only, with no model selection, measurement range, channel count, communication method, cost figure or performance figure.
FAQ: frequently asked questions
Q: If I fit a single monitor on the plant incomer, can I still work out which internal load caused it?
No. A single incomer point tells you the disturbance arrived; it cannot allocate responsibility inside the plant. Separating an imported disturbance from an internal one needs the utility and process-area tiers online together, with timestamps aligned to operating logs.
Q: Sags are so short. Will an ordinary power quality monitor actually catch them?
What matters is not the device category but whether event-level capture is provided. The test is whether the device outputs standalone sag entries with occurrence time, residual voltage and duration, and whether they can be compared across events. A statistical curve or an average voltage will not do.
Q: Now that you know the cause, does remediation just mean adding uninterruptible power supply?
Not necessarily. Remediation runs on a device side and a supply side, and which applies depends on where the disturbance originated. If the data points to an internal large load, supply-side switching coordination and load staggering are more economical than uninterruptible supply across the line.
Q: The sag frequency is low. Is a three-tier setup still worth it?
Worth it, but it does not have to be built at once. Low frequency does not mean low loss, because one event that scrapes a batch of wafers can cost more than the monitoring investment. Instrument the critical process area first and let the data decide if more tiers are needed.
Q: If the plot falls outside the curve boundary, does that mean the equipment is non-compliant?
No. Falling outside only means this disturbance exceeded the equipment's tolerance, which is the input to grading. Standard numbering, limits and conformity assessment are out of scope and must be confirmed separately under the standard-interpretation approach.
Scope and limitations
This article applies to scheme design discussions in semiconductor, display panel and similar cleanroom environments where voltage sag monitoring and remediation priority must be established for critical process loads. The readers are plant utilities and facilities engineers.
Three preconditions apply. The site must be able to align event-level data against internal operating logs and upstream grid notices. There must be a consensus on how process criticality is tiered. The remediation side must also have the budget and decision path to act on the grading list. Miss one and the loop does not close.
No standard numbering or limit definition is used here, and no conformity assessment is made. No measurement range, channel count, communication method or model selection advice is given for any product. No cost figure, ratio, loss or performance figure appears, and all cases are generic. The tiered layout here is a general engineering approach; a real scheme must derive from the site's distribution structure and load distribution.
Frequently Asked Questions
If I fit a single monitor on the plant incomer, can I still work out which internal load caused it?
No. A single incomer point tells you the disturbance arrived; it cannot allocate responsibility inside the plant. Separating an imported disturbance from an internal one needs the utility and process-area tiers online together, with timestamps aligned to operating logs.
Sags are so short. Will an ordinary power quality monitor actually catch them?
What matters is not the device category but whether event-level capture is provided. The test is whether the device outputs standalone sag entries with occurrence time, residual voltage and duration, and whether they can be compared across events. A statistical curve or an average voltage will not do.
Now that you know the cause, does remediation just mean adding uninterruptible power supply?
Not necessarily. Remediation runs on a device side and a supply side, and which applies depends on where the disturbance originated. If the data points to an internal large load, supply-side switching coordination and load staggering are more economical than uninterruptible supply across the line.
The sag frequency is low. Is a three-tier setup still worth it?
Worth it, but it does not have to be built at once. Low frequency does not mean low loss, because one event that scrapes a batch of wafers can cost more than the monitoring investment. Instrument the critical process area first and let the data decide if more tiers are needed.
If the plot falls outside the curve boundary, does that mean the equipment is non-compliant?
No. Falling outside only means this disturbance exceeded the equipment's tolerance, which is the input to grading. Standard numbering, limits and conformity assessment are out of scope and must be confirmed separately under the standard-interpretation approach.