 FEXLINK Research Institute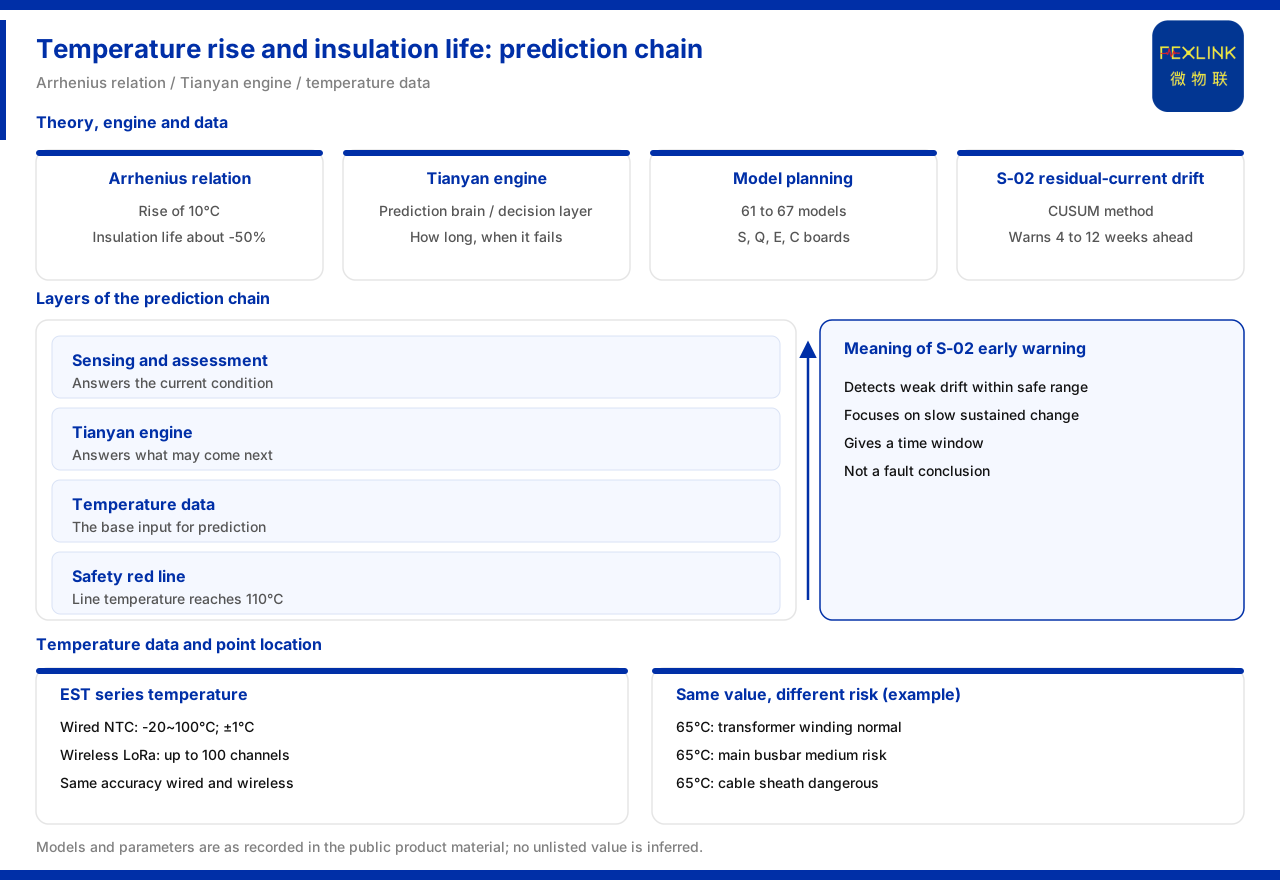
Temperature rise and insulation life: how is "how much longer can the equipment last" actually calculated?
Direct answer: the available product material answers "how much longer can the equipment last" on two levels. The first level is the theoretical basis: an accelerating relationship exists between temperature rise and insulation life, where every 10°C increase in temperature rise shortens insulation life by about 50%, and the theoretical basis for this is the Arrhenius equation. The second level is the engineering implementation: the Tianyan engine is positioned as the "predictive brain · decision layer", used to answer how much longer a device can last, when it will fail, and which time window is suitable for maintenance. To give the prediction a data foundation, temperature collection is also needed; the EST multi-channel temperature intelligent controller provides wired NTC temperature measurement from -20 to 100°C with an accuracy of ±1°C, and wireless LoRa temperature measurement for up to 100 paths. Theory, engine and data must all be present for the prediction to hold.
What the Arrhenius relationship shows
The relationship between temperature rise and life is not linear but accelerating. The material cites the Arrhenius equation and gives the formulation that a temperature rise of 10°C shortens insulation life by about 50%. Its engineering meaning is that a sustained small rise in temperature significantly compresses the usable life of the insulation. Attention to temperature should therefore not stop at "whether it exceeds the limit" but should also ask "whether it stays high for a long time".
The same relationship reminds us that the value of temperature monitoring lies in the trend, not only in the instantaneous value. Insulation degradation is often gradual; if a reaction occurs only when the temperature exceeds the limit, an earlier intervention window may already have been missed. Only by making temperature a trackable time series can life inference become possible.
Where the Tianyan engine sits in the system
The material positions the Tianyan engine as the "predictive brain · decision layer", whose core value is to answer three kinds of question: how much longer this device can last, when it will fail, and which time window is suitable for maintenance. Unlike the ability to "identify the current state", Tianyan faces the future time dimension and outputs judgements about remaining capability and maintenance timing.
In the division of labour, the upstream perception and analysis handle "what the current situation is", while Tianyan handles "how it may develop next". This layering means that life prediction cannot exist separately from the preceding perception data; without inputs such as temperature and current, the prediction layer has no basis. When discussing Tianyan, therefore, its data sources must be discussed at the same time.
Model count and the board wording
The material records that the plan for later versions of the Tianyan engine includes 61 to 67 models, divided into the four boards S, Q, E and C, plus special topics. What appears here is an interval rather than a definite number, indicating that the model count has version differences in the planning. In external statements the interval and the version note should be retained, and the interval should not be written as a single definite value.
The four-board division shows that the models are organised by capability domain rather than by a single device. This means one board may cover several device types and several fault modes. For users, understanding the board division helps choose the models needed by capability domain rather than searching item by item through a product list.
How S-02 achieves early warning
The material lists S-02, one of the signature Tianyan models, named residual-current trend drift and using the CUSUM method. Its feature is that while the leakage is still within the safe range, for example at 18 mA, it can still detect a weak mean drift and give a warning 4 to 12 weeks in advance. The "weak mean drift" is the key: it focuses on a slow and sustained change rather than on the moment a threshold is touched.
This capability explains why trend analysis is earlier than threshold alarming. A threshold triggers only after it is crossed, whereas drift detection can find the direction of an anomaly before the limit is exceeded. Note that an early warning gives a time window, not a fault conclusion; it signals "attention or maintenance should be arranged", which is not the same as "a problem is certain to occur".
Where the temperature data comes from
Prediction needs input, and temperature is one basic type of input. The EST multi-channel temperature intelligent controller provides both wired NTC temperature measurement and wireless LoRa temperature measurement. The wired NTC measurement range is -20 to 100°C with an accuracy of ±1°C; the wireless active measurement uses LoRa and supports up to 100 paths. The former suits fixed, short-distance measuring points, while the latter suits situations with many or widely distributed points.
Regarding the wireless type, the material gives a maximum of 100 paths but does not give the test conditions for the effective distance or the relay rules. When laying out points, therefore, coverage cannot be inferred from the path count; the distance between the measuring point and the receiver must still be confirmed against the actual site.
The same temperature can mean completely different risk
The material mentions a location-aware example: the same 65°C is normal on a transformer winding, medium risk on a main busbar, and dangerous on a cable sheath. This shows that temperature risk cannot be judged from the value alone; the location of the measuring point and the equipment type must also be considered.
The implication for scheme design is that when deploying temperature points, the location attribute of each point should be recorded together with the temperature value. The same reading on different components corresponds to different handling priorities. Only by bringing location information into the data model can a "location-aware" judgement be possible.
Safety threshold and red line
In its safety rules the material gives a hard formulation for line temperature: a line temperature reaching or exceeding 110°C is a red line that cannot be bypassed, and the basis points to GB 16895. This means 110°C is not a negotiable alarm line but a protection condition that must trigger. When a scheme involves line-temperature monitoring, that threshold should be treated as a safety constraint independent of trend analysis, rather than being submerged among ordinary alarms.
When the 110°C red line and trend warning are placed side by side, their duties differ: trend analysis answers "is it developing in an unfavourable direction", while the red line answers "has it already crossed the boundary". A scheme should retain both kinds of judgement; the hard threshold must not be weakened just because a trend model exists, nor should early warning be abandoned in favour of the threshold alone.
Material boundaries and practical notes
First, the material gives no parameter differences of the Arrhenius relationship across specific insulation materials, so "a 10°C rise halves life" should be treated as an overall formulation and not extrapolated material by material.
Second, the material gives no complete list of the 61 to 67 models or their enabling conditions; planning and implementation must be distinguished.
Third, the material gives no false-alarm rate or tuning rule for S-02; actual use must be verified against field data.
Fourth, the material gives no entry specification for the location attribute of temperature measuring points; this must be defined on the scheme side.
Summary
The judgement of temperature rise and insulation life can be strung into one chain: the Arrhenius equation explains the theoretical relationship of accelerated degradation by temperature rise, with a 10°C rise shortening insulation life by about 50%; the Tianyan engine takes the role of "predictive brain · decision layer", answering how much longer, when it will fail and which period to maintain; the EST multi-channel temperature intelligent controller provides wired NTC measurement from -20 to 100°C with an accuracy of ±1°C and LoRa wireless measurement for up to 100 paths; and S-02 residual-current trend drift gives a warning 4 to 12 weeks ahead while still within the safe range. A line temperature reaching 110°C is a safety red line and must be handled independently.
Keeping the theoretical formulation, the engine positioning, the data sources and the safety threshold separate is what prevents a life-prediction scheme from mistaking "theoretically possible" for "a field conclusion".