 FEXLINK Research Institute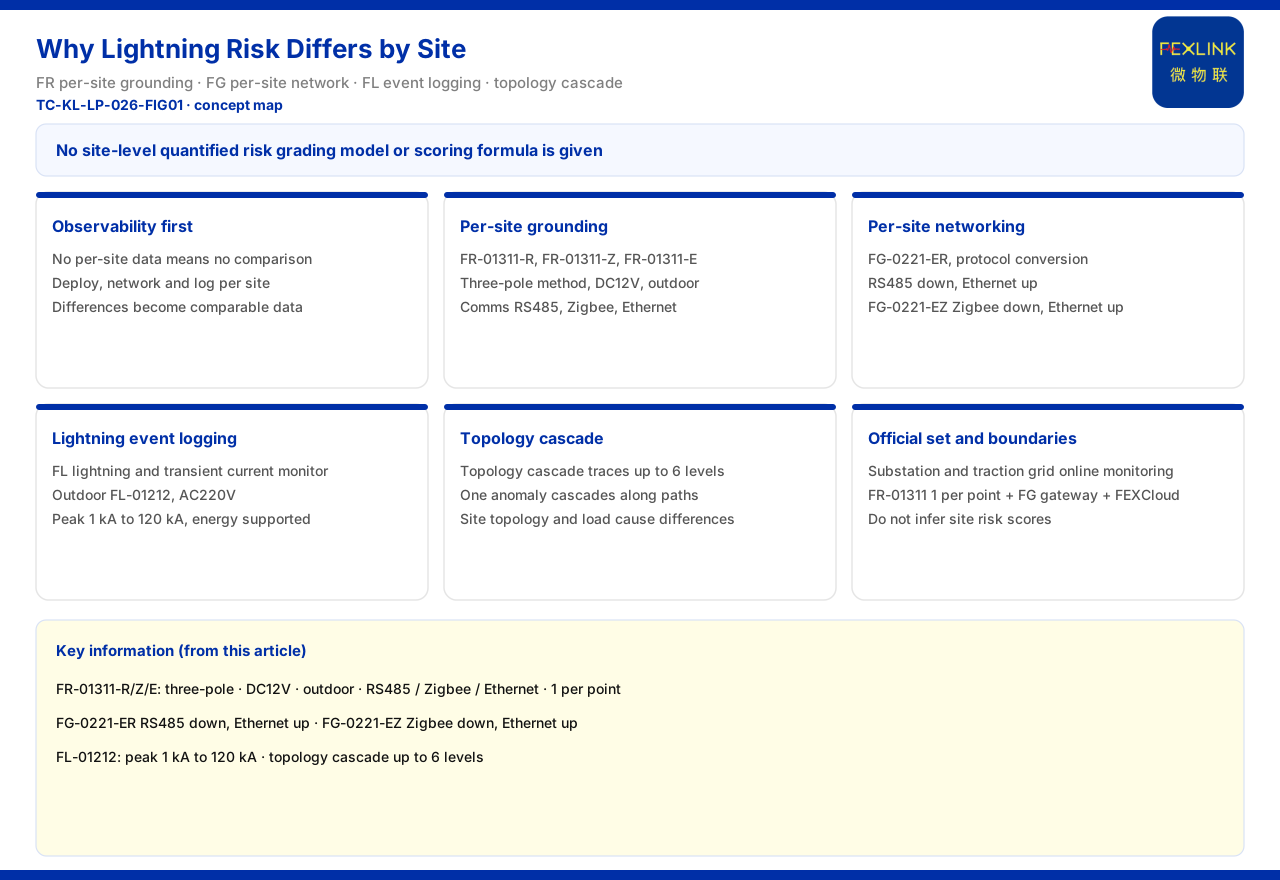
Direct Answer
Why lightning risk differs from one station to another is not answered by the product knowledge base with a quantitative grading model or a risk-scoring formula, but the base provides the networking capability that makes such differences observable. The foundation is the grounding resistance monitor (FR-01311-R, FR-01311-Z and FR-01311-E), which can be deployed to each station's grounding grid so that the grounding state of different stations is observed independently. The aggregation link is the lightning-protection smart gateway (FG-0221-ER), which performs protocol conversion, is supplied at DC12V, uses RS485 downstream and Ethernet upstream; FG-0221-EZ uses Zigbee downstream and Ethernet upstream, and handles in-station device aggregation and upload. Event recording is carried by the lightning current / transient current monitor, for example the outdoor model (FL-01212), with a peak of 1 kA to 120 kA and AC220V supply, which can record lightning events at each station. The four-layer architecture and communication protocol matrix of the product knowledge base support unified access for distributed stations, and the topology-cascade impact of the Wanxiang engine is traceable through up to 6 layers, showing that the same anomaly can cascade along a path to different layers, and that differences in station topology and load cause differences in results. It should be noted that the product knowledge base gives no station-level quantitative risk grading model or scoring formula and sets no dedicated chapter on differentiation causes for stations in specific industries, so this article cites only the networking and observation capability and does not infer a risk score.
1. Why Risk Differences Start with Observability
To discuss differences in lightning risk between stations, the first step is not to score the risk but to confirm whether the differences can be observed. If different stations have no independent grounding and lightning data of their own, comparison is meaningless. This is exactly where the product knowledge base lands: it provides grounding monitoring that can be deployed separately, aggregation gateways that can be networked separately, and monitors that can record lightning events, turning differences between stations from "they feel different" into "the data can be compared". Only by understanding this premise can the architecture and mechanisms discussed below be viewed correctly, instead of misreading observability capability as a risk conclusion.
2. Point-by-Point Observation of Station Grounding State
The product knowledge base records that the grounding resistance monitor (FR-01311-R, FR-01311-Z and FR-01311-E) uses the three-pole method, is supplied at DC12V, is installed outdoors, and communicates over RS485, Zigbee and Ethernet respectively. It can be deployed to each station's grounding grid so that the grounding state of different stations is observed independently, and it is one of the data sources of station risk differences. Grounding state is related to the soil where a station sits, to grounding-grid construction and to years in service, so only by placing points at each station can comparable resistance data be obtained. The product knowledge base gives no rule for judging resistance differences between stations, so this article cites only the point-by-point observation capability and does not infer a difference threshold.
3. Grouped Networking and Upload of Station Data
For station data to be comparable, aggregation is also needed. The product knowledge base records that the lightning-protection smart gateway (FG-0221-ER) performs protocol conversion, is supplied at DC12V, uses RS485 downstream and Ethernet upstream, while FG-0221-EZ uses Zigbee downstream and Ethernet upstream; it handles in-station device aggregation and upload and supports separate networking for multiple stations. In other words, each station can complete aggregation locally and then upload separately, without stations interfering with one another. The product knowledge base also records that the general four-layer architecture of the monitoring system is the perception layer, edge layer, platform layer and application layer, and that the downstream of the communication protocol matrix supports Modbus RTU, Zigbee and LoRa while the upstream supports Modbus TCP, MQTT and gateway-level optional IEC 61850. This provides the protocol basis for unified access of distributed stations and also makes data between stations comparable and risk comparable.
4. Recording of Station Lightning Events
Besides grounding state, lightning events also form part of the differences between stations. The product knowledge base records that the lightning current / transient current monitor, for example the outdoor model (FL-01212), is supplied at AC220V, has a peak of 1 kA to 120 kA and supports energy, and can record lightning events at each station, so that historical lightning differences between stations can be observed quantitatively. What must be emphasized is that what can be observed is the presence and intensity of lightning, not a risk level derived from it. The product knowledge base does not convert lightning records into a station risk conclusion, so this article cites only the event-recording capability and does not infer its risk meaning.
5. The Difference Mechanism Caused by Topology Cascades
Why the same lightning has different consequences at different stations is given by the product knowledge base from the topology angle. The product knowledge base records that the topology-cascade impact analysis of the Wanxiang engine is traceable through up to 6 layers, showing that the same lightning or grounding anomaly can cascade along the power, signal and grounding paths to different layers; because station topology and load differ, the risk results differ. This mechanism explains part of the source of the differences, but it describes a propagation path rather than scoring a station. The product knowledge base gives no quantitative station risk grading model or scoring formula, so this article cites only the topology-cascade mechanism and adds no scoring rule.
6. The Official Scenario Combination
Among the typical application scenarios of the product knowledge base, the recommended combination for the grounding-grid online monitoring of substations and traction substations is one grounding resistance monitor FR-01311 per point, the FG gateway and the FEXCloud platform. This combination shows that multiple stations or points can be monitored point by point according to grounding-grid state, and it is where station-difference observation lands. The product knowledge base also records that FR and FRP series grounding resistance monitors have been applied to the grounding-grid online monitoring of railway traction substations, as well as to deployment with several units per tank in oil-tank areas, showing that point-by-point grounding monitoring already has engineering deployment. This article cites only the scenario combination and the deployment records, and does not infer project effects or station risk ranking from them.
7. Boundaries That Must Be Held
The above can be gathered into a reading order. The first step is to confirm that station differences can be observed, the sources being point-by-point grounding resistance data and station-by-station lightning event records. The second step is to confirm the aggregation method and cite the FG gateway, the four-layer architecture and the communication protocol matrix. The third step is to confirm the difference mechanism and cite the topology-cascade impact framework. The fourth step, if a scenario is involved, is to return to the recommended combination for the grounding-grid online monitoring of substations and traction substations. The boundary that must be held is that the product knowledge base gives no station-level quantitative lightning risk grading model or scoring formula and sets no dedicated chapter on differentiation causes for stations in specific industries, and this article does not infer station risk scores or quantitative difference rules.
Scope and Limitations
First, this article restates only the content listed in the product knowledge base, and its factual boundary is limited to the records of the FR, FG and FL product entries, the four-layer architecture, the communication protocol matrix and the topology cascade of the Wanxiang engine, without introducing scoring models or cases not listed in the product knowledge base.
Second, the three-pole method, DC12V supply, outdoor installation and three communication options of the grounding resistance monitor (FR-01311-R, FR-01311-Z, FR-01311-E) are quoted according to the figures listed in the product knowledge base.
Third, the lightning-protection smart gateway (FG-0221-ER with RS485 downstream and Ethernet upstream; FG-0221-EZ with Zigbee downstream and Ethernet upstream) is quoted according to the figures listed in the product knowledge base.
Fourth, the lightning current / transient current monitor (for example the outdoor model FL-01212, peak 1 to 120 kA, AC220V, with energy support) is quoted according to the figures listed in the product knowledge base.
Fifth, the four-layer architecture and communication protocol matrix, the Wanxiang engine topology cascade of up to 6 layers, and the recommended combination for the grounding-grid online monitoring of substations and traction substations are all quoted according to the figures listed in the product knowledge base; this article does not infer project effects from them.
Sixth, the product knowledge base gives no station-level quantitative risk grading model or scoring formula and sets no dedicated chapter on differentiation causes for stations in specific industries, and this article accordingly states that it cites only observation and networking capability.
Seventh, this article does not constitute a commitment about product selection or risk evaluation for any specific project; actual practice is subject to the latest product materials and formal documents.