 FEXLINK Research Institute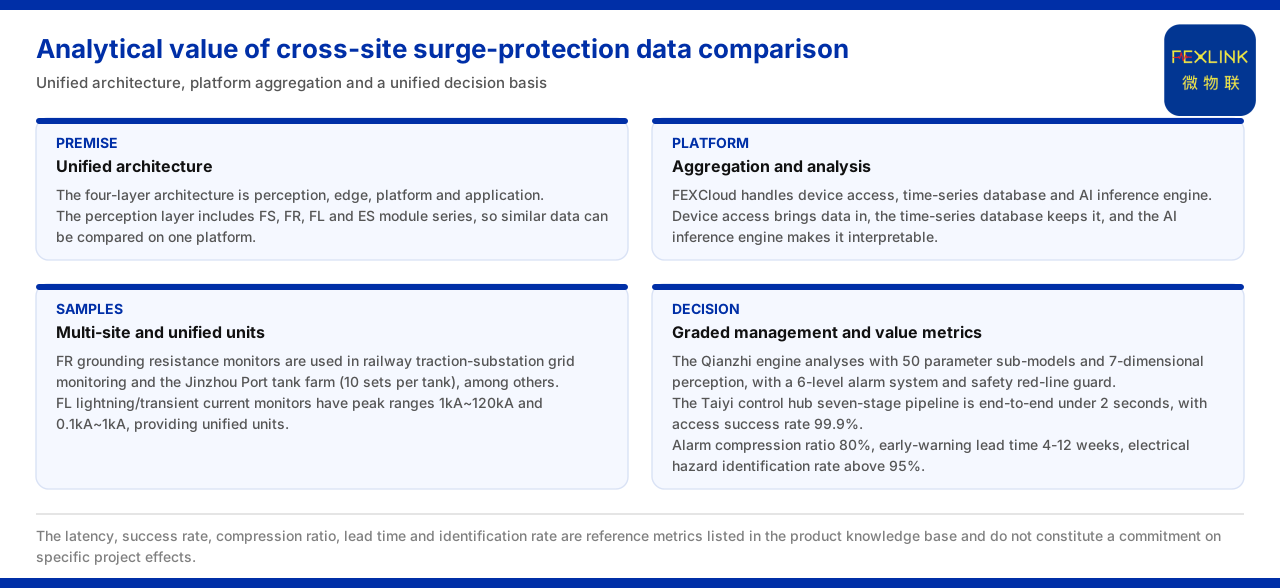
Direct Answer
The value of cross-site comparison and analysis of lightning-protection data comes from the premise that comparable data can be compared on the same platform. The product knowledge base records that the general four-layer architecture of the monitoring system is perception layer, edge layer, platform layer and application layer; the perception layer contains the FS, FR, FL and ES series monitoring modules, and comparable data from multiple sites can be compared on the same platform; the platform layer is the FEXCloud IoT cloud platform, which handles device access, the time-series database and the AI inference engine. That is, cross-site comparison is not about manually pulling each site's data together but a capability supported by the architecture itself. In addition, the product knowledge base records that the FR grounding resistance monitor has been applied to online monitoring of railway traction-substation grounding grids and to the Jinzhou Port oil-tank farm (10 sets per tank), and these multi-site data are the basis of comparative analysis.
1. The Premise of Cross-Site Comparison Is a Unified Architecture
The first step of cross-site comparison is that the data comes from the same architecture. The product knowledge base records that the general four-layer architecture is perception layer to edge layer to platform layer to application layer, and the perception layer contains the FS, FR, FL and ES series monitoring modules, so comparable data from multiple sites can be compared on the same platform. Only with a unified architecture can the acquisition convention be consistent and the comparison meaningful.
If each site builds its own system and defines its own indicators, data cannot be directly compared even when aggregated. The product knowledge base uses the four-layer architecture as a general design precisely so that comparable monitoring items at different sites fall in the same position. The perception layer acquires and the platform layer aggregates, so cross-site comparison can be carried out uniformly at the platform layer without redefining the data structure at each site.
2. The Platform Layer Handles Aggregation and Analysis
Comparative analysis occurs at the platform layer. The product knowledge base records that the platform layer is the FEXCloud IoT cloud platform, handling device access, the time-series database and the AI inference engine, and is the carrier for centralised aggregation of cross-site data. The three correspond to the process from access to storage to analysis.
The significance of the time-series database is that it organises data by time. Lightning-protection monitoring concerns condition quantities that change over time; the grounding resistance, the lightning-current peak and others need to be stored as time series in order to observe trends. Device access solves "data can come in", the time-series database solves "data can be kept", and the AI inference engine solves "data can be understood". Together, these three capabilities give cross-site comparison a platform foundation.
3. Multi-Site Projects Provide Comparison Samples
Comparison needs samples. The product knowledge base records that the FR grounding resistance monitor has been applied to online monitoring of railway traction-substation grounding grids and to the Jinzhou Port oil-tank farm (10 sets per tank) and other multi-site projects, providing a data basis for cross-site comparison. The deployment of the same class of monitor at different sites itself forms a comparable data set.
Taking the oil-tank farm as an example, the product knowledge base records 10 sets per tank, showing that a single site already has multi-point monitoring. When multiple sites all use the same class of monitor, comparisons can be made both between sites and within a site. For operation and maintenance, the value of such comparison lies in identifying "deviation": a reading at one site that differs markedly from comparable sites often signals that the site needs separate checking, rather than waiting for an alarm before intervening.
4. Unified Dimensions Make Lightning-Strike Data Comparable
Cross-site comparison also requires consistent dimensions. The product knowledge base records that the FL lightning current / transient current monitor has a peak range of 1 kA to 120 kA (indoor and outdoor versions) and 0.1 kA to 1 kA (FL-11122), providing unified dimensions for cross-site lightning-strike event data. Only when the same physical quantity is recorded in the same unit can lightning-strike data from different sites be compared directly.
When dimensions are not unified, comparison degenerates into conversion. The product knowledge base lists the peak range by model tier, showing that the dimension is a fixed convention at model level rather than something agreed each time data is acquired. For cross-site analysis this means comparison can be grouped by model: first confirm whether the objects being compared belong to the same range tier, then judge whether a numerical difference is meaningful.
From an engineering point of view, unified dimensions have another indirect benefit: when sites use the same class of monitor, the reading habits of field personnel, the data-export format and the alarm thresholds are easier to unify. Cross-site comparison is therefore not only a matter for the analysis stage; it in turn requires keeping selection as consistent as possible. The product knowledge base groups different peak ranges into the same class of monitor, providing a product basis for this consistency.
5. A Unified Judgement Convention Supports Tiered Management
Once the data is comparable, a unified judgement convention is still needed. The product knowledge base records that the Qianzhi engine (V4.1) analyses with 50 parameter sub-models and seven-dimensional perception, and sets a six-level alarm system and a safety red-line guard, providing a unified anomaly-judgement convention for multi-site data. Only when each site judges by the same convention do the conclusions obtained become comparable.
If the standards of each site differ, the same reading may be normal at one place and an alarm at another, and cross-site comparison loses its baseline. The product knowledge base places the alarm grading and the red-line judgement in the same engine precisely to unify the convention. Comparative analysis can thereby rise from "comparing numerical magnitude" to "comparing risk grade", giving management actions a unified basis.
6. From Data Access to Value Indicators
The processing capability of the platform layer has clear indicators. The product knowledge base records that the Taiyi intelligent control hub system (V2.0) uses a seven-stage pipeline from access, cleaning and standard verification to analysis, judgement, fusion decision and persistence, with an end-to-end latency of less than 2 seconds and a data-access success rate of 99.9 percent. These indicators determine whether cross-site data can enter the analysis process promptly and stably.
At the value level, the product knowledge base gives quantified indicators of the Taiyi intelligent control hub: an alarm compression ratio of 80 percent, a warning advance of 4-12 weeks and an electrical-hazard identification rate of 95 percent or more, supporting tiered management after cross-site comparison. Combining these indicators with comparative analysis, the meaning of cross-site is not only to see whose data is higher but to compress invalid alarms, identify hazards in advance and arrange operation and maintenance by site risk grade.
Applicability and Limits
First, this article states only the analytical value of cross-site comparison of lightning-protection data, and its factual boundary is the product knowledge base; it introduces no standard clause, parameter, certification or case not listed in the product knowledge base.
Second, the four-layer architecture and the perception-layer modules, the composition of the platform layer FEXCloud, the multi-site application of the FR grounding resistance monitor, the peak range of the FL lightning current monitor, the judgement convention of the Qianzhi engine, and the pipeline and quantified indicators of the Taiyi intelligent control hub are all contents listed in the product knowledge base.
Third, the latency, success rate, compression ratio, advance and identification rate referred to in this article are reference indicators listed in the product knowledge base and do not constitute a promise about the effect of a specific project; the cross-site comparison scheme follows the site data conditions and the product knowledge base conventions.