 FEXLINK Research Institute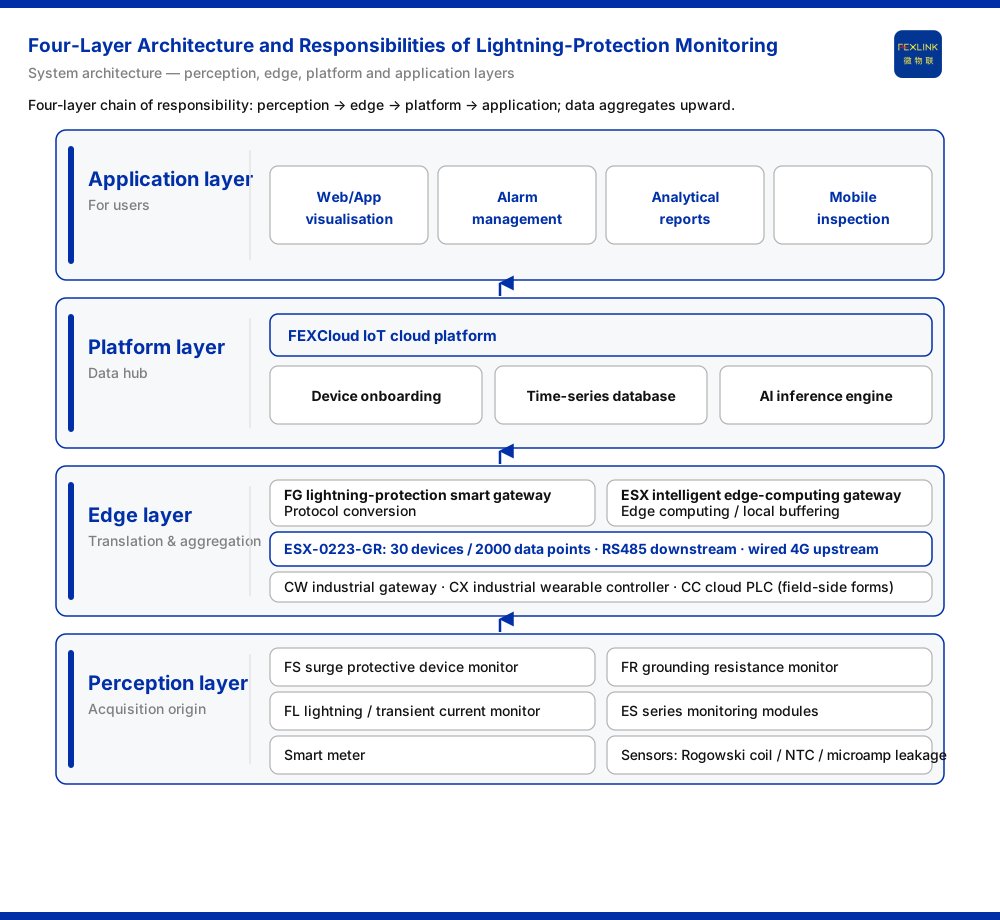
A lightning-protection monitoring system is not a pile of devices but a bottom-up data chain in which each level abstracts the one below it. Under the general monitoring architecture described in the knowledge base, that chain has four layers. From the field upward they are the perception layer, the edge layer, the platform layer, and the application layer. At a high level, the perception layer acquires field signals; the edge layer performs protocol conversion, edge computing, and local buffering; the FEXCloud IoT cloud platform provides device onboarding, the time-series database, and the AI inference engine; and the application layer delivers Web/App visualization, alarm management, analytical reports, and mobile inspection. This article explains each layer's responsibilities and product ownership so that system integrators and solution engineers can judge which products belong where.
One point should be settled up front: the four-layer architecture is a division of responsibility, not a rigid equipment taxonomy. A device may take any physical form; what places it in a layer is the job it performs. Collect, and it belongs to the perception layer. Convert, compute, and buffer, and it belongs to the edge layer. Onboard, store, and infer, and it belongs to the platform layer. Present, alarm, report, and support inspection, and it belongs to the application layer.
1. Perception layer: turning field conditions into collectable signals
The perception layer is the starting point of the data chain; its job is acquisition. The knowledge base includes surge protective device monitors, grounding resistance monitors, lightning current / transient current monitors, ES series monitoring modules, plus smart meters and sensors. The main members are:
- the FS surge protective device monitor (FS-00011), an acquisition device for surge protective device status;
- the FR grounding resistance monitor (FR-01311), an acquisition device for grounding resistance;
- the FL lightning current / transient current monitor, for lightning and transient current acquisition;
- ES series monitoring modules, a module family covering a wider range of electrical quantities;
- smart meters, together with sensors such as Rogowski coils, NTC thermistors, and microamp-level leakage-current sensors.
Think of the perception layer as the system's nerve endings: it handles only one measurement point or one class of physical quantity, converting field conditions into electrical or digital signals for the edge layer to converge. Because these devices sit in the field, their interface form, mounting method, and power conditions directly affect how hard they are to integrate. It outputs raw or preliminary status values; it does not orchestrate across systems or store data long term. When selecting products, first answer "what physical quantity must be collected," then choose the monitoring module or sensor, not the other way around.
2. Edge layer: protocol conversion, edge computing, and local buffering
The edge layer receives from the perception layer and connects upward to the platform, acting as the chain's translation and aggregation stage. The knowledge base defines the edge layer as comprising lightning-protection smart gateways, intelligent edge-computing gateways, and industrial gateways, together with industrial wearables and cloud PLCs, and it carries three responsibilities: protocol conversion, edge computing, and local buffering.
- Protocol conversion. Field monitoring modules and sensors do not share a single communication method, so a gateway must normalize downlink data into a protocol that can travel uplink. The FG lightning-protection smart gateway is a protocol-conversion family with two downlink variants: the RS485 variant (FG-0221-ER) takes RS485 downward, and the Zigbee variant (FG-0221-EZ) takes Zigbee downward; both output upward over Ethernet.
- Edge computing and local buffering. Take the ESX intelligent edge-computing gateway (ESX-0223-GR): this model supports 30 devices / 2,000 data points, with RS485 downward and wired 4G upward. Protocol conversion, edge computing, and local buffering are completed at this layer.
- Additional field gateway forms. The CW industrial gateway, CX industrial wearable controller, and CC cloud PLC also belong to the edge layer for local data acquisition and control.
Why keep these three responsibilities at the edge rather than moving them all up to the platform? Because field devices are diverse, protocols are not uniform, and the field network is not always stable. Sitting close to the devices, the edge layer performs one round of convergence and temporary storage, so the platform layer faces a relatively orderly data stream. This layer answers how field data is aggregated and sent to the network, so selection should look at access capacity, downlink interfaces, and uplink method, not just device appearance. The perception layer decides what can be collected; the edge layer decides how much can be connected and how it is sent out.
3. Platform layer: device onboarding, time-series database, and AI inference engine
The platform layer is the data hub of the four-layer architecture. The knowledge base identifies it as the FEXCloud IoT cloud platform, carrying three responsibilities:
- Device onboarding. It accepts uplink connections from the edge layer and brings field data under platform-side management.
- Time-series database. It stores continuous monitoring data in time order, providing the data foundation for trend and comparison analysis.
- AI inference engine. It runs inference on the platform side to analyze continuous data further.
The platform layer's job is aggregation and computation. It does not touch field sensors directly; it waits for the edge layer to finish protocol convergence, then onboards everything uniformly. Device onboarding answers "data can get in," the time-series database "data can be kept," and the AI inference engine "data can be used." These are progressive roles: remove one and the application layer's capabilities lose their basis. The device-to-platform communication relationship is defined by the communication protocol matrix in the knowledge base. Downward, devices use Modbus RTU (RS485), Zigbee (Modbus), and LoRa. Upward, devices use Modbus TCP / MQTT (Ethernet, 4G), and IEC 61850 may optionally be selected at the gateway level. IEC 61850 therefore sits at the optional gateway-level uplink position, not among the perception layer's field protocols.
4. Application layer: visualization, alarms, reports, and mobile inspection
The application layer faces users directly. The knowledge base gives it four capabilities: Web/App visualization, alarm management, analytical reports, and mobile inspection. In practice they map as follows:
- Web/App visualization presents platform-side data as readable interfaces.
- Alarm management forms alarms from monitoring data and organizes their handling.
- Analytical reports consolidate periodic statistical analysis results.
- Mobile inspection supports field personnel in mobile inspection work.
The application layer converts the data accumulated by the lower layers into everyday actions that can be seen, managed, queried, and inspected. For the client's electrical/safety and lightning-protection operations leads, it is often the only interface they touch directly.
5. Four-layer responsibilities and product mapping at a glance
One table makes the responsibility-to-product relationship easier to see:
| Layer | Core responsibilities | Main products |
|:--|:--|:--|
| Application | Web/App visualization, alarm management, analytical reports, mobile inspection | Application-side Web/App |
| Platform | Device onboarding, time-series database, AI inference engine | FEXCloud IoT cloud platform |
| Edge | Protocol conversion, edge computing, local buffering | FG lightning-protection smart gateway, ESX intelligent edge-computing gateway, CW industrial gateway, CX industrial wearable controller, CC cloud PLC |
| Perception | Collecting lightning, grounding, surge, and power-use status | FS surge protective device monitor, FR grounding resistance monitor, FL lightning current / transient current monitor, ES series monitoring modules, smart meters, sensors |
To judge a responsibility's layer, ask four questions in order: which physical quantities must be collected in the field (perception layer); how those quantities are accessed and sent upward (edge layer); where the data is stored and computed (platform layer); and who ultimately views it and how it is handled (application layer). The four questions correspond to the four layers and to four product classes, which prevents a solution from conflating acquisition, gateway, and platform capabilities.
Note that the four layers are a judgment tool, not a strict one-to-one equipment mapping. The most common confusion is pushing platform-layer statistics and inference down to the gateway, or leaving edge-layer protocol differences to the platform. Layer-by-layer checking surfaces such mismatches early.
Scope and limitations
This article describes only the four-layer architecture's division of responsibility and product ownership, not equipment counts, point counts, communication selection, or deployment conclusions for any specific project. The access capability cited for the ESX intelligent edge-computing gateway model ESX-0223-GR (30 devices / 2,000 data points) is an existing parameter in the knowledge base and does not represent other models or actual engineering configurations. The knowledge base provides no certification, accuracy, case, or performance data within this topic's scope; this article does not extend beyond it. IEC 61850 is listed as an optional gateway-level uplink protocol; whether it is adopted in practice is subject to the project solution.