 FEXLINK Research Institute
Direct Answer
How is the enterprise carbon emission calculated? The Scope 1 is the direct combustion and the process emission, the Scope 2 is the indirect emission of the purchased electricity and heat, and the Scope 3 is the value-chain upstream/downstream emission — an industrial enterprise should first make the Scope 1+2 solid and choose the Scope 3 by the industry priority, not pursue the full amount at once — a vague boundary causes the double counting or the omission, making the carbon data incredible and failing the verification — with the boundary clear, the carbon inventory can withstand the check.
A scenario: An enterprise does the first carbon inventory — should the gas boiler count? Should the purchased electricity count? Should the supplier transport count? — the boundary is unclear and the number is uncertain — at the verification, "did this count and why not that" makes it passive. The logic is that the first step of the inventory is "drawing the boundary" — which emissions count in and which not — a clear boundary makes the data credible — the Scope 1/2/3 is the internationally common boundary framework.
1. The Scope 1/2/3 Boundary and the Source List
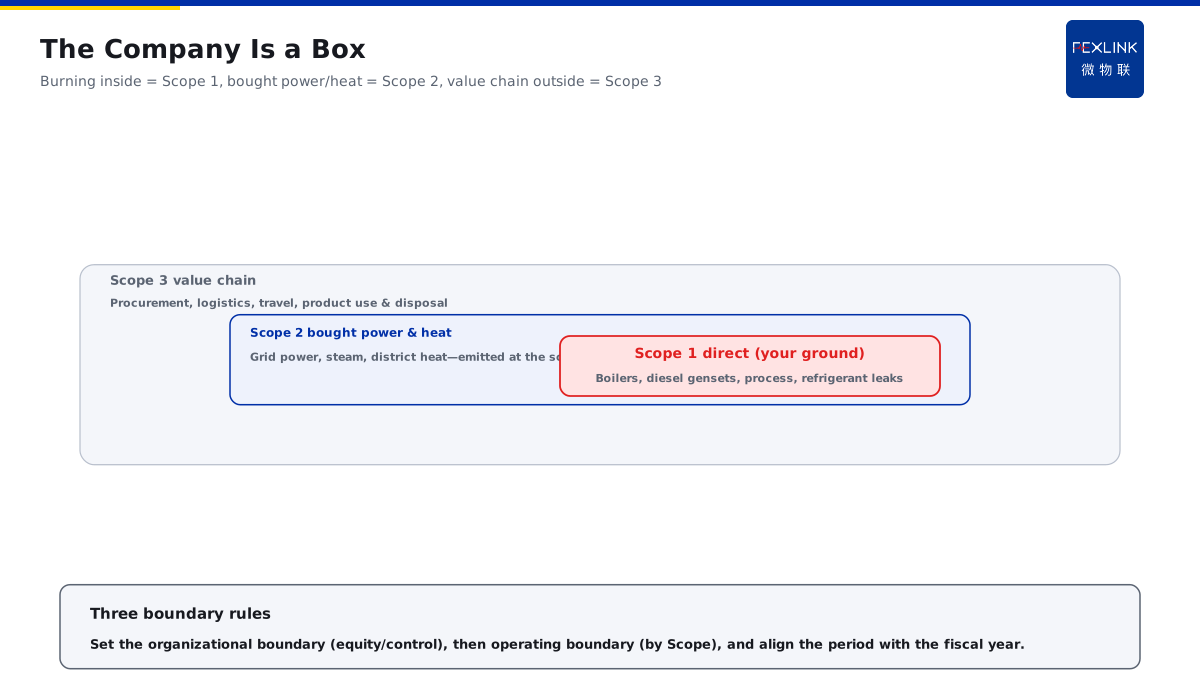
The meaning of the Scope 1 — the direct emission: the sources owned or controlled by the enterprise — combustion, process and fugitive; The meaning of the Scope 2 — the indirect emission (electricity): the emission of the purchased electricity/heat/steam/cooling; The meaning of the Scope 3 — the value-chain emission: the upstream/downstream — procurement, transport, product use and disposal; The boundary picture — the enterprise is like a "box": the combustion inside is the Scope 1, the purchased electricity is the Scope 2 and the value chain outside is the Scope 3.
In one sentence: the Scope 1 is "burned by yourself", the Scope 2 is "the bought electricity and heat" and the Scope 3 is "the upstream and the downstream" — the three boundaries cover the whole picture of the enterprise carbon.
The emission source list table:
| Scope | Typical sources | Examples |
|---|---|---|
| Scope 1 | Fixed/mobile combustion, process, fugitive | Gas boiler, forklift, refrigerant leak |
| Scope 2 | Purchased electricity/heat/steam/cooling | Grid power, district heat |
| Scope 3 | Procurement, transport, travel, product | Materials, logistics, commuting |
The three principles of the boundary — the organization boundary first: by the equity/control; the operation boundary: classify the sources into the scopes; the time boundary: consistent with the financial year — the three settled, the range is clear. An example: A factory inventories: the gas boiler (Scope 1), the purchased power (Scope 2) and the material transport (Scope 3) — the three counted and listed separately — each is checkable at the verification. The logic is that the source list is "the data map" — list all the sources first and then classify — a complete list, no omission and no duplication in the calculation.
2. The Typical Scenarios of the Direct and the Indirect Emission
The direct scenarios — the boiler gas, the diesel generator, the process carbon and the refrigerant leak: the emission happens on its own ground; The indirect scenarios — the purchased grid power, the district heat and the steam: the emission happens at the production end; The judgment — the source within the control is direct and that on the chain is indirect; The responsibility — the direct is controlled by itself and the indirect is influenced by the procurement choice.
In one sentence: the direct vs the indirect depends on "where the emission happens" — burned on its own ground is direct and the bought electricity and heat is indirect — a right judgment makes a right classification.
The scenario comparison table:
| Scenario | Scope | Judgment |
|---|---|---|
| Gas boiler | Scope 1 | Own combustion |
| Diesel generation | Scope 1 | Own combustion |
| Purchased power | Scope 2 | Grid end |
| District heat | Scope 2 | Heat end |
| Refrigerant leak | Scope 1 | Fugitive |
The common questions — the diesel forklift in the plant: the Scope 1 mobile combustion; the purchased steam: the Scope 2; the employees driving their own cars: the Scope 3 commuting — the three questions are answered in the table. An example: An enterprise counted the purchased power into the Scope 1 — the verification points out the classification error — after the redivision, the data base is right. The logic is that a classification error is a "base error" not a "quantity error" — the direct/indirect confusion makes the report structure wrong — the scenario table helps classify each source correctly.
3. The Location-Based and the Market-Based Method of the Electricity
The location-based — by the average grid emission factor: reflecting the overall grid level; The market-based — by the purchased power attributes (the green power and the direct purchase): reflecting the procurement decision; The results of the two — the location sees "what the grid gives you" and the market sees "what kind of power you buy"; The disclosure — ISO 14064 usually requires both and separate reports: the different results are normal.
In one sentence: the location is by the grid average and the market is by the purchase attribute — a green-power buyer gets very different results — calculate both and disclose separately, and the base is complete.
The retention of the green certificates — the green certificate/power purchase agreement: the basis of the market-based calculation — retained, the market result is traceable. An example: An enterprise buys the green power — the location gives 1000 tCO₂ and the market gives near zero — the huge difference — the report discloses both and explains the bases — the verification accepts. The logic is that the "two algorithms" of the electricity are a key point — only one with an unclear base is incomparable — both calculated, the value of the green purchase is shown.
4. Why the Scope 3 Is Hard and Which to Do First
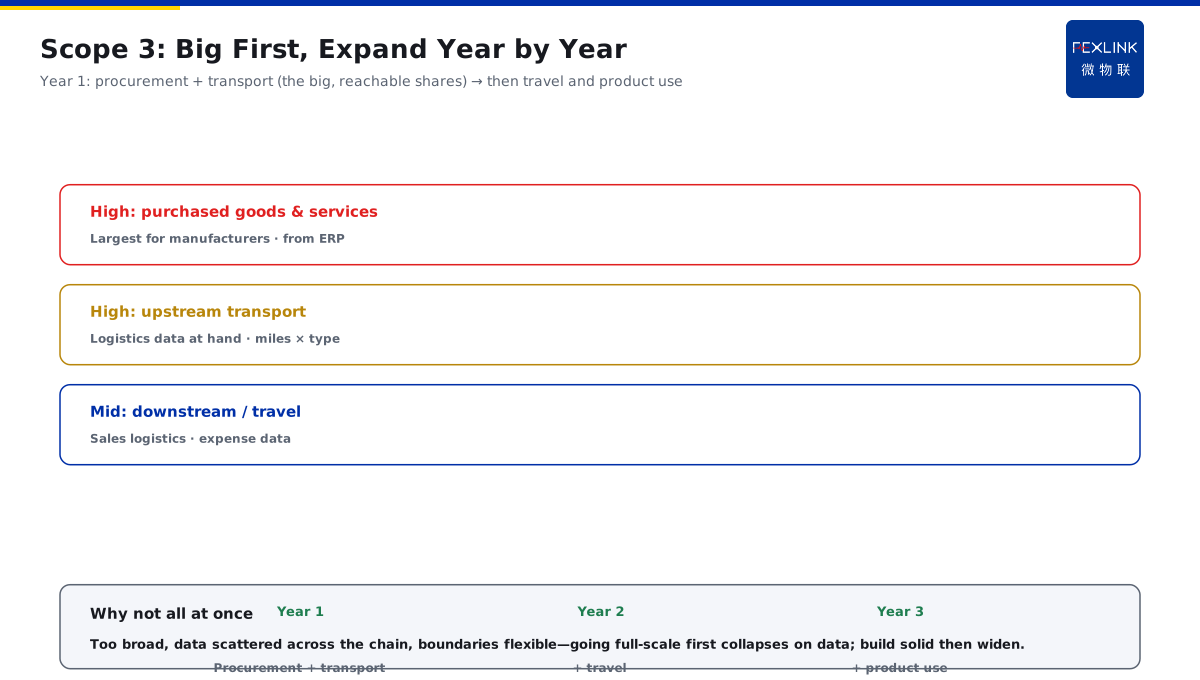
The difficulty of the Scope 3 — a wide range, the data scattered on the chain and an elastic boundary: the full amount is unrealistic; Which to do first — the purchased goods and services, the upstream transport, the downstream transport and the business travel — the high priority first; The selection principle — by the emission share and the data availability: the large share and the easy data first; The pace — the core categories in the first year and the expansion yearly: solid first and then wider.
In one sentence: the Scope 3 is too wide and scattered — select the first categories by "the share + the availability" — expand yearly instead of one step.
The Scope 3 priority table:
| Category | Priority | Note |
|---|---|---|
| Purchased goods | High | The large share |
| Upstream transport | High | Data available |
| Downstream transport | Medium | Sales logistics |
| Business travel | Medium | Easy data |
The data sources of the Scope 3 — the procurement: the ERP ledger matched with the factors; the transport: the logistics bills estimated by the mileage; the travel: the reimbursement data — the data is in the existing systems, take the easy first. An example: A manufacturer only counts the procurement and the transport in the first year — the two take the large share — the data from the ERP and the logistics — the travel and the product use are added from the second year. The logic is that the Scope 3 pace is "the main first and the expansion yearly" — the full amount at once cannot support the data and the result is incredible — by the priority, the Scope 3 is doable.
5. The Three Most Common Pitfalls of the Boundary
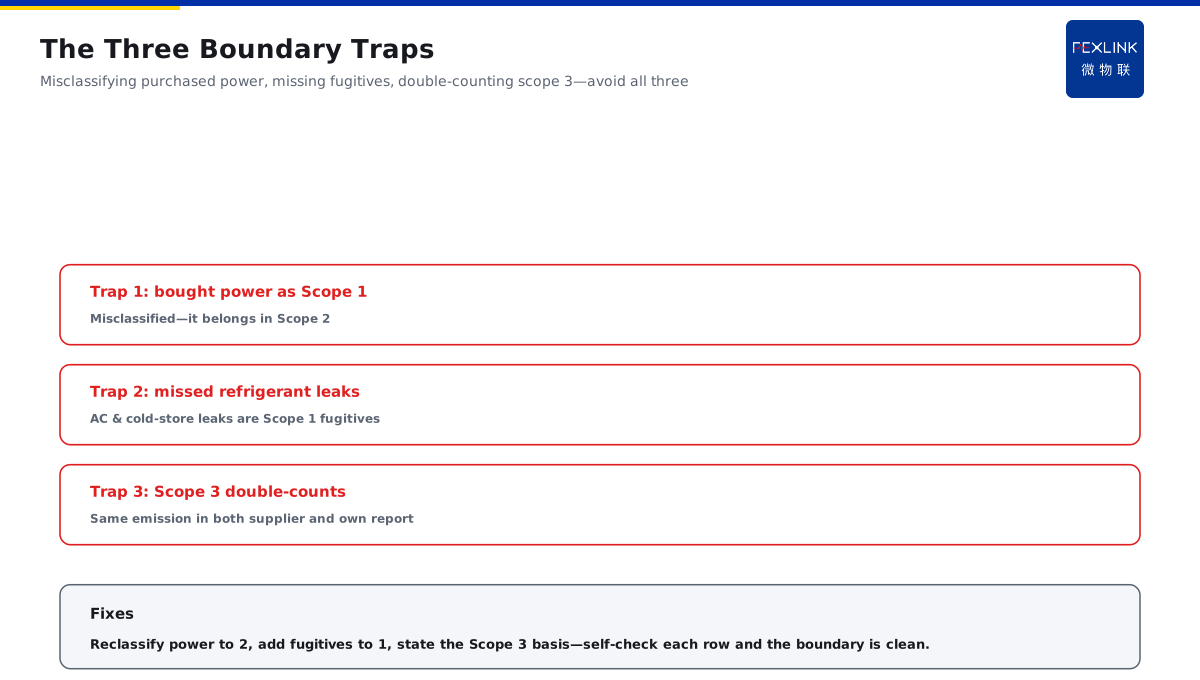
The pit 1: the purchased power counted as the Scope 1 — a classification error: it is the Scope 2; The pit 2: the refrigerant fugitive omitted — an omission: the leak of the air-conditioning/cold storage is the Scope 1 fugitive; The pit 3: the Scope 3 duplicated with the Scope 1/2 — a double count: the same emission in both the supplier and the enterprise reports.
In one sentence: the three pits — the power misclassified, the fugitive omitted and the chain duplicated — avoided, the boundary is clean.
The pit comparison table:
| Pit | Performance | Fix |
|---|---|---|
| Power in Scope 1 | Misclassification | Into Scope 2 |
| Fugitive omitted | Omission | Add to Scope 1 |
| Scope 3 duplicate | Double count | Clarify the base |
The boundary self-check list — is the organization boundary clear (the equity/control)? Is the operation boundary complete (the three scopes)? Are the sources complete (with the fugitive)? Is the classification right (the power into the Scope 2)? — the four checks, no dead corner. An example: An enterprise finds in the self-check that the power is misclassified and the refrigerant is omitted — after the correction, the base is right and the verification passes. The logic is that the boundary error "is findable and fixable" — self-check item by item — a clean boundary makes the carbon data withstand the verification.
Back to the energy-carbon autonomy system and the smart platform — the data foundation of the Scope 1/2/3: the ESA full-element meter and the ZSA embedded multi-function meter support the automatic collection of the Scope 2 electricity, and the platform accounts by the Scope 1/2/3 with both the location-based and the market-based outputs — a clear boundary and a complete base — the enterprise inventory starts with the boundary.**
Scope and Limitations
- The conclusions in this article are intended for LV distribution and electrical-safety sites. Standard numbers (GB/T 32150) refer to their currently effective editions, and product parameters follow the latest FEXLINK selection handbook and product knowledge base.
- Quantitative criteria (protection zone, discharge and residual voltage, earth resistance, thresholds and grading) hold under the preconditions stated in this article. Where the site voltage level, earthing arrangement, environmental category or load profile differs, the figures must be recalculated. Specific configurations involving ESA all-element smart meter, ZSA embedded multi-function smart meter should be verified against actual circuit parameters.
- Specific product models and parameters are subject to the latest selection handbook and product knowledge base; this article does not constitute selection or procurement advice.
- Standard numbers cited here refer to the currently effective editions; when a standard is revised, the related quantitative conclusions must be re-checked.
- Deployment and implementation for specific projects must be carried out by qualified engineers based on site survey and design drawings.
Frequently Asked Questions
How to Define Your Corporate Carbon Footprint
The Scope 1 is the direct combustion and the process emission, the Scope 2 is the indirect emission of the purchased electricity and heat