 FEXLINK Research Institute
The short answer
Carbon intensity is how much carbon you emit per unit of output — a ratio. Total carbon emissions is how much you emit altogether — a count.
That distinction decides which number a target should use: intensity answers "how efficient", the total answers "how big, and where is the ceiling". Carbon intensity = CO₂ emissions ÷ output value (or physical output), written as tCO₂ per CNY 10,000, tCO₂ per tonne of product, kgCO₂ per piece. Name numerator, denominator and unit; a bare number reports nothing.
It is the core metric of the dual control of total emissions and intensity. A growing company is judged on intensity; a mature one can be judged on the total.
1. Two numbers: one is a ratio, one is a count
Total emissions are in tCO₂ — absolute. Coal burned, electricity drawn, carbon released: add it up. It answers "how much altogether".
Carbon intensity is in tCO₂ per CNY 10,000, tCO₂ per tonne, kgCO₂ per piece — relative. The denominator is output, the numerator emissions. It answers "how much per unit".
The unit is itself a statement of scope. "Intensity 0.48" could be 0.48 tCO₂ per CNY 10,000 or 0.48 tCO₂ per tonne, orders of magnitude apart; "0.480 tCO₂ per tonne of product" carries all three.
The classic error is one table holding both: 48,000 tCO₂ last year, 0.461 tCO₂ per tonne this year, "down 99%". Nothing was miscalculated; apples were compared with pears.
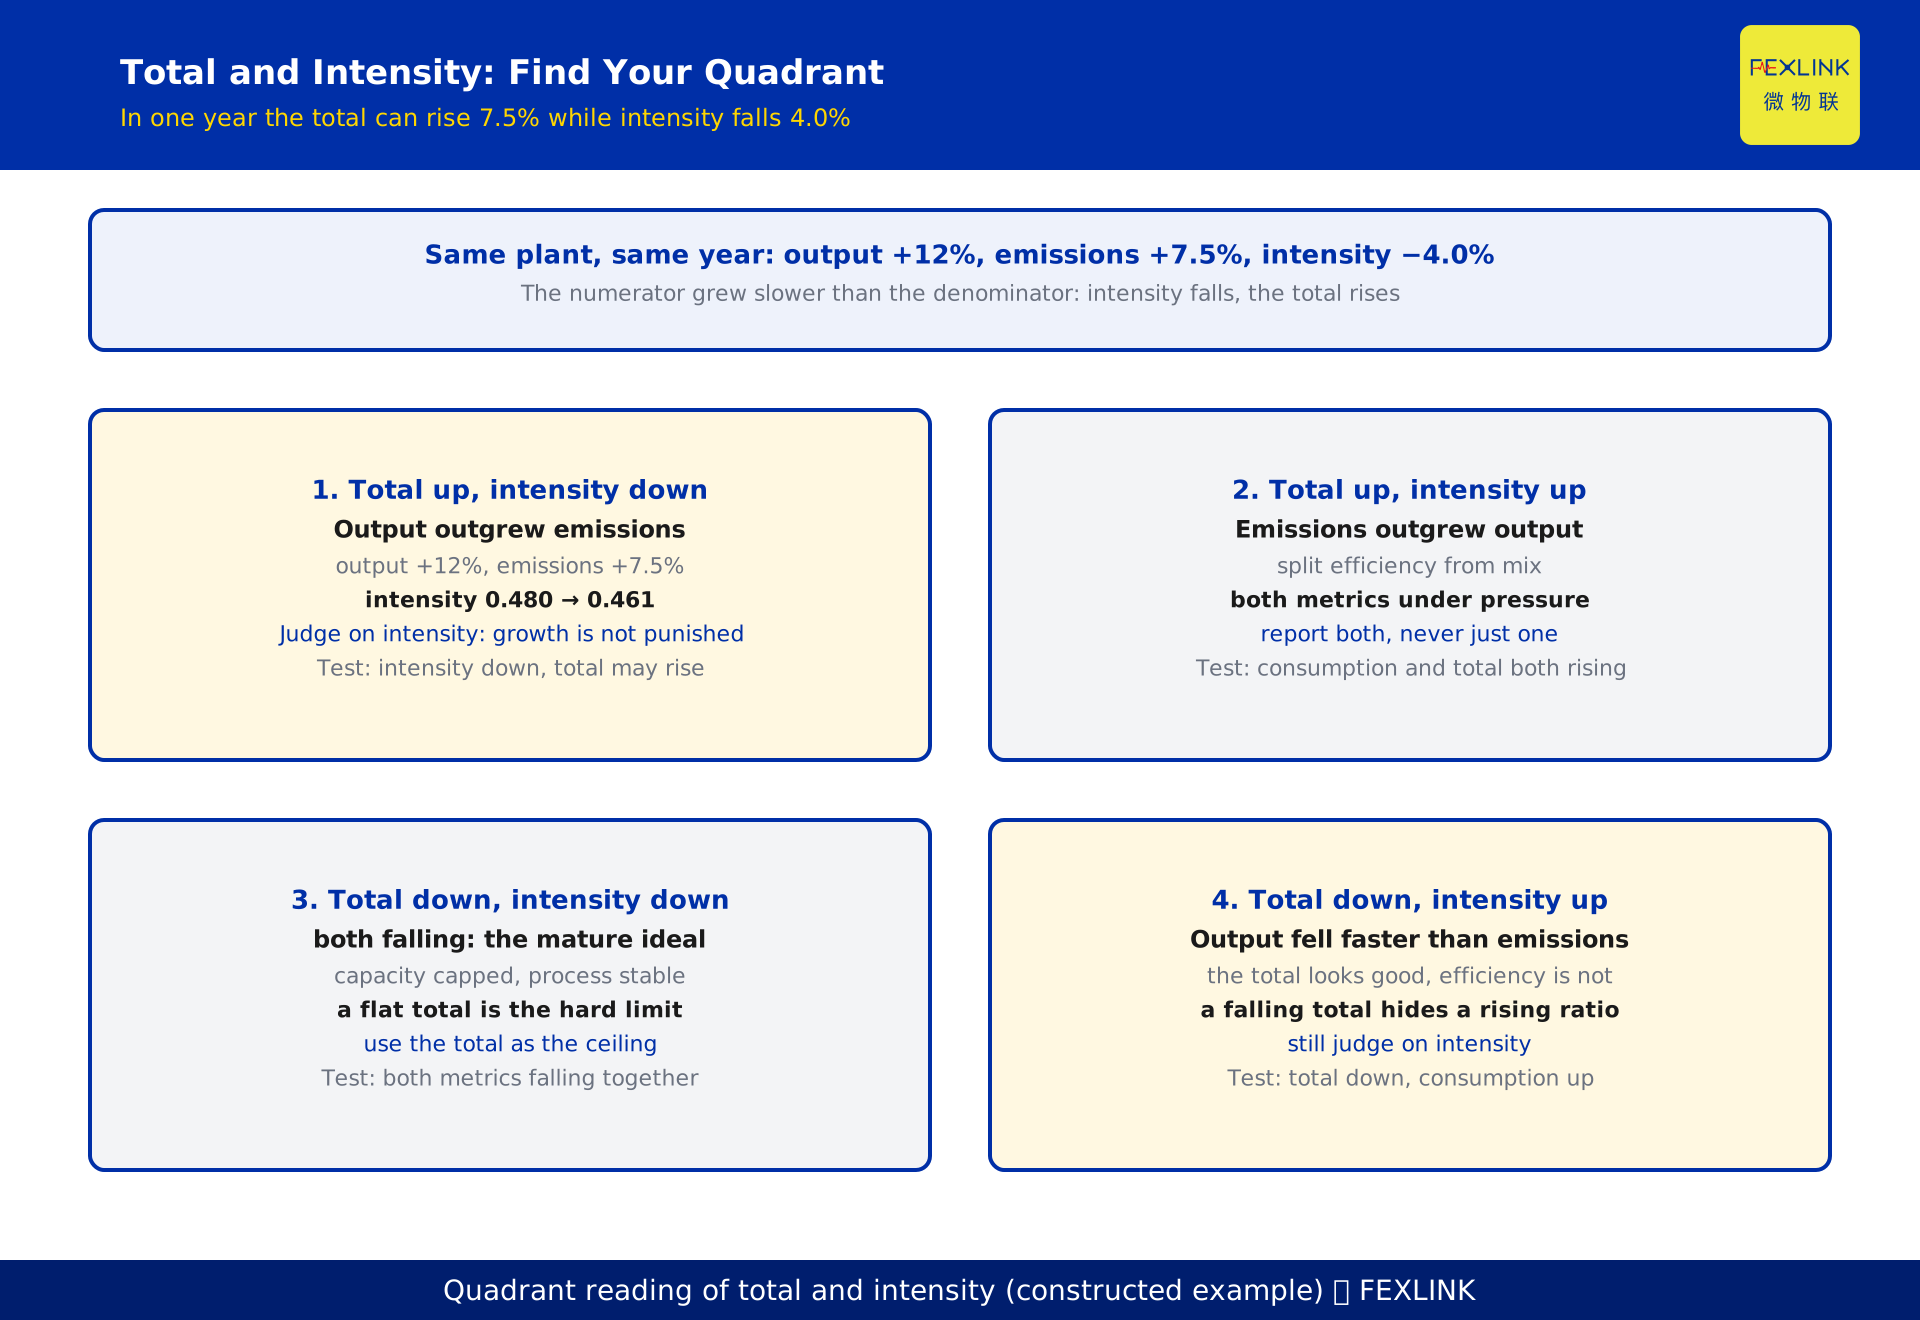
2. Intensity versus total: which quadrant are you in?
| Quadrant | Total | Intensity | Meaning | Judge on |
|---|---|---|---|---|
| ① | up | down | output grew faster than emissions | intensity |
| ② | up | up | efficiency and mix both stalled | both |
| ③ | down | down | both falling, the mature ideal | total |
| ④ | down | up | output fell faster than emissions | intensity |
Quadrant ① is normal for a growing business and the most misread. Output up 12%, emissions up 7.5%: the total rises while intensity falls — the denominator simply ran faster than the numerator. Judge only on the total and every expansion is penalised, so the rational choice is not to expand.
Quadrant ③ is where the total earns its keep: once capacity is capped, "the total stops growing" is a hard constraint.
Intensity manages efficiency; the total manages the ceiling. Policy calls it dual control; a company needs both ledgers.
3. Choosing the denominator: three bases, three ways to fool yourself
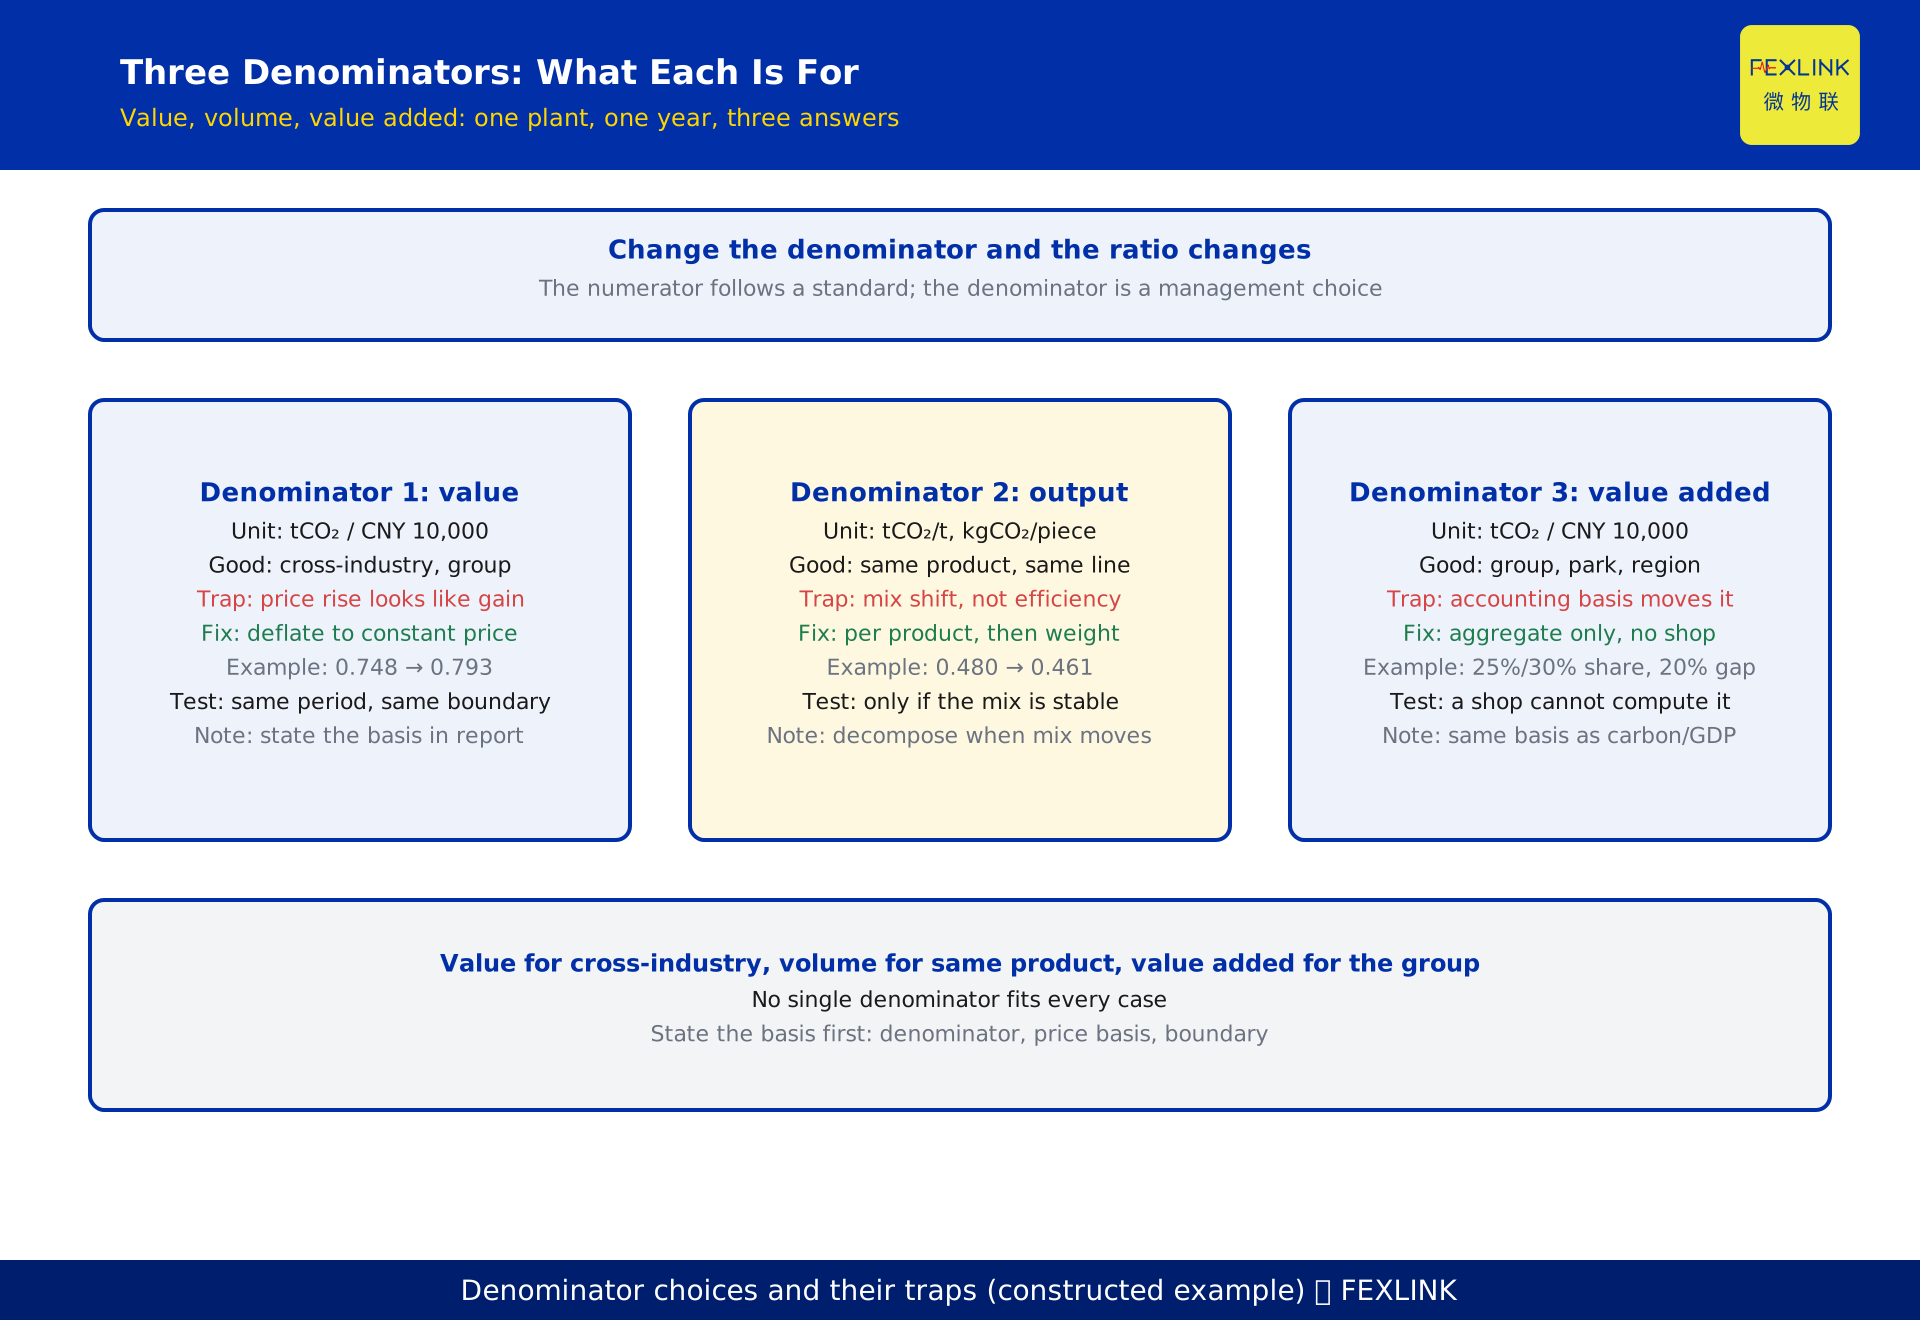
The numerator has a prescribed method. The denominator is a management choice, and each choice is comparable only in a narrower sense than it appears.
3.1 Output value: comparable across industries, but only at constant prices
Unit: tCO₂ per CNY 10,000 of output value or revenue.
Good for: cross-industry and cross-region comparison; group consolidation; alignment with carbon per unit of GDP.
How it fools you: output value is money, and money moves with price. Let prices rise 6% with no extra tonne produced and intensity "improves" 5.7% — a price illusion, not an efficiency gain. So deflate to constant prices first, then divide — that separates a metric from a mood.
3.2 Physical output: comparable within a product, until the mix shifts
Unit: tCO₂ per tonne of product, kgCO₂ per piece, tCO₂ per 10,000 m³.
Good for: benchmarking a line or unit making the same product by the same process; year-on-year tracking; linking to specific energy consumption (section 6). The most physical of the three, and immune to price.
How it fools you: a product mix sits between the numerator and the denominator. A plant makes a heavy product and a light one; the light one's share rises from 20% to 35%; output flat, emissions down, intensity better — while no line has become more efficient. The mix effect wearing the costume of the efficiency effect.
Two fixes: intensity per product, weighted; or decompose the change into efficiency and mix (section 8).
3.3 Value added: for the group, never for the shop floor
Unit: tCO₂ per CNY 10,000 of value added.
Good for: group, park and regional aggregation; the basis used for carbon per unit of GDP. It strips out intermediate inputs and tracks the carbon cost of newly created value.
How it fools you: value added is an accounting construct. Depreciation policy, outsourcing ratios and transfer pricing all move it. And a shop floor cannot compute it at all — no independent accounts, so any allocation produces a number nobody owns.
The boundary is clean: aggregation only. Report it upward; manage the plant on physical-output intensity.
3.4 The rule that cannot be broken: same period, same boundary
Same period: if the numerator covers the reporting period, so must the denominator — mixing periods is common, because the data sets come from different departments. Same boundary: whatever plants the numerator covers, the denominator covers too.
4. Why constant prices: the year prices rise, intensity "improves" for free
Current-price value follows price; constant-price value follows physical volume. Divide by the current-price figure and a price increase is booked as an emission cut.
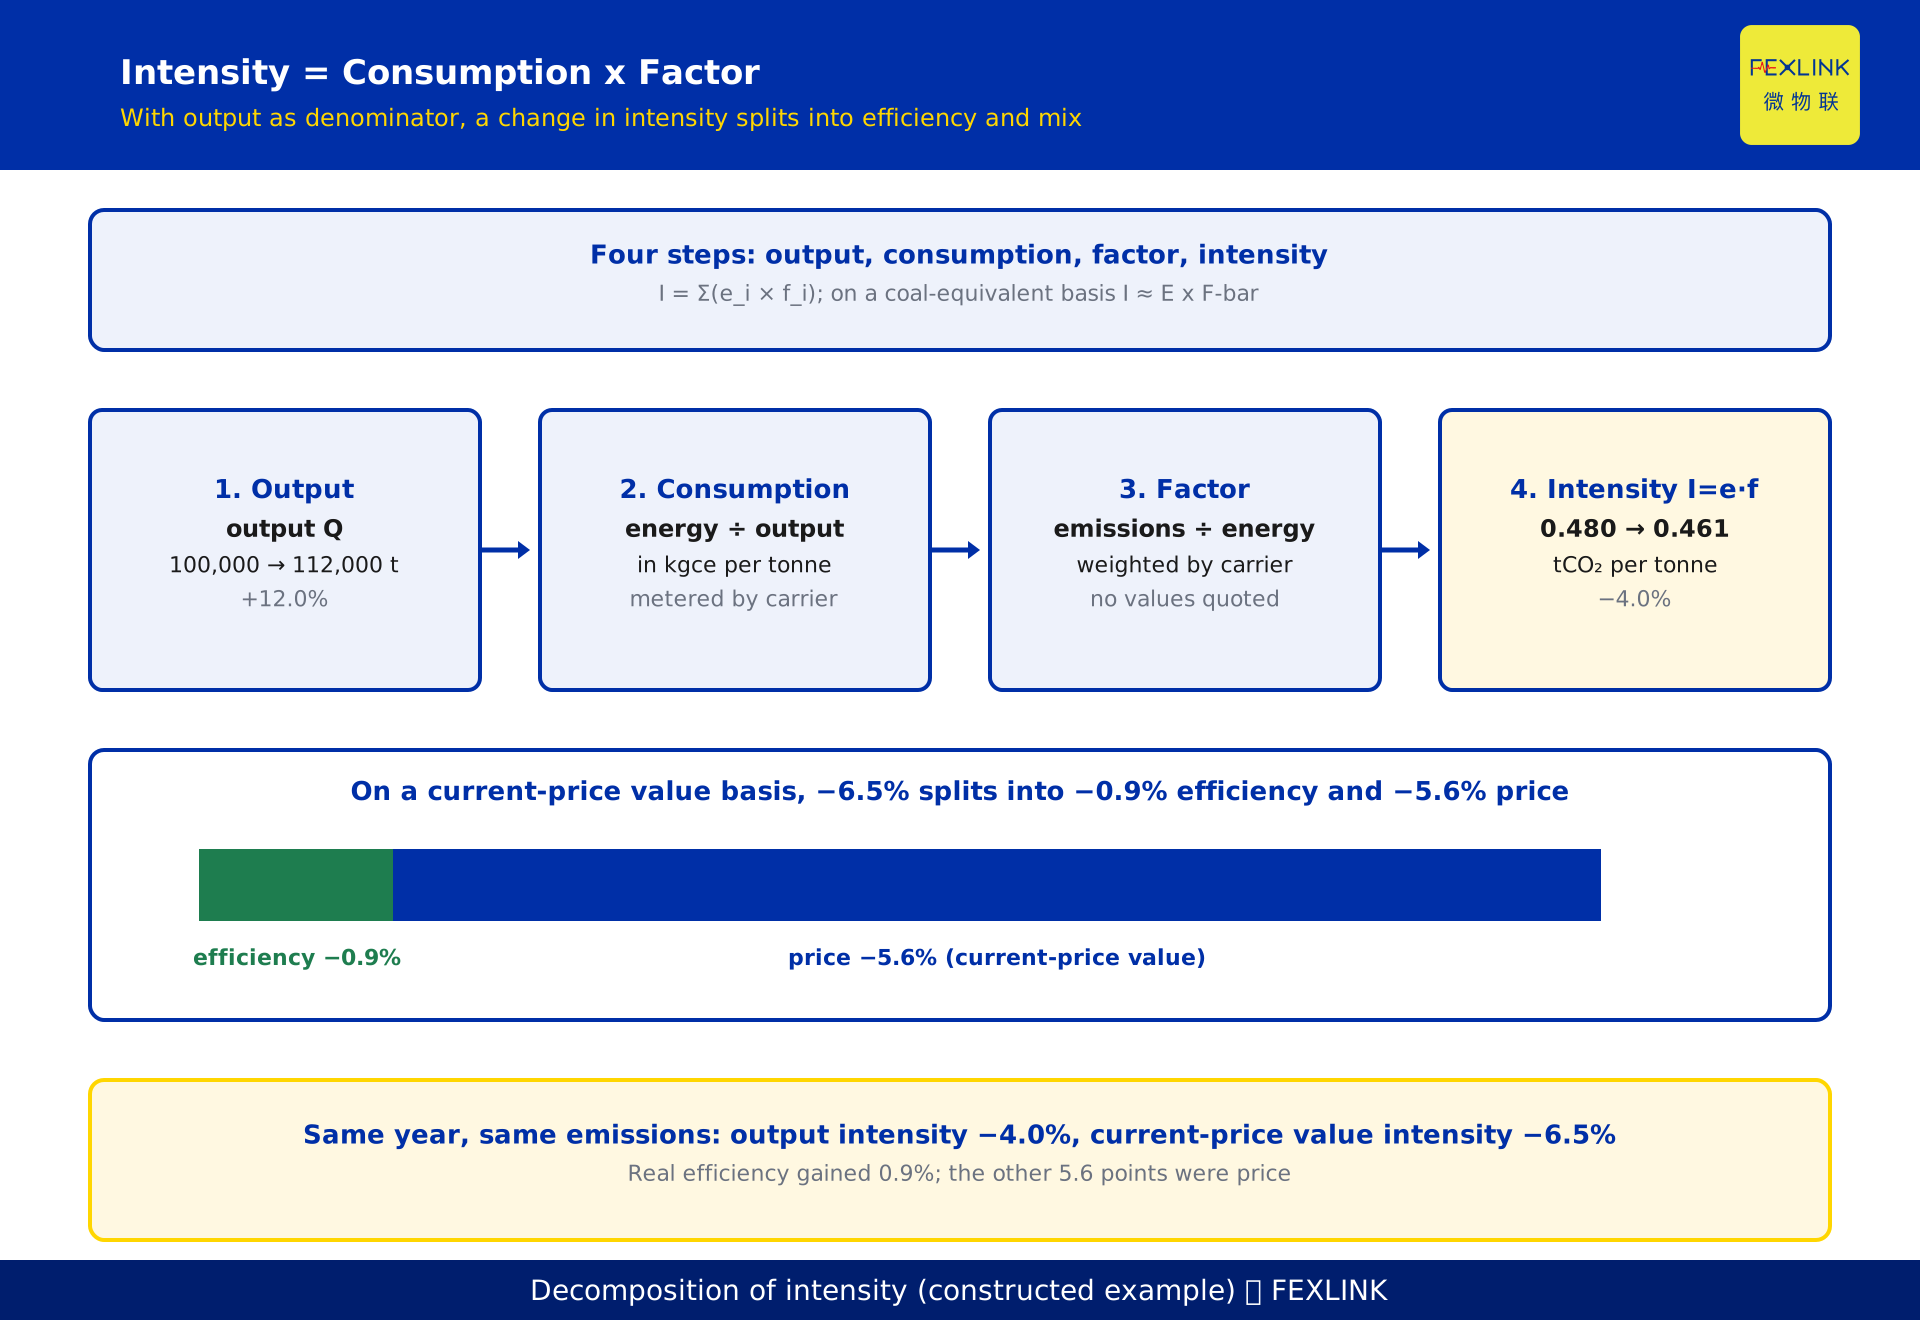
Constructed example: base year 48,000 tCO₂ against 60,000 CNY 10,000 of current-price value gives 48,000 ÷ 60,000 = 0.800 tCO₂ per CNY 10,000. Next year 51,600 tCO₂ against 69,000 gives 51,600 ÷ 69,000 = 0.748 — apparently 6.5% better.
But ex-works prices rose 6%. Deflate: 69,000 ÷ 1.06 = 65,094, and intensity is 51,600 ÷ 65,094 = 0.793 — a real gain of 0.9%.
Of the 6.5%, 5.6 points are price and 0.9 points efficiency. Report 6.5% and the first price correction hands the gain back.
Method: deflate with the producer price index for industrial products and never move the base year. Without an index, switch to physical output.
5. Why the dual-control system targets intensity
This section states direction only. Guobanfa [2024] No. 39, the Work Plan for Accelerating the Construction of a Dual-Control System for Carbon Emissions (General Office of the State Council, 2024) sets it: move the dual control of energy consumption gradually toward a dual control of carbon emissions, establishing dual control of both total emissions and intensity. Specific targets and allocation methods follow the policy in force; no clauses or reduction figures are cited.
First, intensity does not punish growth. A growing company that expands will emit more; a total-based target penalises the expansion itself, an intensity target rewards "more output, better efficiency".
Second, intensity is comparable. Output differs by orders of magnitude between firms; totals cannot be benchmarked across them, ratios can.
Third, the total is a ceiling, not a starting line. Total control belongs with mature sectors, key emitting entities and high-emission parks.
For a company this lands on two ledgers: an emissions ledger (activity data times factors, per GB/T 32150 in force) and a denominator ledger (output value, physical output, value added, same period and boundary). If they disagree, the intensity is wrong.
6. Carbon intensity and specific energy consumption
When the denominator is physical output, the two are connected by an identity.
Let e_i be the specific consumption of carrier i and f_i its emission factor. Then I = Σ (e_i × f_i), in tCO₂ per tonne.
That is the full form of "intensity = consumption × factor": not one consumption times one factor, but a sum over carriers.
Convert to coal equivalent, write composite consumption as E (kgce per tonne); then I ≈ E × F̄, F̄ being the average factor on a coal-equivalent basis (kgCO₂ per kgce), weighted by each carrier's coal-equivalent share.
The identity splits a change in intensity into two parts: a fall in E is the efficiency effect, a change in F̄ the mix effect. Section 8 follows this logic.
Two cautions. F̄ is not constant: change the mix and the mean changes, so back-calculating savings from a fixed F̄ will be wrong. Electricity carries two coefficients that must not be mixed: the coal-equivalent conversion uses 0.1229 kgce/kWh (a hard value in GB/T 2589-2020, derived as 3.6 MJ ÷ 29.3076 MJ/kgce), while carbon accounting uses a grid emission factor. Neither substitutes for the other.
No factor values are quoted; use the published or applicable ones and record source and year.
7. Four levers for bringing intensity down
One, cut specific consumption. The only lever that works without touching the product mix. Test: same product, process and load band, consumption down year on year. Meter by carrier — electricity, gas, steam, water on separate circuits, as with the ESA all-factor smart meter family — not from a master meter.
Two, change the energy mix. Coal to gas, coal to electricity, more renewables: all lower F̄. Test: does intensity fall with consumption held constant? If consumption rises at the same time, compute the net effect.
Three, shift the product mix. Flag this one: it can "improve" intensity without cutting carbon. Raise the share of high-value products and value-based intensity improves while total emissions may not move. Meeting an intensity target this way is legitimate; claiming reductions is misleading.
Four, fix the denominator. Otherwise the first three are talk: constant prices, same period and boundary, decomposition whenever the mix changes.
8. A worked example: three years at one plant
Figures illustrate the arithmetic; they do not represent any real customer.
| Item | Base year | Year 2 | Year 3 |
|---|---|---|---|
| Emissions (tCO₂) | 48,000 | 51,600 | 54,700 |
| Output (t of product) | 100,000 | 112,000 | 121,000 |
| Output value, current price | 60,000 | 69,000 | 76,500 |
| Output value, constant price | 60,000 | 65,094 | 70,183 |
| Output intensity (tCO₂/t) | 0.480 | 0.461 | 0.452 |
| Value intensity, current price | 0.800 | 0.748 | 0.715 |
| Value intensity, constant price | 0.800 | 0.793 | 0.779 |
One company, one year, three denominators, three answers. Base year to year 2: current-price value intensity falls 6.5%, constant-price 0.9%, output intensity 4.0%.
Output intensity falling 4.0% against 0.9% means real value per unit of product fell about 3.1% — output rose 12% while constant-price value rose 8.5%, so the mix drifted toward lower-value products. That is the mix effect; the 5.6-point gap between current and constant prices is the price effect. Real efficiency improved 0.9%; reporting 6.5% books a price rise as an emission cut.
Year 3 repeats it: output up 8.0%, emissions up 6.0%, output intensity down 2.0%; current-price intensity down 4.4%, constant-price 1.8%.
Three conclusions. Report value intensity at constant prices, naming index and base year. Manage on output intensity and composite consumption. Keep the total as a separate ceiling metric.
FAQ
Q: Intensity or the total — which do we report?
Ask the assessor first: policy reviews, customer questionnaires and group templates differ. With no stated requirement, report both and name the basis.
Q: Current or constant prices?
Constant prices for any year-on-year or target comparison; current prices for internal observation. Without an index, use physical output, or say "not deflated" rather than implying otherwise.
Q: What if the mix changes under a physical-output denominator?
Compute intensity per product and weight the results, or decompose into efficiency and mix. The first is more accurate; the second explains why it moved.
Q: If intensity falls, have emissions fallen?
Not necessarily. If output grows faster than emissions, intensity falls while the total rises. Check the total and composite consumption.
Q: Is carbon intensity the same as energy intensity?
Same possible denominator, different numerator: CO₂ versus coal equivalent. With a stable mix they move together. After coal-to-electricity conversion, energy intensity on the coal-equivalent basis usually falls while carbon intensity depends on the grid factor; on the equivalent-value basis (last year's national coal consumption for thermal power supply, around 0.30–0.31 kgce/kWh, subject to the published value) energy intensity can even rise.
Scope and limitations
- This article covers how intensity is calculated, what each denominator is good for and how it misleads, and what the two metrics mean as targets. Policy shift: KD-0416. Three-stage build-out: KD-0442.
- Policy wording follows the documents in force. The only policy reference is the directional language of Guobanfa [2024] No. 39; no clauses, and no provincial, sectoral or company-level reduction targets.
- The framework follows GB/T 32150, General Rules for the Accounting and Reporting of Greenhouse Gas Emissions of Industrial Enterprises, current edition 2025 (issued 2025-12-31, effective 2026-07-01, replacing the 2015 edition); clause text per the edition in force, no clause numbers cited. Organisation-level accounting may refer to ISO 14064-1:2018.
- No emission factor values, sectoral intensity benchmarks or best-in-class values are given. The identity in section 6 is symbolic only.
- Emissions, output, output value, the price indices (6% and 9%) and every intensity figure are constructed to illustrate the arithmetic. They do not represent any real customer, industry average or assessment benchmark.
- The denominator must match the reporting period: same period, same boundary, same price basis. Mixed periods or inconsistent consolidation scope distort the ratio.
- Product side: the ESA all-factor smart meter meters by carrier and circuit; the electricity-carbon coordination system issues electricity and emissions from one source; the 4×3×2 energy-carbon autonomy system covers metric configuration and layered dashboards. Models and interfaces follow the current selection manual; range, channel count, supply and communication are configurable.
Frequently Asked Questions
Intensity or the total — which do we report?
Ask the assessor first: policy reviews, customer questionnaires and group templates differ. With no stated requirement, report both and name the basis.
Current or constant prices?
Constant prices for any year-on-year or target comparison; current prices for internal observation. Without an index, use physical output, or say "not deflated" rather than implying otherwise.
What if the mix changes under a physical-output denominator?
Compute intensity per product and weight the results, or decompose into efficiency and mix. The first is more accurate; the second explains why it moved.
If intensity falls, have emissions fallen?
Not necessarily. If output grows faster than emissions, intensity falls while the total rises. Check the total and composite consumption.
Is carbon intensity the same as energy intensity?
Same possible denominator, different numerator: CO₂ versus coal equivalent. With a stable mix they move together. After coal-to-electricity conversion, energy intensity on the coal-equivalent basis usually falls while carbon intensity depends on the grid factor; on the equivalent-value basis (last year's national coal consumption for thermal power supply, around 0.30–0.31 kgce/kWh, subject to the published value) energy intensity can even rise.