 FEXLINK Research Institute
The short answer
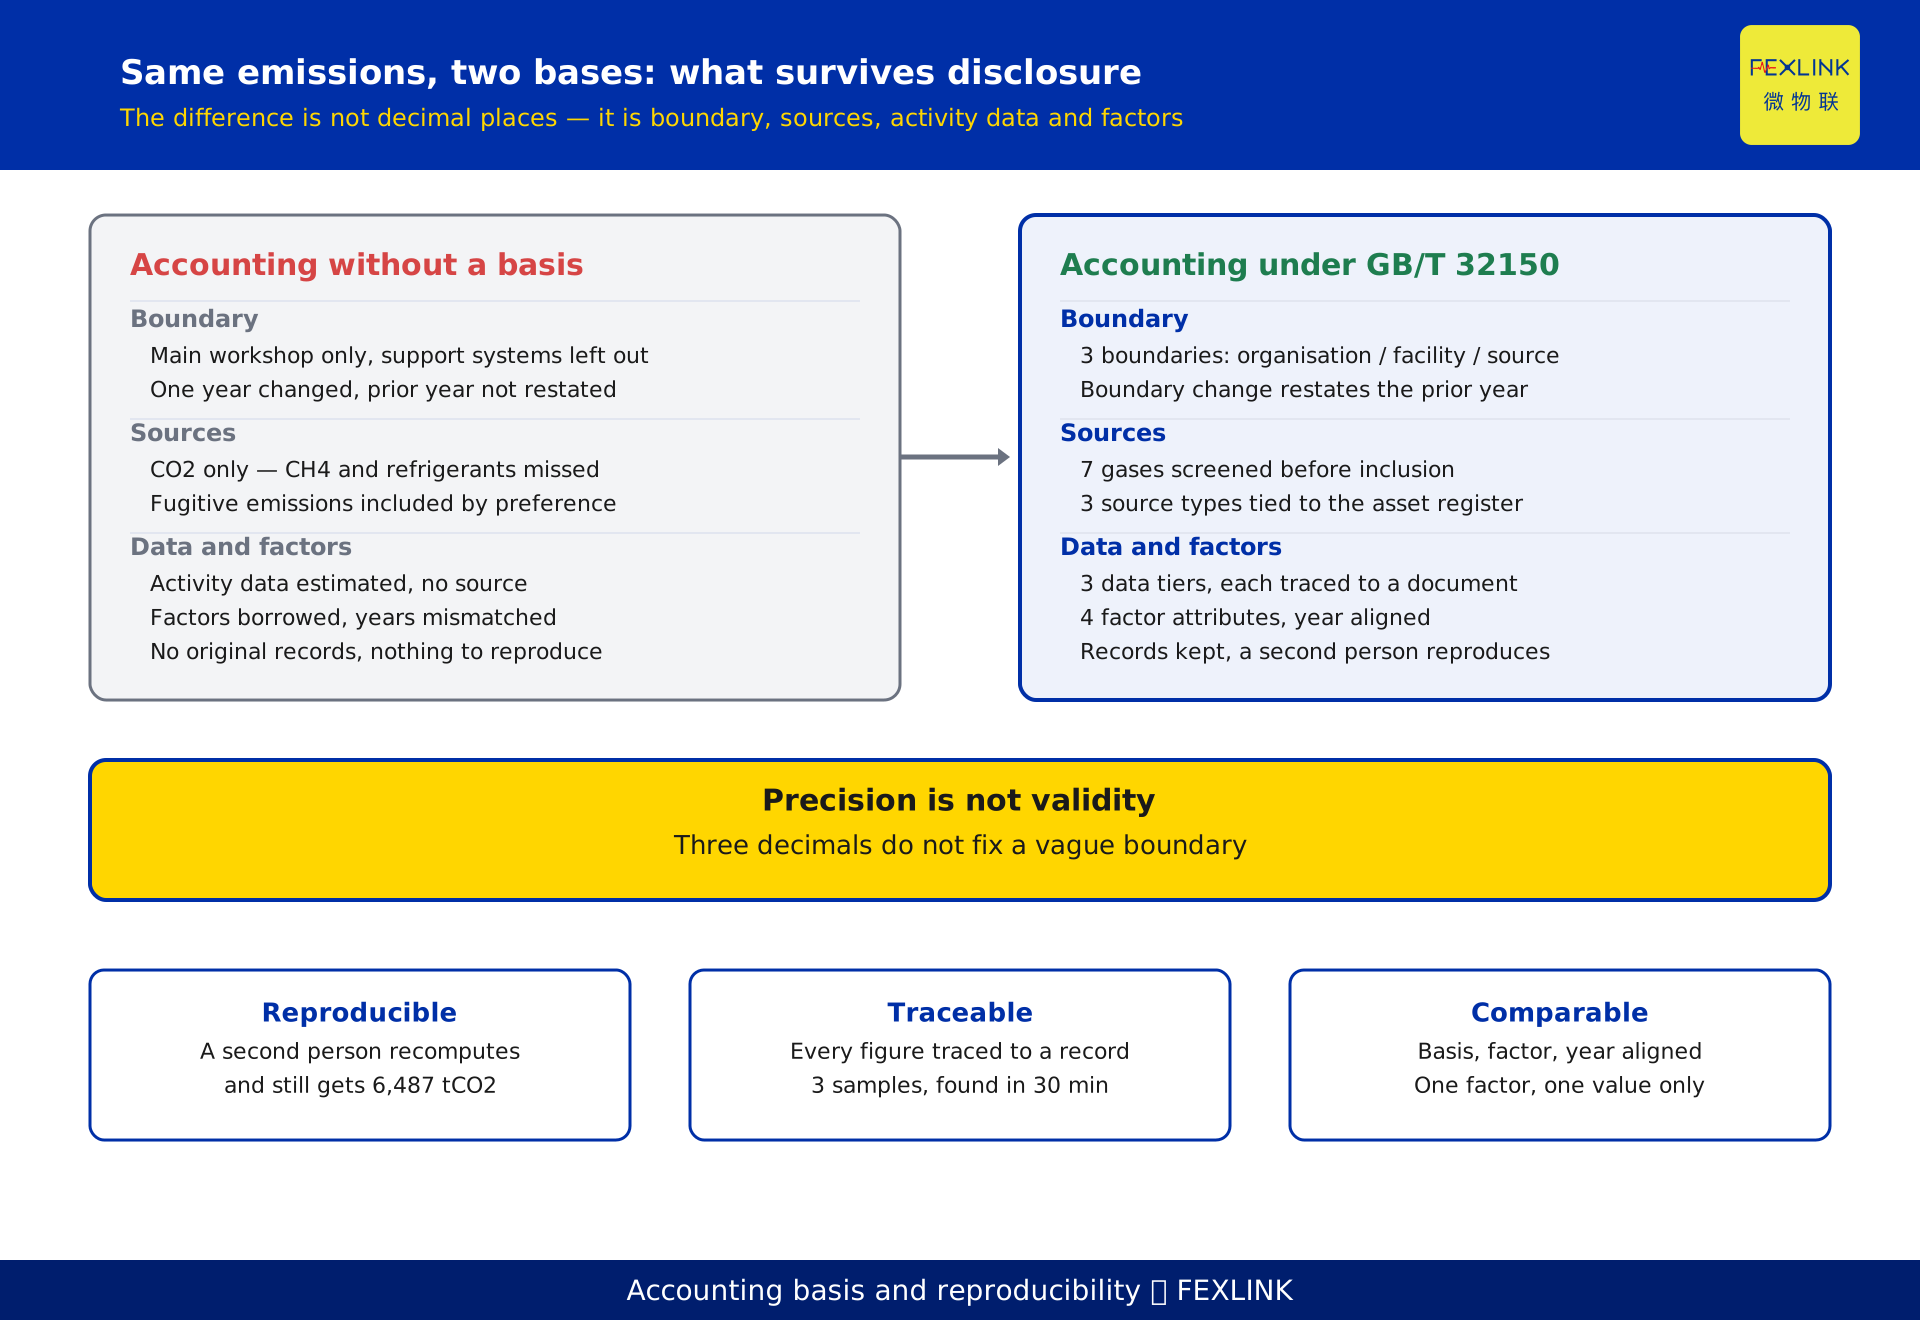
GB/T 32150 (General guidelines for the accounting and reporting of industrial greenhouse gas emissions) fixes four things: where the boundary sits, which sources are counted, where activity data comes from, and which factors apply. It is not a method for making numbers more precise. It is the rule that makes two companies, two reporting years, or a company and its verifier talk about the same quantity. Follow it and the result can go into disclosure and survive verification. One test decides whether an inventory stands: hand your raw records to someone else — can they reproduce the same figure?
1. A general standard, not an industry method
GB/T 32150 is the general standard for accounting and reporting industrial GHG emissions. It supplies the framework — boundary, sources, calculation, data quality, reporting format — and deliberately sets no industry parameters. Sector methods live in the GB/T 32151 series, published in parts (power generation, grid, steel, cement, chemicals, aluminium and others), with ministry guidance alongside.
The order of use is not negotiable: sector standard or guidance first; the general standard only where the sector is silent; ISO 14064-1 or IPCC only where both are silent. Applying the general standard to an industry that has its own method costs you the sector-specific sources and default parameters.
The test is blunt: the first page should name the standard number and the version year. If it cannot, that is the first question in the verification kickoff meeting.
This is also where this article differs from the companion piece on the shift from energy control to carbon control: that one covers the policy change, this one covers how a given carbon figure is produced.
2. The boundary is three lines, not one box
Organisational boundary. The legal entity, or an equivalent independently accounted unit. Multi-site companies account per site and consolidate; you do not report only the site with the lowest emissions. At group level, subsidiaries are not double-counted.
Facility boundary. Main production systems, auxiliary systems and supporting systems. The test is not "does it make product" but "does it serve this unit's production activity". Compressor stations, boiler houses, cooling water, on-site transport, quality control and office buildings are inside. Counting only the main workshop under-counts; counting outsourced processing double-counts.
Source boundary. Fuel combustion, industrial processes, and indirect emissions from purchased electricity and heat. Whether fugitive emissions (refrigerants, SF6) and waste treatment count depends on the sector standard and the reporting requirement. Companies do not add or drop sources at will — over-counting is as much an error as under-counting.
One rule gets missed: when the boundary changes, prior-year figures must be restated. A new line, a merged site, a process change — restate the comparison year or the two reports cannot be compared.
3. List every source before calculating any of them
The source inventory has to reconcile to the asset register and the process flow diagram: one row per boiler, per kiln, per incoming feeder. Each row carries the source name, gases, activity data source and an owner. Miss one and the row will not survive verification.
Three categories: fuel combustion (boilers, kilns, on-site vehicles), industrial process (chemical reactions in raw materials, such as carbonate calcination or ammonia synthesis), and indirect (purchased electricity and heat). Fugitive emissions sit outside the three and are listed only if the sector requires it.
On gases, the standard covers the seven under the Kyoto framework: CO2, CH4, N2O, HFCs, PFCs, SF6 and NF3 — check the current text for the exact scope. Most plants touch two or three. But "we only count CO2" is not a complete inventory: methane in organised emissions, refrigerants, SF6 switchgear all need separate identification.
Different gases only add up as CO2e, through GWP. The GWP version has to match the accounting basis. AR4 gives 100-year values of 25 for CH4 and 298 for N2O; AR5 raises CH4 to 28, or 34 with climate-carbon feedback. The same methane inventory moves by more than ten percent across versions, and versions cannot be mixed within a report.
4. Activity data: three tiers, hardest first
Activity data is where inventories fail: it does not sit with the carbon team but with energy, procurement, production and finance.
Tier one, metered. Fuel flow meters, electricity meters, heat meters, belt scales. Four conditions: calibration in date, range matched to actual load, current transformer ratio matched to the meter setting, readings backed by original records. Fail any one and the reading drops to an estimate.
Tier two, settlement documents. Electricity invoices, gas statements, weighbridge tickets, heat bills. Watch period alignment: billing periods rarely match the reporting year, so cross-year portions must be split by month rather than borrowed as an annual figure.
Tier three, mass balance or estimation. Back-calculating from output times specific consumption, or from a carbon balance. If used, state the method, the assumptions and the uncertainty, and label the figure as an estimate.
The test is one line: every activity figure traces to an original document or a metering record. What cannot be traced is labelled an estimate and enters the uncertainty statement — it does not sit in the report pretending to be measured.
Unit conventions cause more errors than data collection itself. Gas by volume or mass, in cubic metres or ten-thousand cubic metres; steam by mass or by heat; electricity as purchased or as received, with self-generation and pass-through handled explicitly. Get the convention wrong and the error is an order of magnitude, not a few percent.
Electricity deserves attention first: it usually accounts for all of the indirect emissions, and it is the easiest to leave as a single total. A main meter gives the plant total; accounting and verification want it by facility, by month, traceable. The ESA all-element smart meter (for example ESA-22131-R, 3×400A, 3×220/380V, RS485 Modbus) is installed per circuit and freezes readings monthly, so purchased and self-generated electricity each have their own record; the ESB three-phase imbalance monitor adds phase data, the ESE power quality monitor adds harmonics. The point is not finer arithmetic — it is original records when the verifier asks.
5. Emission factors: priority, year, and no picking your own
Three tiers: measured (net calorific value and carbon content per unit of heat can be sampled and tested), official defaults (sector guidance annexes, provincial inventory guidance), and international defaults (IPCC). Use the first two wherever possible; where the third is used, say why.
For electricity the year matters most: the factor must match the reporting year, taken from the national or regional grid factor published for that year or the most recent applicable year. Three prohibitions — no old-year factor on a new year, no mixing regional and national factors within one year, no unattributed "industry average".
Green power and certificate deductions follow the authority's current rules. A deduction with no rule behind it gets rejected, and usually forces the whole indirect figure to be recalculated.
The test: each factor carries four attributes — name, issuing body, version or year, and scope of application. Miss one and the factor is not defensible. The most common rejection cause is one factor with two different values in one report, usually because two people looked it up separately.
6. One line of multiplication, three unit traps
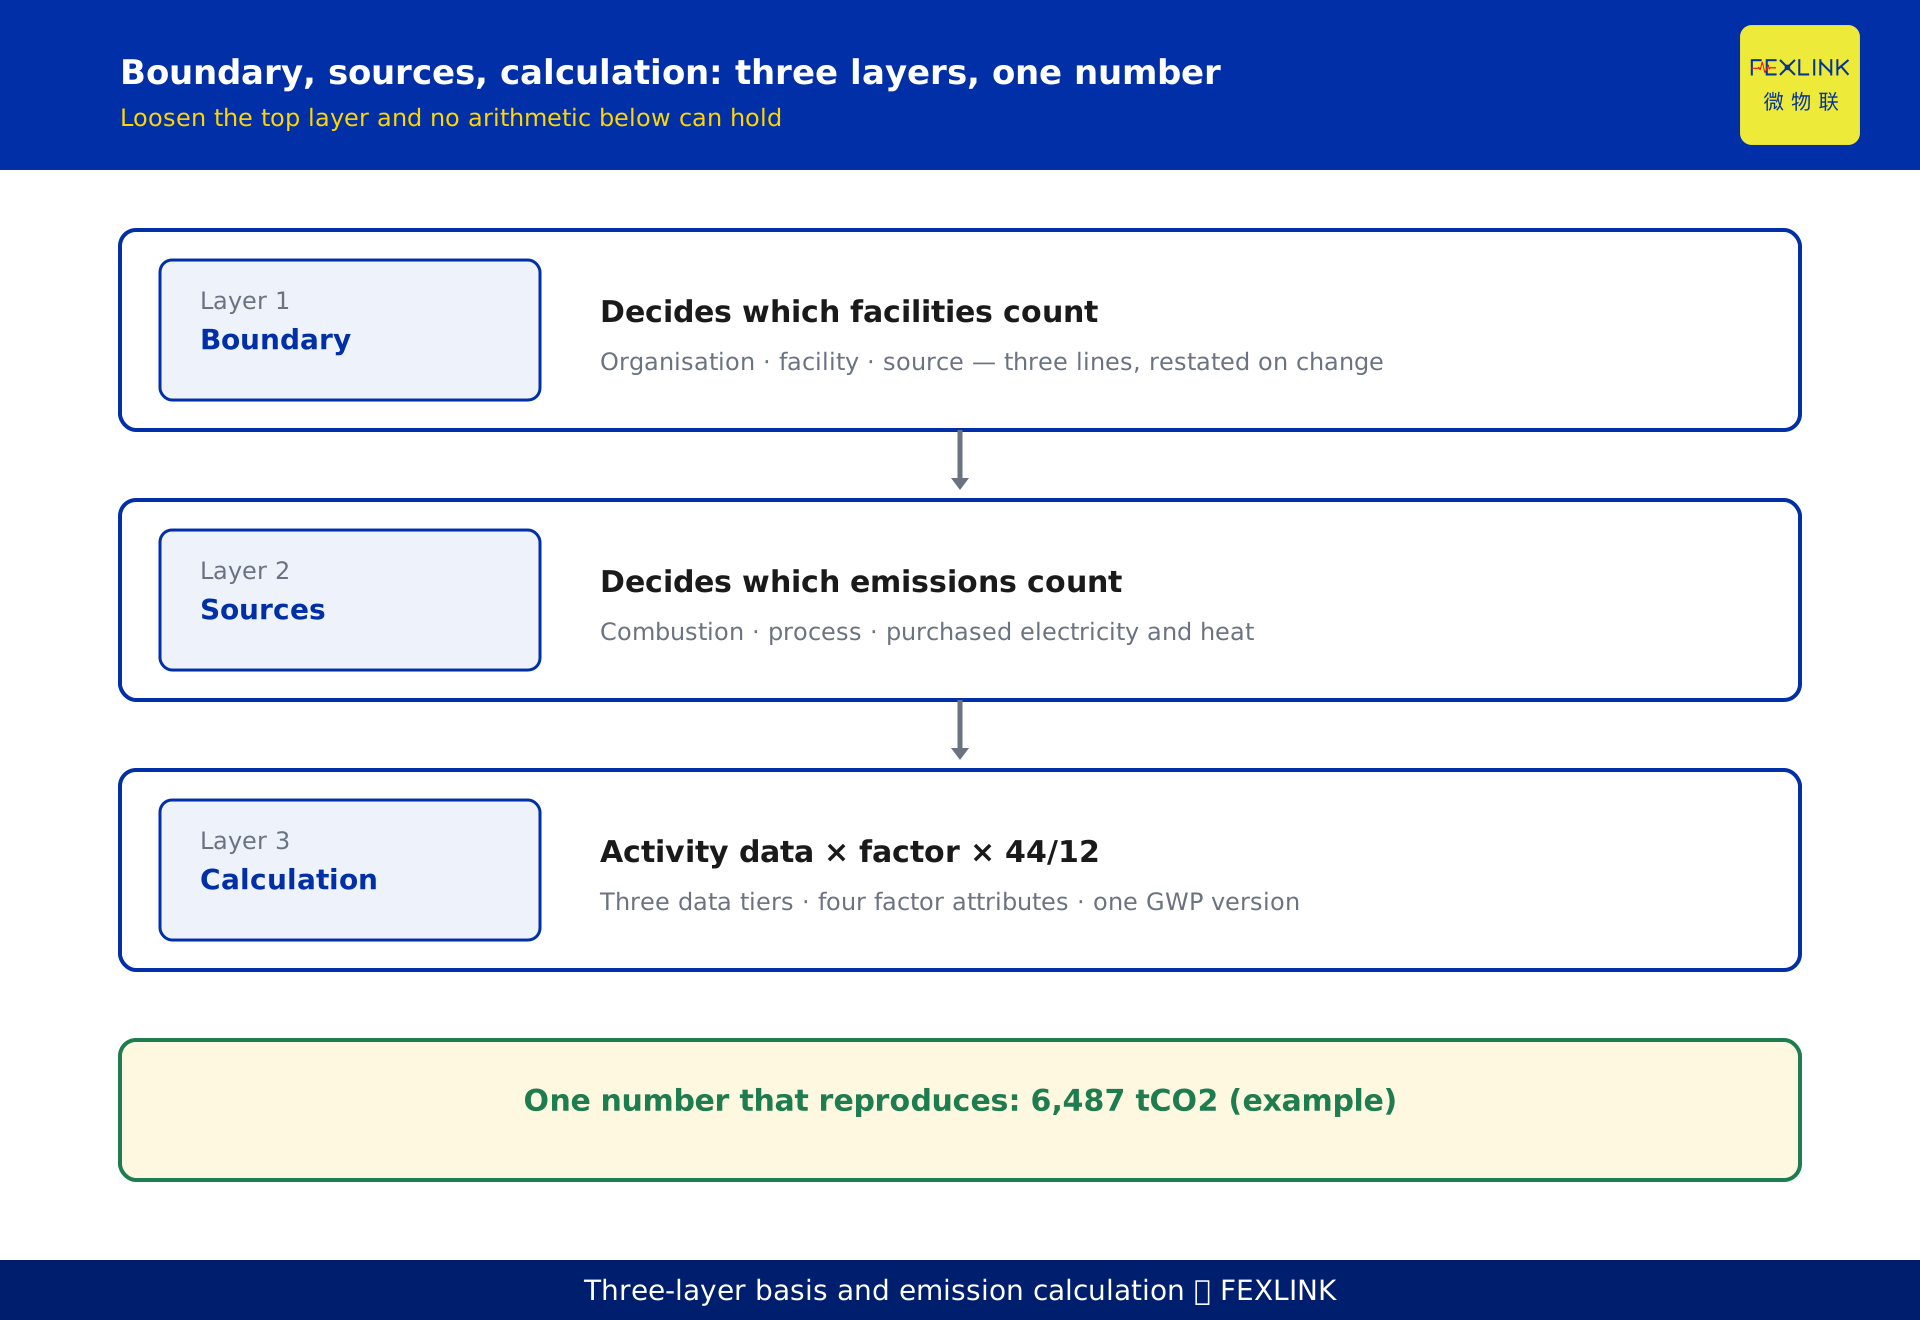
Emission = fuel consumption × net calorific value × carbon content per unit heat × oxidation rate × 44/12
A natural gas example (illustrative figures; defaults from public guidance annexes, current guidance governs): a plant burns 300 ten-thousand Nm³ of gas — 3,000,000 Nm³ — in a year, net calorific value 389.31 GJ per ten-thousand Nm³, carbon content 15.3 tC/TJ, oxidation rate 99%. Energy is 300 × 389.31 = 116,793 GJ, or 116.8 TJ. Carbon is 116.8 × 15.3 = 1,787 tC. Converting to CO2: 1,787 × 44/12 = 6,552 t. Applying the oxidation rate: 6,552 × 99% ≈ 6,487 tCO2.
All three traps are units. Reading ten-thousand cubic metres as cubic metres is off by a factor of ten thousand, and the result looks reassuringly small. Feeding GJ into a carbon content whose denominator is TJ is off by three orders of magnitude. And applying 44/12 twice overstates by 3.67 times.
Getting the line right is not about the formula. It is about writing the unit and the source next to every input. A report that keeps only the result has given up its ability to prove itself.
7. Data quality: four things that end the conversation
Source inventory and data flow diagram. Every figure traced from meter or document, through whose hands, into which sheet, out to which report. If you cannot draw it, the chain has a break.
Meter register. ID, location, range, ratio, calibration validity, last calibration date. The most common verifier move is walking the register against the meters on site.
Missing-data and exception rules. How a missing month is filled, how an outlier is judged, who approves, how a filled value is flagged. Written down, not remembered.
Records retention. Original documents, calculation sheets, parameter sources, version history — retained as the authority and the verifier require, covering at least the period verification can reach back into.
8. Where ISO 14064-1 fits, and where it does not
The two are not substitutes. GB/T 32150 carries domestic compliance; ISO 14064-1 carries the common language of international disclosure and supply-chain questionnaires.
What aligns is principles and boundary concepts. Both require relevance, completeness, consistency, accuracy and transparency, and the independently accounted unit is close to the operational control approach in ISO 14064-1.
What does not align is the categories. ISO 14064-1 sorts emissions into six: direct, imported energy, transportation, products used by the organisation, use of products, and other indirect. The three categories in GB/T 32150 cover roughly the first two. The remaining four are generally not required domestically and must be added for international disclosure.
One practical rule: one set of activity data, two sets of reports. Build boundary, sources, data and factors to the domestic standard first, then map to the ISO categories. A second data source will never reconcile.
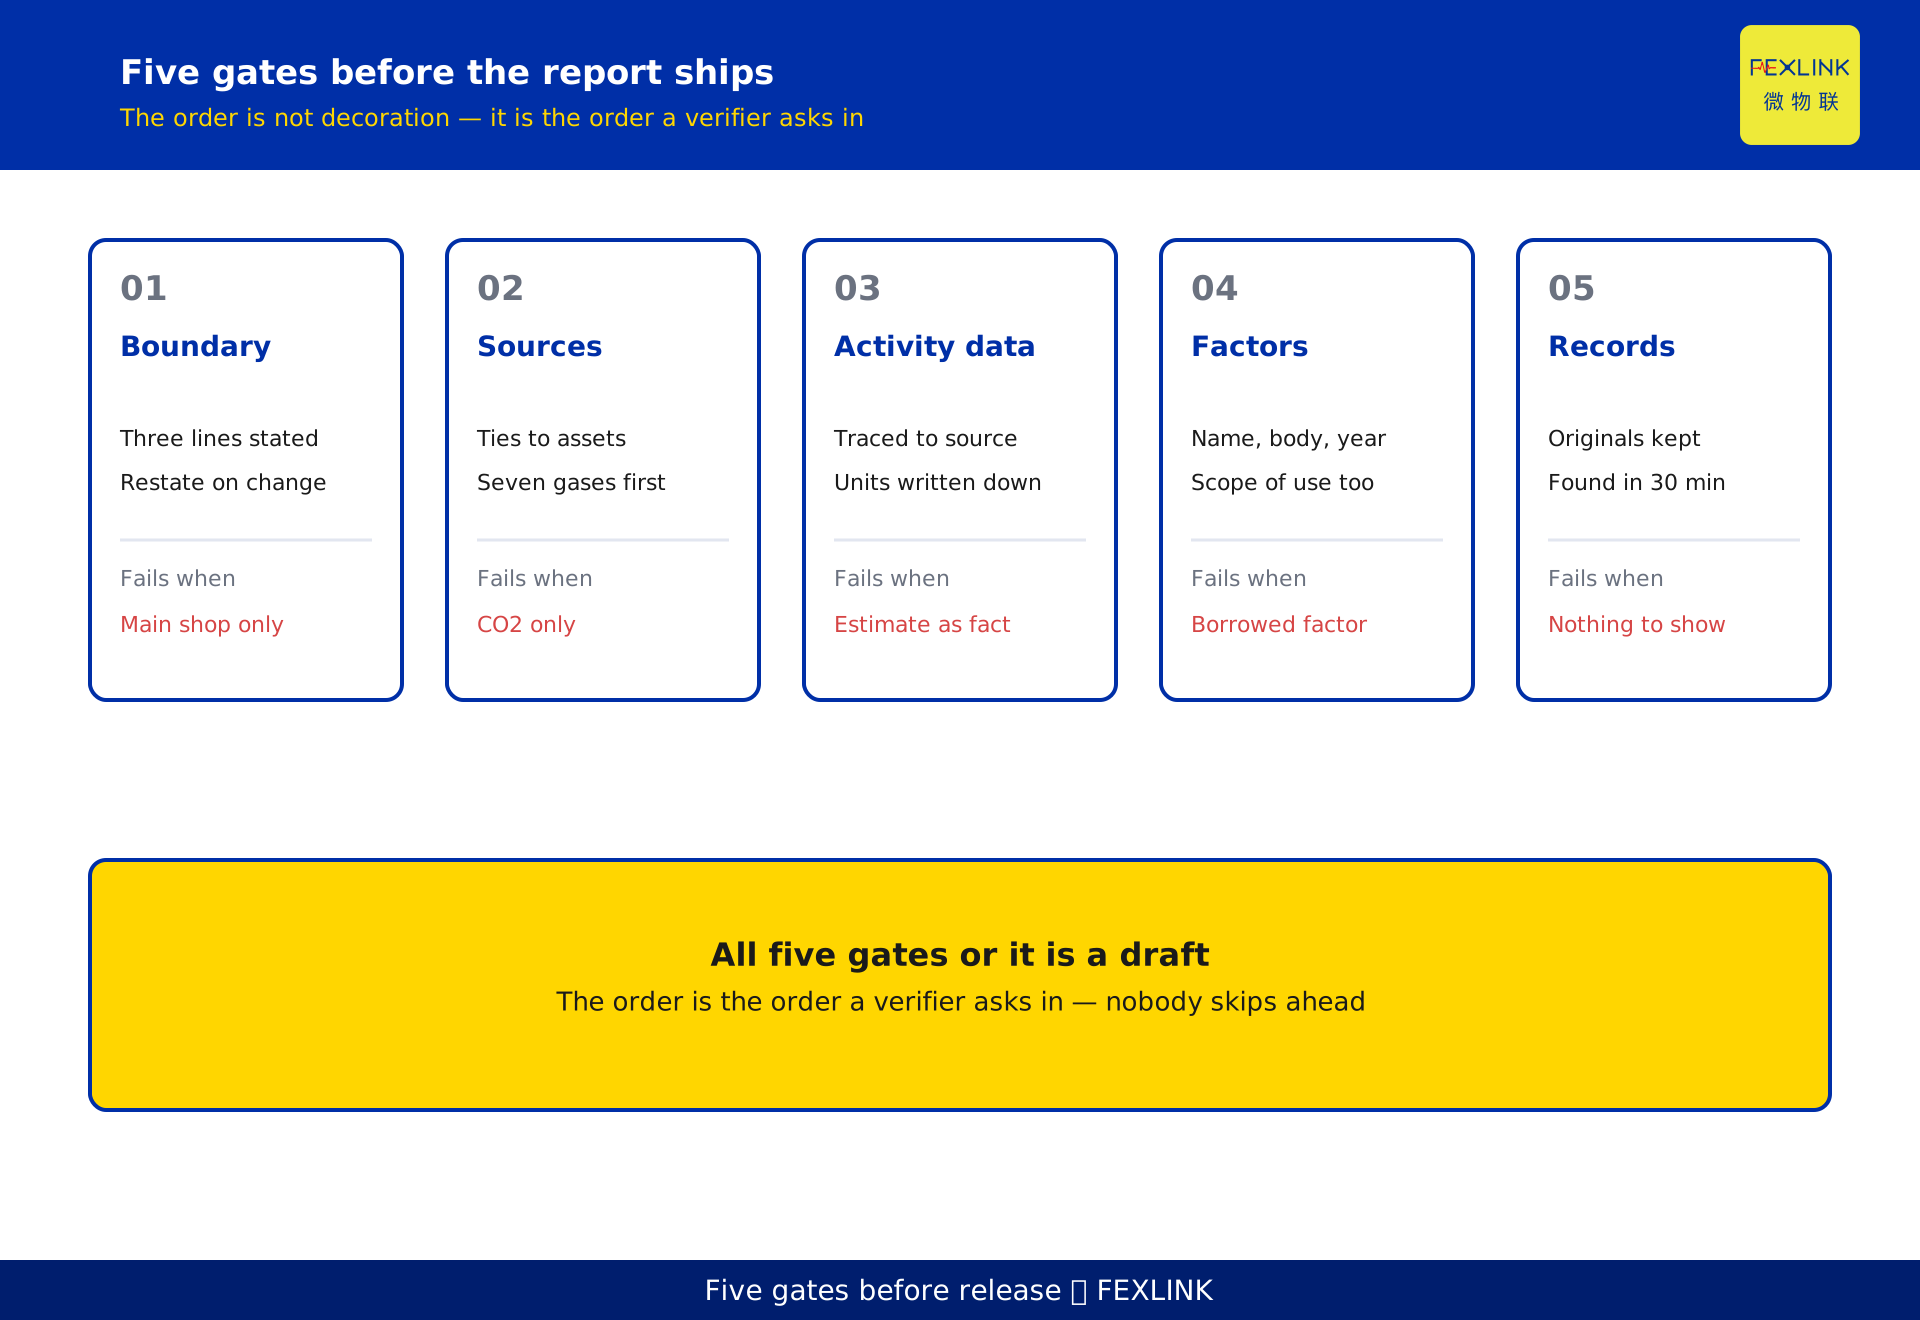
9. Five gates before the report leaves the building
Boundary on three lines; sources reconciled to the asset register; every figure traceable to a document; every factor with four attributes; three random data points reachable in thirty minutes. Any gate failed and the report is a draft — the order is the order a verifier asks in.
10. FAQ
Q: Our sector has its own GB/T 32151 part. Do we still need GB/T 32150?
Yes, but for a different job. The sector part sets parameters and sources; the general standard sets the framework and the principles. When the sector part is silent — a new source not on its list, for instance — use the general standard's principles to decide inclusion, and state the reasoning.
Q: If we cannot meter an activity, does an estimate get rejected outright?
No, but it must be handled as an estimate. The standard allows estimation or mass balance where measurement is not possible, provided the method, assumptions and uncertainty are stated and the figure is labelled separately. What gets rejected is an estimate reported as a measurement.
Q: National grid factor or regional grid factor?
Whichever your accounting basis requires. National factors suit companies operating across regions that cannot be split; regional factors track the local generation mix and suit companies with a defined supply area. The hard rule is one set per year.
Q: We got last year wrong. Do we restate it?
Yes. A change of method or parameter is a change of basis; restate the comparison period and disclose the reason and the effect. Fixing only the current year disguises a basis change as an emission reduction.
Q: Can third-party verification replace internal data quality management?
No. Verification samples; it does not build your system. What it does not sample still exists, and remediation stays with you. Data quality management is finished before the verifier arrives.
Scope and limitations
- This article covers the general-standard level of GB/T 32150; sector source lists, defaults and calculation detail follow the relevant GB/T 32151 part.
- No clause numbers are cited. Chapter structure and wording change between editions; cite the current effective text.
- In the Section 6 example, 3,000,000 Nm³ is illustrative; 389.31 GJ per ten-thousand Nm³, 15.3 tC/TJ and a 99% oxidation rate fall within published guidance defaults. Values differ by edition and gas source; actual inventories use current guidance and measured data. The example represents no real company.
- GWP values (AR4: CH4 25, N2O 298; AR5: CH4 28, or 34 with feedback) are public IPCC figures; which version a standard adopts is governed by its current text.
- Grid emission factors are published by the competent authority; this article gives the rule, not the number.
- The boundary split, data tiers and five gates are an operational reading of the standard, not a compliance conclusion for any specific project.
- Model numbers and specifications for the ESA smart meter, ESB imbalance monitor and ESE power quality monitor follow the current selection manual. This article is not a selection recommendation.
Frequently Asked Questions
How to Apply GB/T 32150 for Industrial GHG Accounting
GB/T 32150 (General guidelines for the accounting and reporting of industrial greenhouse gas emissions) fixes four things: where the boundary sits