 FEXLINK Research Institute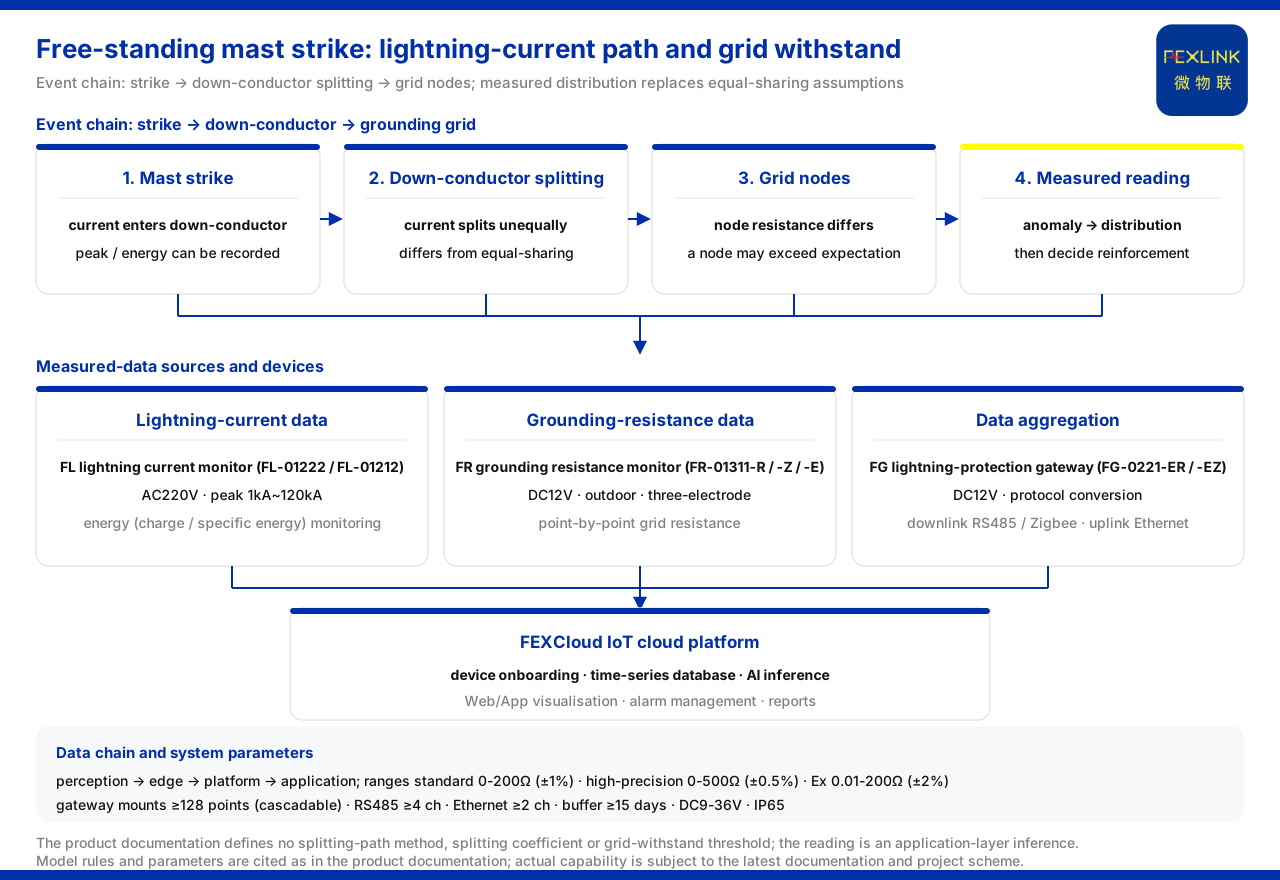
Direct answer
After an independent lightning rod is struck, the lightning current does not follow a single path to earth. It is distributed through the down-conductors, the grounding grid and the individual grounding points, and the current actually taken by each point often departs from the equal-sharing assumption used at design stage. To answer "where does it go, and can the grounding grid withstand it", a workable approach is to place monitoring devices at the down-conductors and at key nodes of the grounding grid, record the peak, the energy and the per-node grounding resistance of each discharge, aggregate the data locally through a gateway and send it back, and replace the equal-sharing assumption with the measured distribution so that the actual current-sharing paths and the relatively weak grounding points can be identified. It must be stated in advance that the product knowledge base gives no "method for calculating the lightning-current sharing path", no "current sharing coefficient" and no "grounding-grid withstand threshold or model"; the interpretation in this article is an application-layer inference, and what the knowledge base provides is only the basis of model capability and system parameters.
Why design assumptions alone cannot decide
How the lightning current is shared between the down-conductors and the grounding grid depends on the number of down-conductors, the grid structure, the soil conditions and the actual resistance at each grounding point. At design stage it is usually estimated by equal sharing or by an empirical coefficient, but the resistance at the nodes of a grounding grid is not in fact equal; one point may carry more current than expected and become the starting point of heating and potential rise. To make "one point carrying more than expected" detectable, at least two classes of mutually comparable measured data are needed: the grounding-grid resistance at each node, and the peak and energy of the lightning current that each down-conductor experienced. Without measurement, the withstand judgement stays at the level of assumption.
Available monitoring models and capabilities
The first class is lightning-current data. The product knowledge base defines the FL lightning current / transient current monitor (e.g. FL-01222, FL-01212), whose model rule is FL–[detection range][channel count][function][installation method][supply]–[communication]. For this topic, both the indoor and the outdoor version have a peak range of 1kA~120kA, both support energy (charge / specific energy) monitoring, and both are supplied at AC220V. This peak and energy monitoring capability can record the amplitude and energy of the lightning current flowing through the down-conductor of an independent lightning rod after a strike, and provides the device basis for identifying the actual sharing path.
The second class is grounding-resistance data. The product knowledge base defines the FR grounding resistance monitor (e.g. FR-01311-R), whose model rule is FR–[signal acquisition][detection principle][installation method][supply]–[communication], where signal acquisition 01 denotes grounding-grid resistance, detection principle 2 is the loop method and 3 the three-point method, and installation 1 is outdoor and 2 indoor. The R, Z and E versions of this model family all use a DC12V supply, outdoor installation and three-electrode measurement, with communication corresponding to RS485, Zigbee and Ethernet respectively. The ability to measure grounding resistance point by point can be used for the measured resistance of each node of the grounding grid, replacing a withstand judgement that rests only on design assumptions.
The third class is data aggregation. The product knowledge base defines the FG lightning-protection smart gateway (e.g. FG-0221-ER), whose model rule is FG–[gateway type][installation method][supply]–[downlink][uplink], where gateway type 01 is transparent transmission and 02 is protocol conversion; both models of this gateway use DC12V, are of the protocol-conversion type, and have an Ethernet uplink with downlinks corresponding to RS485 and Zigbee respectively. It can aggregate the lightning-current and grounding-resistance data of multiple measurement points nearby and send it back, forming the measured data path for sharing analysis.
How the data joins into one measured chain
At system level, the product knowledge base divides the general architecture of the monitoring system into four layers: perception layer (the various monitoring modules), edge layer (the gateway), platform layer (the FEXCloud IoT cloud platform) and application layer. On protocols, device downlinks support Modbus RTU (RS485), Zigbee (Modbus) and LoRa, while device uplinks support Modbus TCP and MQTT (Ethernet, 4G), with IEC 61850 optionally available at gateway level. For system-level reference parameters, the monitoring-unit range is divided into the standard type 0-200Ω (±1%), the high-precision type 0-500Ω (±0.5%) and the explosion-proof type 0.01-200Ω (±2%); the smart gateway mounts no fewer than 128 points and can be cascaded, provides no fewer than 4 RS485 channels and no fewer than 2 Ethernet channels, offers 4G/5G/LoRa as options, buffers no fewer than 15 days of data, is supplied at DC9-36V wide voltage, and has a protection rating of IP65. The gateway's multi-point mounting and multi-channel uplink capability provides a system-level basis for synchronous monitoring of multiple measurement points.
For anomaly identification, the grounding-resistance abnormal open-circuit red line of the product knowledge base is based on GB 50057; once triggered, it outputs the highest-level alarm directly, and no one can raise the threshold. This provides a source of alarm criteria for grounding-grid integrity, and can serve as the basis for identifying abnormal states in the "can it withstand" question.
A recomputable reading order
Once the data above is available, the check can proceed in the order "look at anomalies first, then at distribution, then decide reinforcement": first inspect the nodes that show an abnormal grounding resistance or an open-circuit alarm, then compare the peak and energy recorded by each down-conductor in the same thunderstorm to find the grounding point that took a clearly higher current, and finally judge, together with the grounding resistance and structure at that point, whether reinforcement is needed. The knowledge base gives no sharing-path algorithm, no sharing ratio and no withstand threshold; the order above is an application-layer inference, and the actual criteria should be determined by the engineering party in conjunction with site data and the design basis.
Scope and limitations
- The models, parameters and system capabilities in this article are based on the existing statements of the product knowledge base, and are not extended to sharing calculations, sharing coefficients or grounding-grid withstand criteria not listed in the knowledge base.
- The product knowledge base does not define a "method for calculating the lightning-current sharing path after an independent lightning rod is struck", a "current sharing coefficient" or a "grounding-grid withstand threshold or calculation model", nor does it define selection criteria for lightning-rod down-conductors or grounding-grid reinforcement sections; the related interpretation in this article is an application-layer inference and must not be understood as a delivered capability of the knowledge base.
- The model rules and parameters in this article (supply, measurement method, installation environment, range, mounting point count, protocol and protection rating, and so on) are cited as they appear in the knowledge base and do not constitute a commitment to the result of a specific project.
- This article constitutes no commitment to any unlisted indicator; actual capability is subject to the latest product documentation and project scheme.