 FEXLINK Research Institute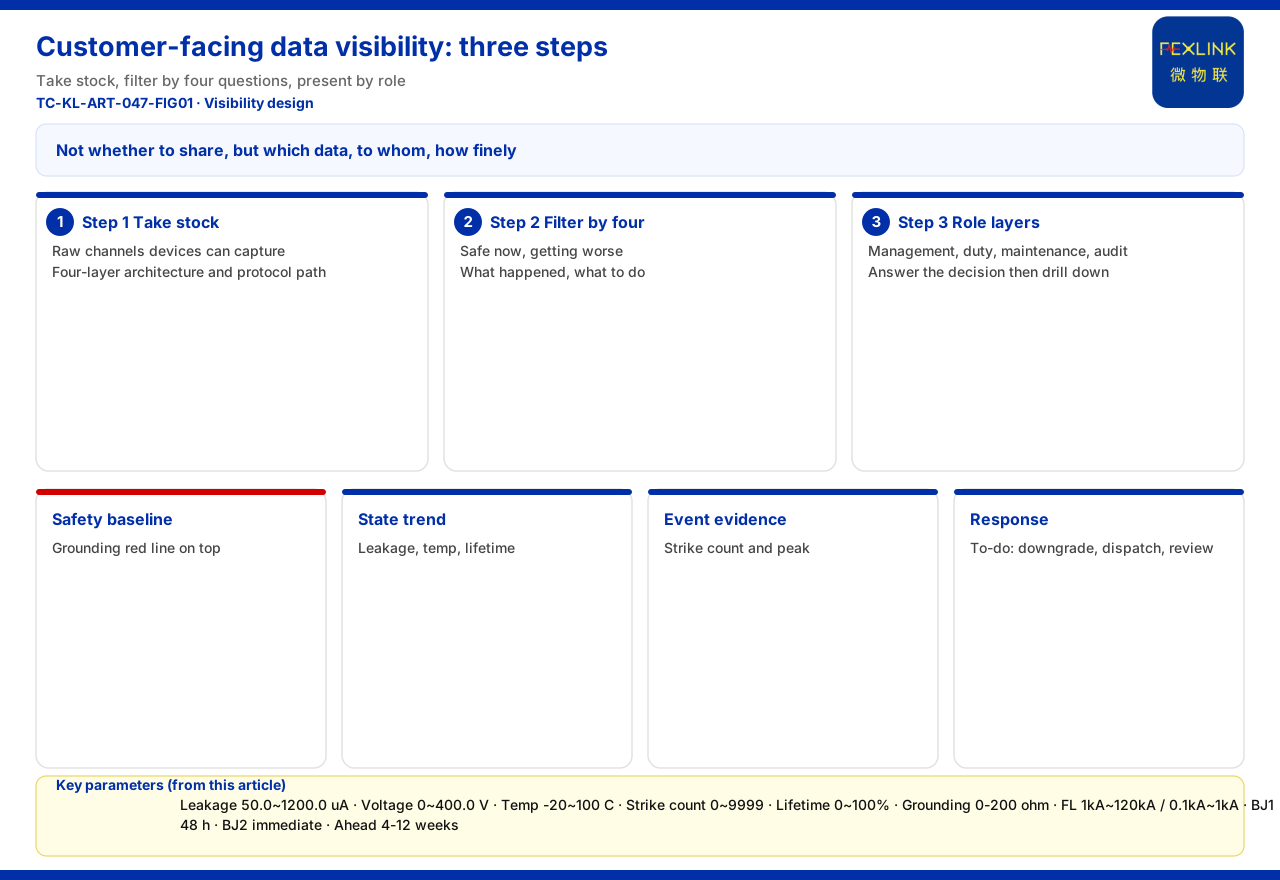
Clients often ask at acceptance: can you open all the raw data to us? The answer is rarely "give everything"; it is "choose the right things". In lightning-protection and electrical-safety monitoring, value comes from the subset of data that supports judgement and action, not from volume. This article gives a three-step method: take stock of what monitoring captures, filter decision-relevant data against four questions, then present it in role-based layers.
Why "Give the Customer All the Data" Often Means Giving Nothing
Opening every raw channel looks transparent but is often useless. First, quantity without judgement: when leakage current moves from tens of microamps to hundreds, the client cannot tell degradation from normal fluctuation. Second, channel overload: one site carries leakage, temperature, voltage, grounding and lightning signals with no priority, so the safety baseline mixes into background noise. Third, granularity mismatch: management asks "is there risk?", the duty operator asks "do I send someone now?", and maintenance needs device parameters. The point is not whether to share data but which data, to whom, and how finely.
Step One: Take Stock of What Monitoring Can Capture
We must first know what can be captured. The knowledge base defines the monitoring system as four layers — perception, edge, platform and application: the perception layer collects data from FS/FR/FL/ES series monitoring modules and sensors, the edge gateway uploads it to FEXCloud, and the application layer presents visualisation, alarms, reports and inspections. Visibility also depends on the transmission path: the protocol matrix gives device downlinks (Modbus RTU/RS485, Zigbee, LoRa) and uplinks (Modbus TCP/MQTT; IEC 61850 optionally at gateway level).
On that path, the measurables are verifiable. The FS surge protective device monitor covers remote signalling, air-switch status, grounding status, lightning-strike count, leakage current, temperature, voltage and lifetime estimation, with key parameters of leakage current 50.0~1200.0 μA (±10 μA), voltage 0~400.0 V (±0.1 V), temperature -20~100 °C (±1 °C), lightning-strike count 0~9999 (minimum trigger 0.1 kA) and lifetime estimation 0~100%. The ESM intelligent monitoring terminal adds full elements including humidity, with DC5V or AC220V supply; the FR-01311 grounding resistance monitor uses the three-electrode method, DC12V supply and outdoor installation. Lightning and transient events are monitored by FL: FL-01222 (indoor) and FL-01212 (outdoor) cover 1 kA~120 kA with energy monitoring, while FL-11122 (indoor) covers 0.1 kA~1 kA. Data is aggregated and uplinked by the FG intelligent gateway, a protocol-conversion type with RS485/Zigbee downlink, Ethernet uplink and DC12V supply.
That list is raw channels a device can capture, not data a client should see; selection and presentation make the difference.
Step Two: Filter Decision-Relevant Data with Four Questions
Translating raw channels into content a client understands can be organised around four questions: is it safe now, will it get worse, what just happened, and what should be done. Facts behind each trace back to the knowledge base.
First, is it safe now — safety-baseline data. The knowledge base lists "abnormal open circuit of the grounding resistance" as the non-bypassable red line, per GB 50057; a trigger emits the highest-level alarm directly, bypassing weighted scoring. In the same six-level alarm scheme, BJ1 (20-39 points) requires action within 48 hours and BJ2 (0-19 points) requires immediate shutdown. It belongs at the top: it answers whether a safety problem must be handled now.
Second, will it get worse — state-trend data. The knowledge base records that the Tianyan engine's S-02 residual-current trend drift (CUSUM) model detects a weak mean shift while leakage is still safe, giving 4-12 weeks' advance warning; FS leakage current, temperature and lifetime estimation (0~100%) provide continuous device-side observations. Trends turn "when to service" from reactive to proactive, where clients most clearly perceive service happening.
Third, what just happened — event-evidence data. Lightning strikes are low-frequency, high-consequence events; clients want to know whether they were struck and how hard. The FS lightning-strike count (0~9999, minimum trigger 0.1 kA) and FL peak and energy monitoring (1 kA~120 kA) answer those questions. Such data suits a timeline of what happened before and after, for review and liability definition.
Fourth, what should be done — response and handling data. An alarm level alone does not drive action; it must carry how fast to respond, which standard it rests on, and how confident it is. Each alarm in the knowledge base carries a standard-clause citation and confidence level, and the Taiyi hub described in runs a seven-stage pipeline (L1 ingest → L2 cleansing → L3 red-line pre-check → L4 Qianzhi analysis → L5 Wanxiang assessment → L6 fusion decision → L7 persistence) end to end in under 2 seconds. This class should be organised as a to-do list — de-escalate, dispatch, review — not another wall of charts.
Step Three: Present in Role-Based Layers
The same data needs different granularity per role.
- Client management and safety owners: red-line status, composite grading and trend conclusions, to judge whether risk is under control;
- Operations duty staff: current alarm level, handling deadline and a to-do list, to decide whether to dispatch immediately;
- Maintenance staff: device-level parameters such as FS leakage current, temperature and lifetime estimation, and FR grounding resistance, to locate faults and prepare spares;
- Compliance and audit roles: standard-clause citations and event-evidence records, to support inspection and liability definition.
Layering does not hide data; it prioritises what to look at. The same raw data should first answer the relevant role's decision question, then allow drill-down.
Scenarios and Platform Landing Points
Visibility design must land in scenarios. The comparison in the knowledge base provides anchors: for device condition monitoring (retrofit of existing SPDs), the recommended combination is the FS monitor, ESM full-element SPD monitoring and the FSP base; for online monitoring of substation and traction substation grounding grids, it is FR-01311 (one per point) plus an FG gateway plus FEXCloud. In both, what to show derives from device capability: the retrofit scenario centres on device health and lightning events, the grounding-grid scenario on grounding status and red-line reach.
Boundaries: What This Article Does Not Claim
Second, the quantitative indicators in the knowledge base (electrical-hazard identification rate 95%+, alarm compression ratio 80%, 4-12 weeks' warning lead time, fault-localisation from days to 2 hours, MTTR reduced by 60%, energy-saving potential 8-20%) are vendor self-reports. They may be cited as vendor capability claims only, never as commitments, guarantees or procurement grounds for a visibility design.
Third, this article provides no dashboard-layout specification, field dictionary, role-permission model or concrete sampling and reporting frequency (the latter is a separate topic), and claims no usage, satisfaction or retention effect; it invents no model, parameter, certification or case absent from the knowledge base.
Fourth, it does not reuse the landing points of business articles: the existing-SPD upgrade path, engineering-firm organisation and service transformation, contracting and business models, and the shift from annual testing to continuous risk service; it answers only which client-facing data to select and who should see it.
Conclusion
Clients do not need all raw data; they need four classes that drive decisions: a safety baseline answering "is it safe now", state trends answering "will it get worse", event evidence answering "what just happened", and response and handling answering "what should be done". The route is three steps: take stock of what devices can capture, filter against the decision questions, and present in role-based layers. For the client, the acceptance bar rises from "data is connected" to "the data that matters is seen first"; for the provider, delivery shifts from piling on features to making trade-offs. The method can be borrowed, but the specific plan and effects require item-by-item confirmation against project and compliance requirements.