 FEXLINK Research Institute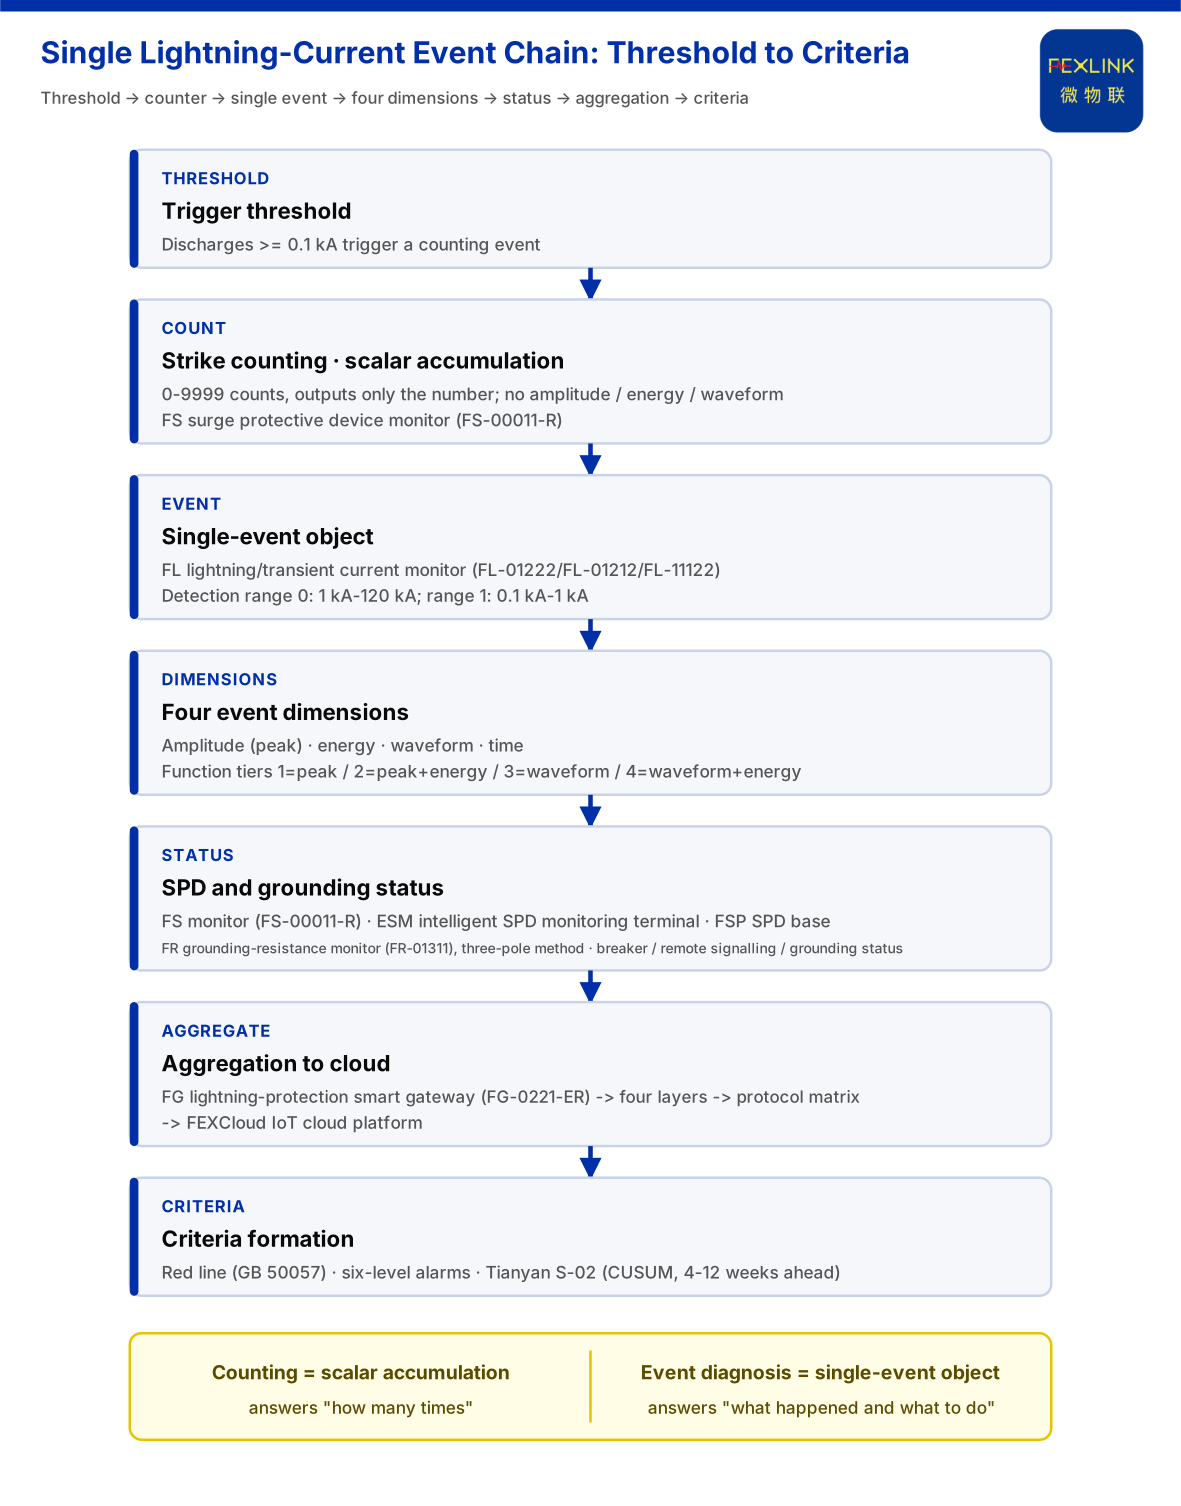
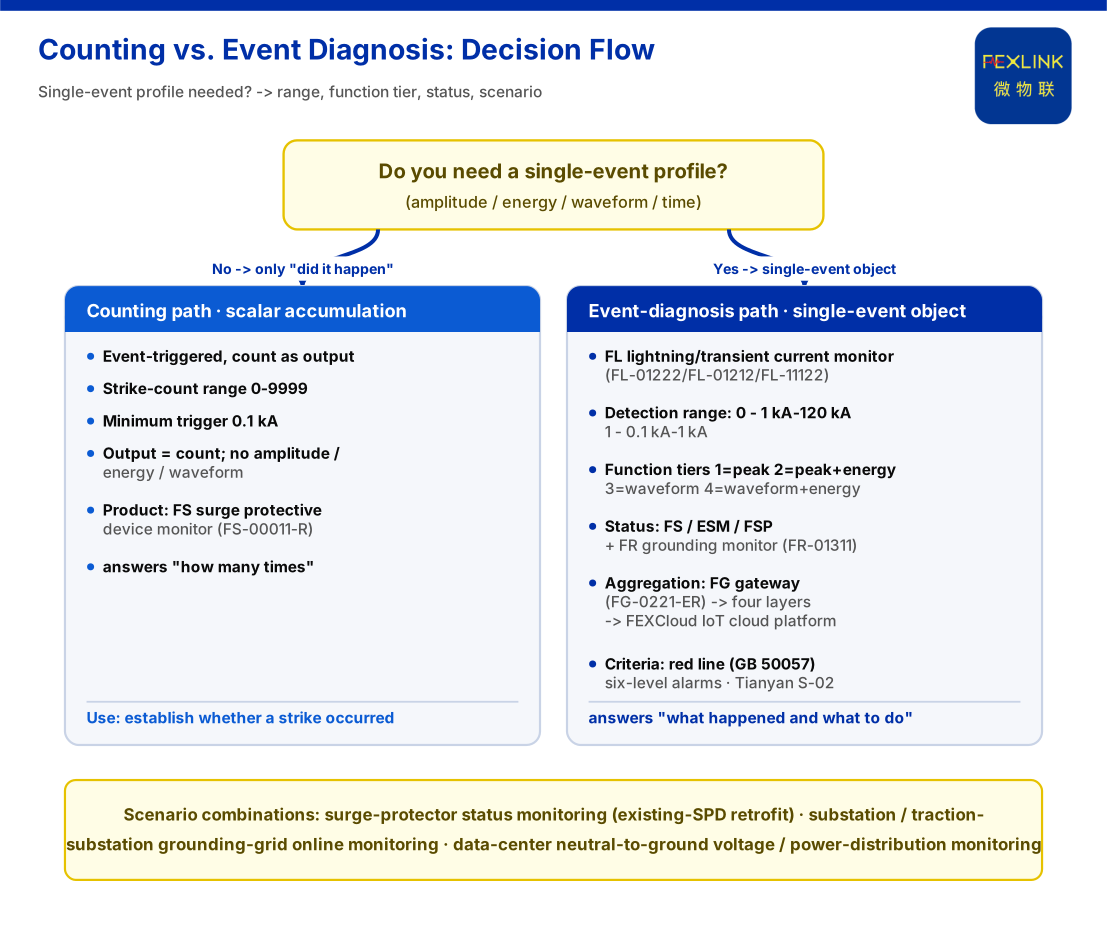
A lightning-strike counter and lightning-current event diagnosis both seem to record "how many times we were hit", but at different granularity. The counter yields an integer — "N strikes occurred here" — answering "was there an event, roughly how many". Event diagnosis yields an object-like record of one event — time, point, amplitude, energy, waveform, and SPD and grounding state — answering "what exactly happened, and does it need action". The difference is not sensor count but the data model: counting is scalar accumulation; event diagnosis is a per-event record, correlatable and analysable.
1. Two Terms: One Is a Number, One Is an Object
A lightning-strike counter is a cumulative channel: it triggers on an event but exports only a count, keeping no per-event detail. The knowledge base records the FS surge protective device monitor (e.g. FS-00011-R) with a count range of 0~9999 and a minimum trigger of 0.1 kA. Every discharge above threshold is counted, so a rising count indicates that a lightning-current event occurred, but not how strong it was.
Lightning-current event diagnosis treats each acquisition as an analysable object: at least time, amplitude (peak), energy and waveform, correlated with arrester and grounding state. The FL lightning-current/transient-current monitor (e.g. FL-01212-R) is organised around the single event; function tiers are 1 = peak, 2 = peak + energy, 3 = waveform, 4 = waveform + energy. The tiers themselves show the difference: from "one number" to "a profile of one event" is a selectable depth.
2. Where Strike Counting Comes From, and Where It Stops
Counting cheaply establishes occurrence. The FS monitor covers remote signalling, air-switch state, grounding state, lightning-strike count, leakage current, temperature, voltage and lifetime estimation; key parameters include leakage 50.0~1200.0 μA (±10 μA), voltage 0~400.0 V (±0.1 V), temperature -20~100 °C (±1 °C) and lifetime estimation 0~100%.
The chain stops at "the number of times": no amplitude, so a small disturbance just past threshold is indistinguishable from a strong strike near the top of range; no energy, so sustained injection stress cannot be expressed; no waveform, so process character cannot be judged. Critically, counting does not distinguish "this one" from "the next one" — all events compress into one growing integer, and a single event cannot be revisited. That is the gap "from counting to event diagnosis" must cross.
3. Four Dimensions Event Diagnosis Must Add
Amplitude. The FL monitor's detection range has two tiers: tier 0 is 1 kA~120 kA, tier 1 is 0.1 kA~1 kA. By model, FL-01222 (indoor) and FL-01212 (outdoor) cover 1 kA~120 kA and support energy (charge/unit energy) monitoring; FL-11122 (indoor) covers 0.1 kA~1 kA. Peak answers "how strong was this strike"; the range tier decides which point covers large and small events.
Energy. Cumulative stress comes not only from peak but from continuously injected energy; an energy-monitoring tier extends "this one" from instantaneous intensity to process dose.
Waveform. Function tiers 3 and 4 preserve waveform alongside peak/energy. Waveform characterises the event process, which counting cannot provide.
State and correlation. A single event must be read with "was the protection chain healthy at the time". State readings come from the FS monitor's air-switch state, remote signalling and grounding state; the ESM intelligent lightning-protection monitoring terminal (e.g. ESM-11312-R) with all-element monitoring including humidity, DC5V or AC220V supply and a current tier of 0.05~1.2 mA; and the FSP SPD base (e.g. FSP-21100-R) with remote signalling input, lightning-strike counting and temperature monitoring. Only by overlaying event and state can "device under stress" be separated from "grounding grid abnormal", rather than labelling one value directly.
4. Diagnosis Begins When a Single Event Meets Criteria
An event profile must still become a judgement and an action, carried by platform capability. The knowledge base defines four layers — perception, edge, platform, application; perception modules upload through edge gateways to the FEXCloud IoT cloud platform, and the application layer forms visualisation, alarms and reports. The protocol matrix gives the transport: downlink Modbus RTU (RS485), Zigbee, LoRa; uplink Modbus TCP/MQTT and optional IEC 61850 at gateway level. Lightning-protection modules aggregate through the FG intelligent lightning-protection gateway (e.g. FG-0221-ER), a protocol converter at DC12V with RS485/Zigbee downlink and Ethernet uplink. A strike can affect power and communication at once, so a missing value may be a device or link fault.
Criteria have two layers. The non-bypassable red line: lists "abnormal grounding-resistance open circuit" as under GB 50057, plus residual current ≥300 mA (GB 13955) and others. Grading and trend: the six-level alarm scheme — normal (85-100), Watch (70-84), YJ1 (55-69), YJ2 (40-54), BJ1 (20-39, act within 48 hours), BJ2 (0-19, shut down immediately); the seven-dimensional perception matrix centres on D3 trend drift and D7 outputs a 0-100 time-series risk score. The Tianyan engine's S-02 (CUSUM) detects a weak mean shift while leakage is still safe (e.g. 18 mA) and warns 4-12 weeks ahead, its basis including Arrhenius (a +10 °C rise roughly halves insulation life). The Taiyi intelligent-control hub's seven-stage pipeline (L1 ingest → L2 cleansing → L3 red-line pre-check → L4 Qianzhi analysis → L5 Wanxiang assessment → L6 fusion decision → L7 persistence) runs end to end in under 2 seconds, and an L3 red-line trigger emits the highest alarm directly.
5. What the Difference Means in Engineering
If only "did it happen" is needed, basic monitoring suffices; to answer "how strong was this one and what was its process", monitors with amplitude, energy and waveform functions are required. On the arrester side, the FSS intelligent surge protective device offers In/Imax from 10 kA/20 kA to 40 kA/80 kA and Up 1.5 kV~2.2 kV, the ESM terminal provides all-element monitoring, and the FSP base provides remote signalling and strike counting. On the grounding side, the FR grounding-resistance monitor (FR-01311) uses the three-electrode method, DC12V supply and outdoor installation, bringing grounding state online. The knowledge base adds system-level reference parameters: a 0-200 Ω monitoring unit (standard, ±1%), an intelligent gateway mounting ≥128 points, and data caching ≥15 days.
In deployment, lists "arrester state monitoring (retrofit of existing SPDs)" as a standalone combination: FS monitor / ESM all-element SPD monitoring / FSP base; grounding-grid monitoring may reference the FR monitor (one set per point) + FG gateway + FEXCloud; data-centre power-distribution monitoring may reference the ESP neutral-to-earth voltage monitor + ESA all-element smart meter + ESX intelligent edge-computing gateway. The knowledge base gives only scenario-to-product mappings, not retrofit procedures or work-quantity norms, and this article infers nothing there.
6. Boundaries: What This Article Does Not Claim
The knowledge base gives no sampling and reporting frequency, offline caching and backfill, event-record field specification, or waveform-tier (functions 3/4) production selection table; this article invents none.
Second, the indicators (electrical-hazard identification 95%+, alarm compression 80%, 4-12 weeks' warning lead, MTTR reduced 60% and others) are vendor self-reports; cite them only as vendor capability claims, never as diagnostic-effect guarantees or procurement grounds.
Third, this article claims no customer case, certification, compatibility conclusion or handling effect, invents no model, parameter or clause absent from the knowledge base, and cites only the GB 50057, GB 13955 and similar numbers listed in the knowledge base without inferring their content.
Fourth, this article answers only the general methodology question of the difference between counting and event diagnosis.
Conclusion
The difference is not "a few more numbers" but the data model: counting is scalar accumulation triggered by events and output as counts and answers only "how many times"; event diagnosis is a per-event record requiring amplitude, energy, waveform and time, correlated with SPD and grounding state, aggregated through the four-layer architecture and protocol path, held to the floor by the red line and six-level alarms, moved earlier by Tianyan S-02, and mapped to deployment through the scenarios. Counting answers "whether"; event diagnosis answers "what this one was, and what should be done".