 FEXLINK Research Institute
The short answer
EnPI (Energy Performance Indicator) is the yardstick you use to measure whether energy is being used well — for example, kWh per unit produced, rather than how many kWh the whole plant burned in a month. But many people instinctively use total energy consumption as that yardstick, and that is the mistake: total consumption has time in the denominator, so the moment output moves, the indicator stops measuring performance. Choose on three tests — traceable, attributable, sensitive — then screen with a signal-to-noise ratio of at least 3. In practice that means specific consumption or system efficiency normalized for output or weather: kWh per unit, or kWh per square metre adjusted for degree-days. Pick the wrong indicator and every savings calculation built on it stands on sand.
1. Two readings of one dataset
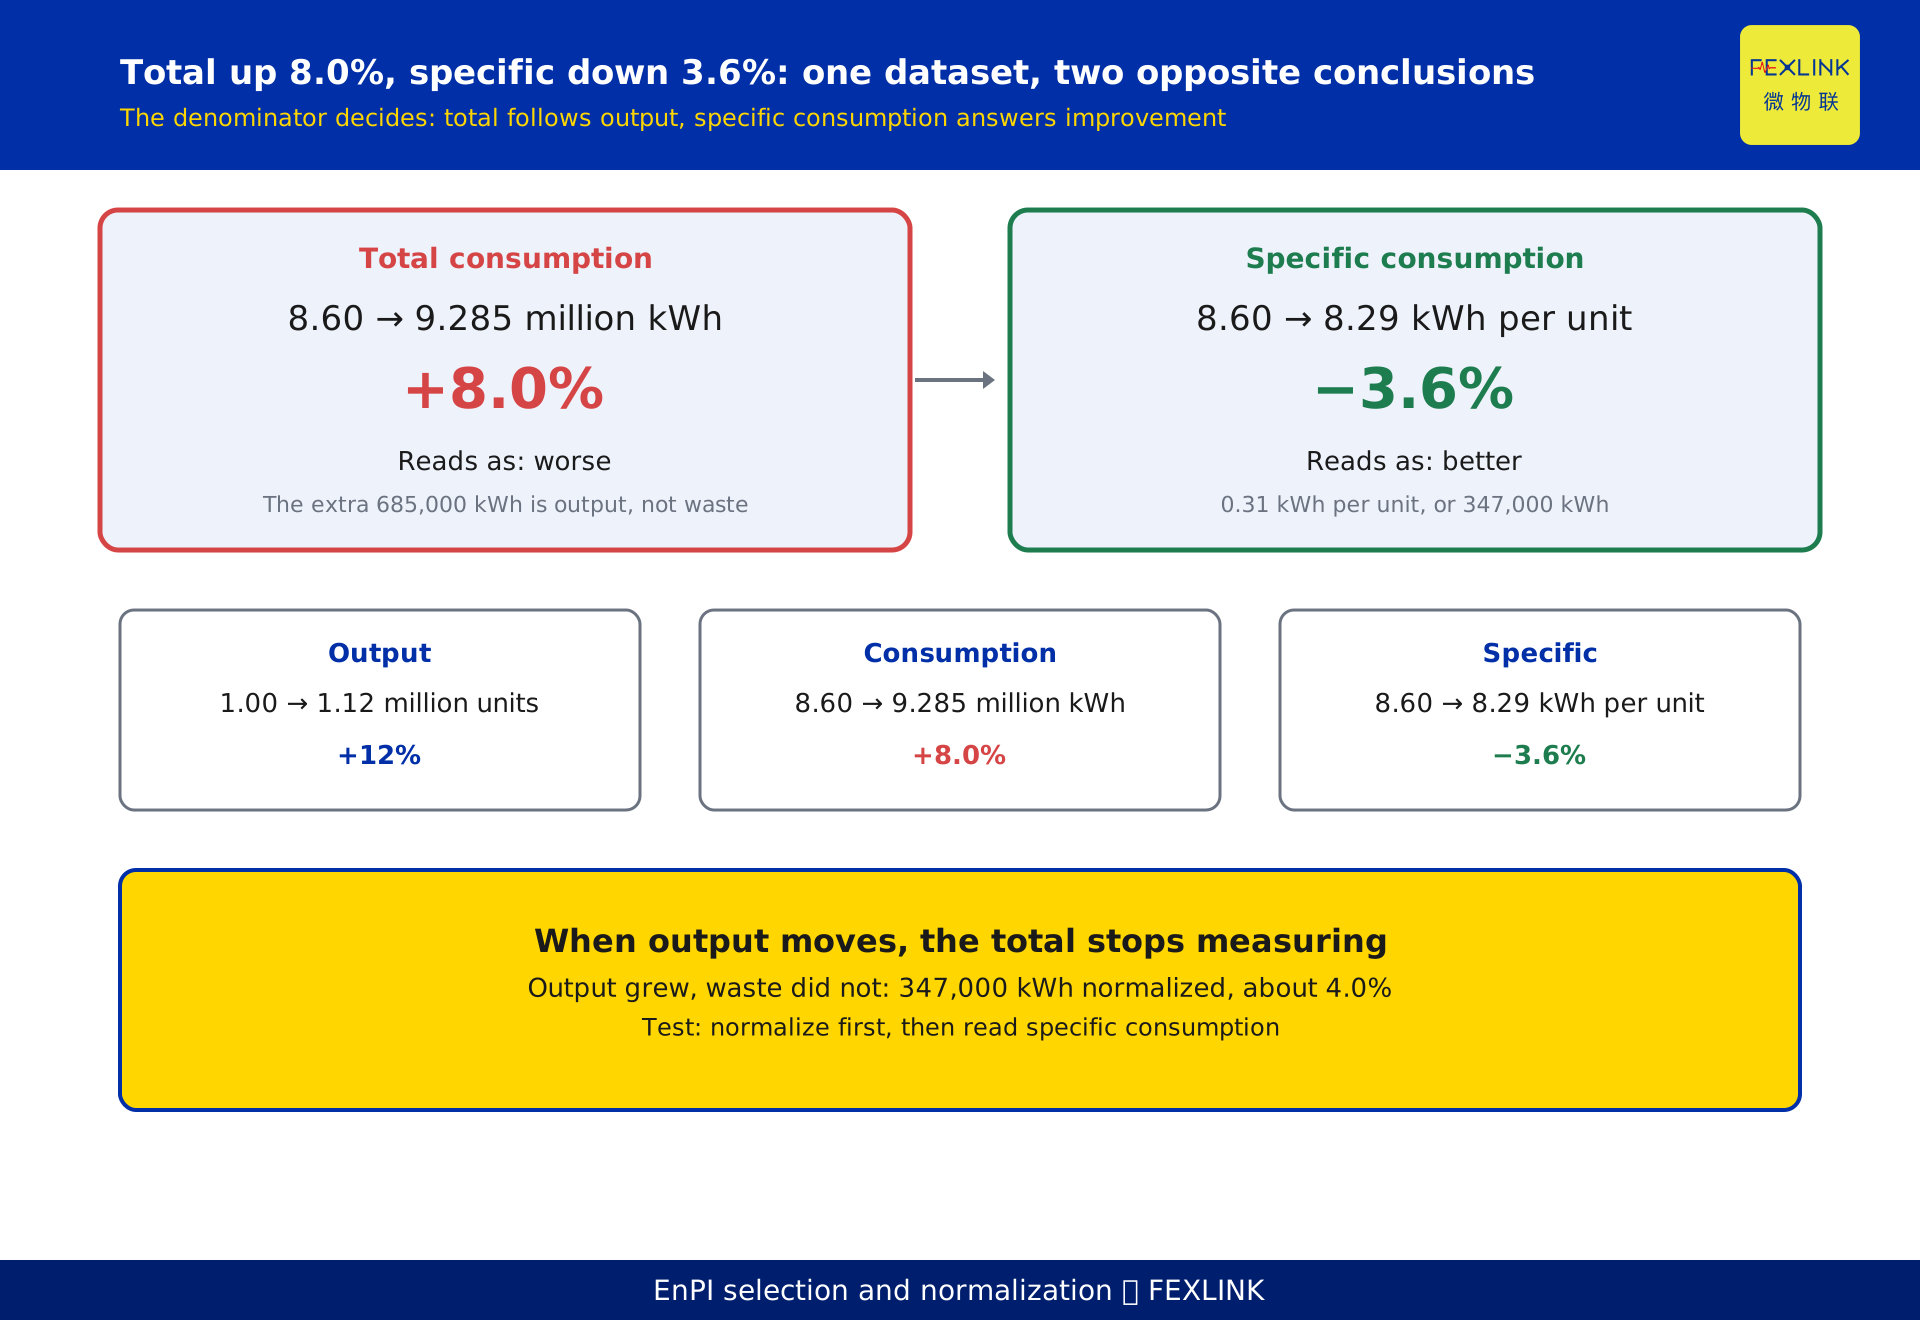
A plant, as an illustration. Baseline year of 12 months: 1.00 million units produced, 8.60 million kWh consumed, 8.60 kWh per unit. The following year: 1.12 million units, 9.285 million kWh, 8.29 kWh per unit.
Read it as total consumption: 8.60 million rising to 9.285 million, up 8.0%. It looks worse.
Read it as specific consumption: 8.60 falling to 8.29, a drop of 0.31, or 3.6%. It looks better.
Neither number is wrong. They differ in the denominator. Total consumption divides by time; specific consumption divides by output. Output rose 12%, consumption rose 8.0%, and the gap between those two figures is the efficiency gain. Multiply 0.31 by 1.12 million units and you get 347,000 kWh of normalized savings, about 4.0% of baseline consumption.
Whether an indicator can answer "did we improve" depends on whether it removes the changes nobody controls. Total consumption does not.
2. What ISO 50006 actually asks for
EnPI selection is often treated as copying rows out of a standard's annex into a manual. ISO 50006, the guidance on energy baselines and energy performance indicators, describes a chain instead.
relevant variables → normalization → EnPI → comparison against the EnB → energy performance
Identify the variables that drive consumption — output, weather, product mix, operating hours. Normalize measured consumption to comparable conditions with them. The EnPI is the resulting ratio or efficiency. The EnB is the value of that same EnPI in the baseline period. Energy performance is the comparison between the two.
The order is not negotiable. Skip the first two links and you will select indicators that merely look computable. ISO 50001 and GB/T 23331 require energy performance indicators and an energy baseline; neither prescribes which ones. That gap is where the work sits.
3. Test one: can the number be traced?
Traceable means both numerator and denominator trace back to specific metering points.
Same boundary. Consumption and the denominator — output, floor area, revenue — must cover the same scope. Plant-wide kWh divided by one workshop's output yields a number every month, which is precisely why it survives in reports.
Same granularity. A monthly indicator needs monthly consumption. Summing daily reads into a month and dividing by a work-order-based output figure puts the two on different clocks; three days of misalignment makes the ratio jump.
Enough accuracy. Meter error has to be small relative to the improvement being assessed. A class 1 meter, roughly 1% error, assessing a 3% improvement spends a third of the signal on noise before any analysis begins.
The test: can you name the meters behind the numerator and the ledger behind the denominator? If not, the indicator is not yet usable.
4. Test two: can the variance be attributed?
Attribution works at two levels.
First, the indicator's variation must decompose into a small number of drivers. Plant-wide consumption fails here: output, weather, product mix, new equipment and office load all move it at once, so any movement has five explanations, which is the same as none.
Second, at least some of those drivers must sit within the organization's influence. Output and weather do not; specific consumption per line, compressor specific power and energy per square metre do.
A management report describes what happened; an EnPI points at where to act next.
The test: after normalization, year-on-year variation of the residual should be clearly smaller than the improvement target. A large residual means an unidentified driver or an inconsistent boundary.
5. Test three: is it sensitive enough?
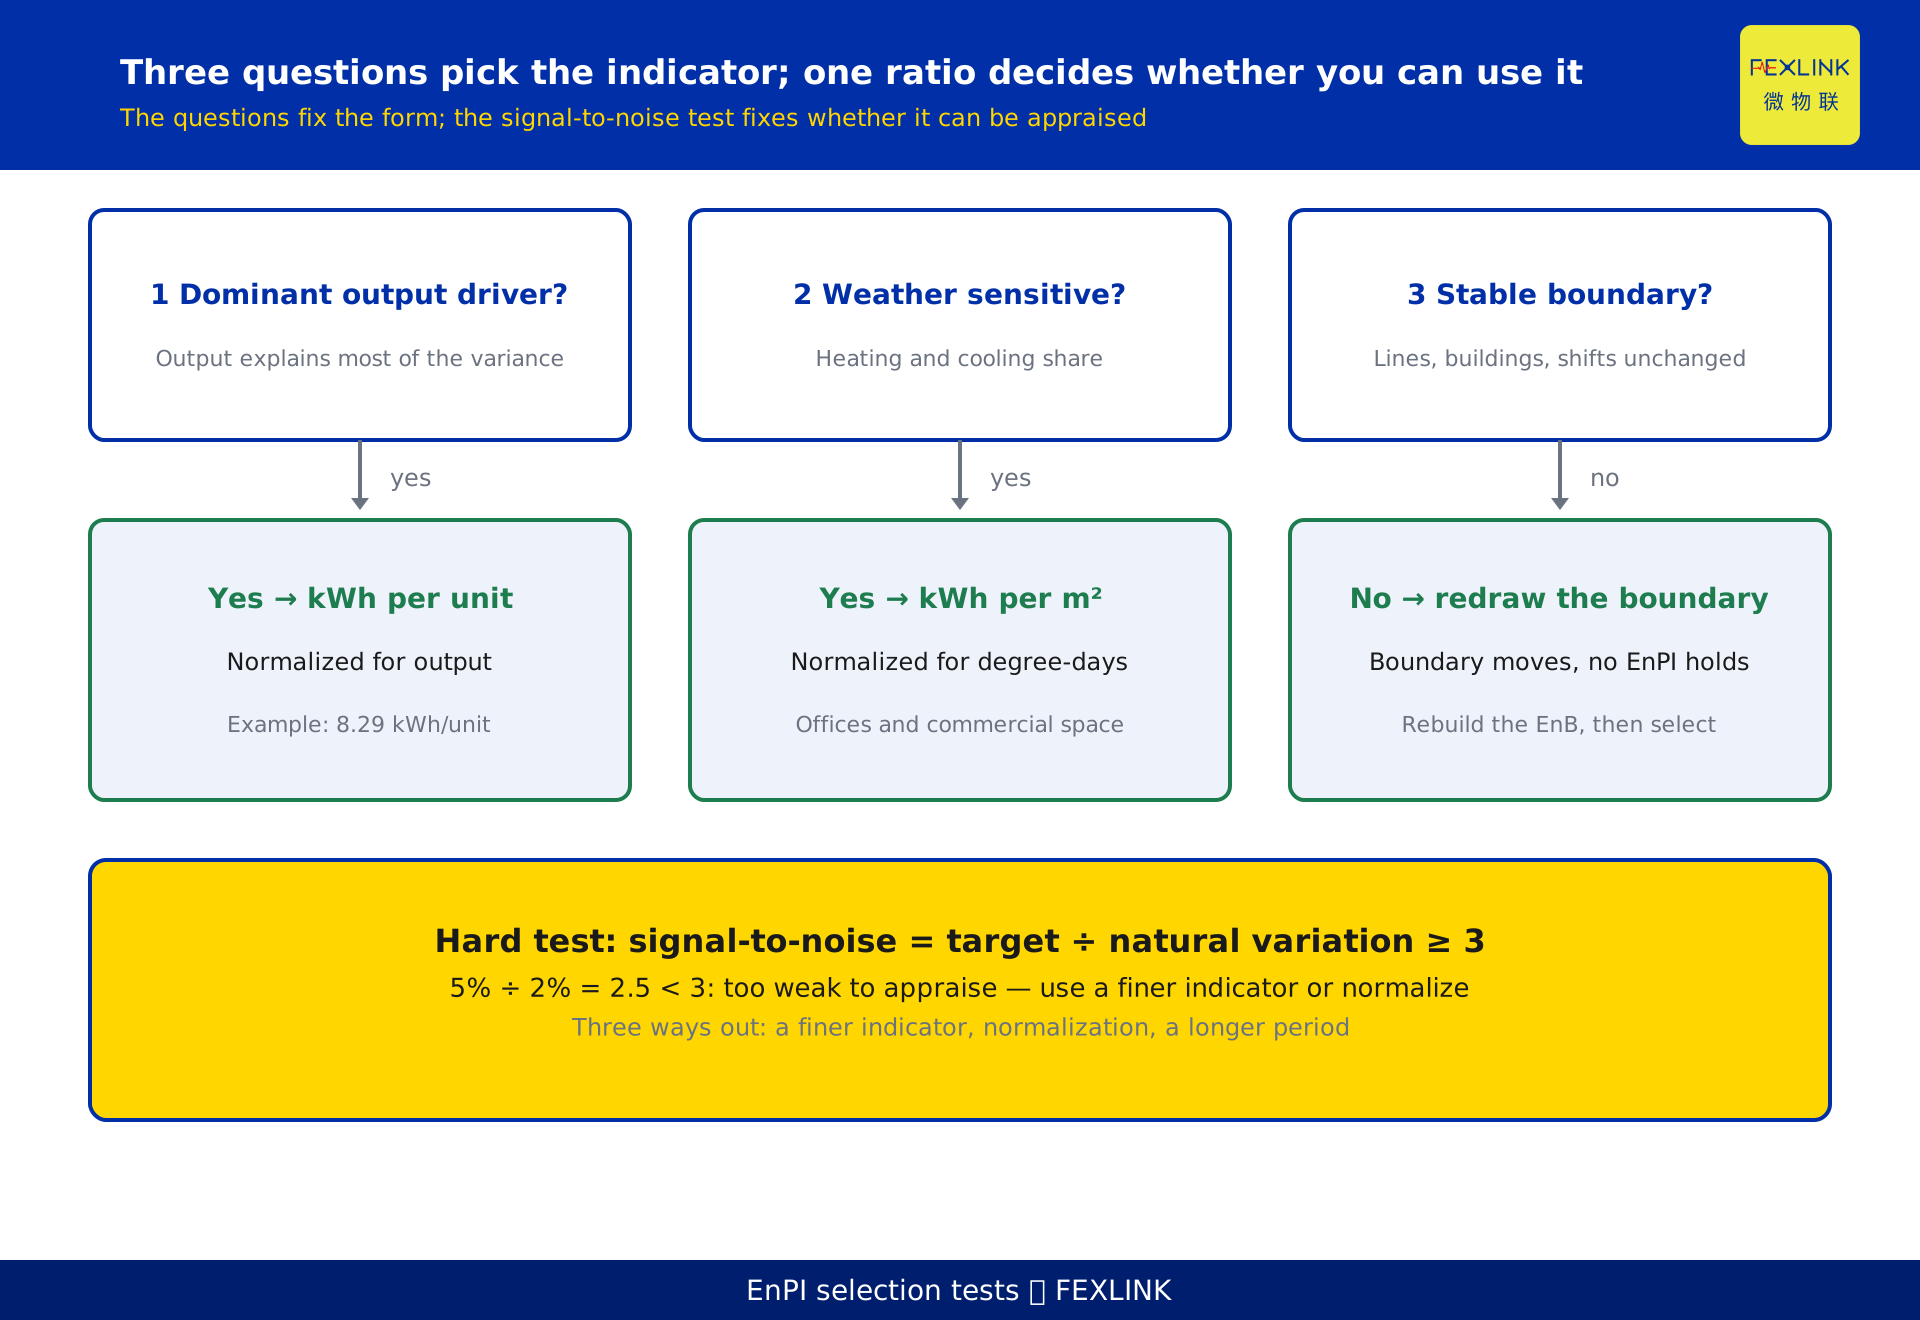
Quantify the previous test and you have a signal-to-noise ratio.
signal-to-noise = improvement target ÷ natural variation of the indicator
An example. An indicator varies ±2% year on year for ordinary reasons — mix, weather, shift patterns. The improvement target is 5%. Signal-to-noise is 5 ÷ 2 = 2.5, below 3.
A genuine 5% improvement could show up as 3%, or as 7%: improvement cannot be separated from variation. Such an indicator can track a trend; it cannot appraise performance, and it certainly cannot settle a savings claim.
Three ways out.
Use a finer indicator. Move from plant-wide specific consumption to line-level, process-level or equipment specific power. A smaller denominator carries less noise with it.
Normalize. Remove output and weather effects; whatever remains in the residual is the noise.
Lengthen the assessment period. Annual is steadier than monthly, but an exception waits a year to surface.
Why 3? Below it, the improvement signal sits inside the noise. Above it, one assessment cycle is enough to show direction. This is an engineering rule of thumb, not a mandated value: ISO 50006 requires that an EnPI reflect changes in energy performance and leaves the threshold to the organization. Set the threshold before results arrive, not after.
6. Normalization: separating output, weather and boundary
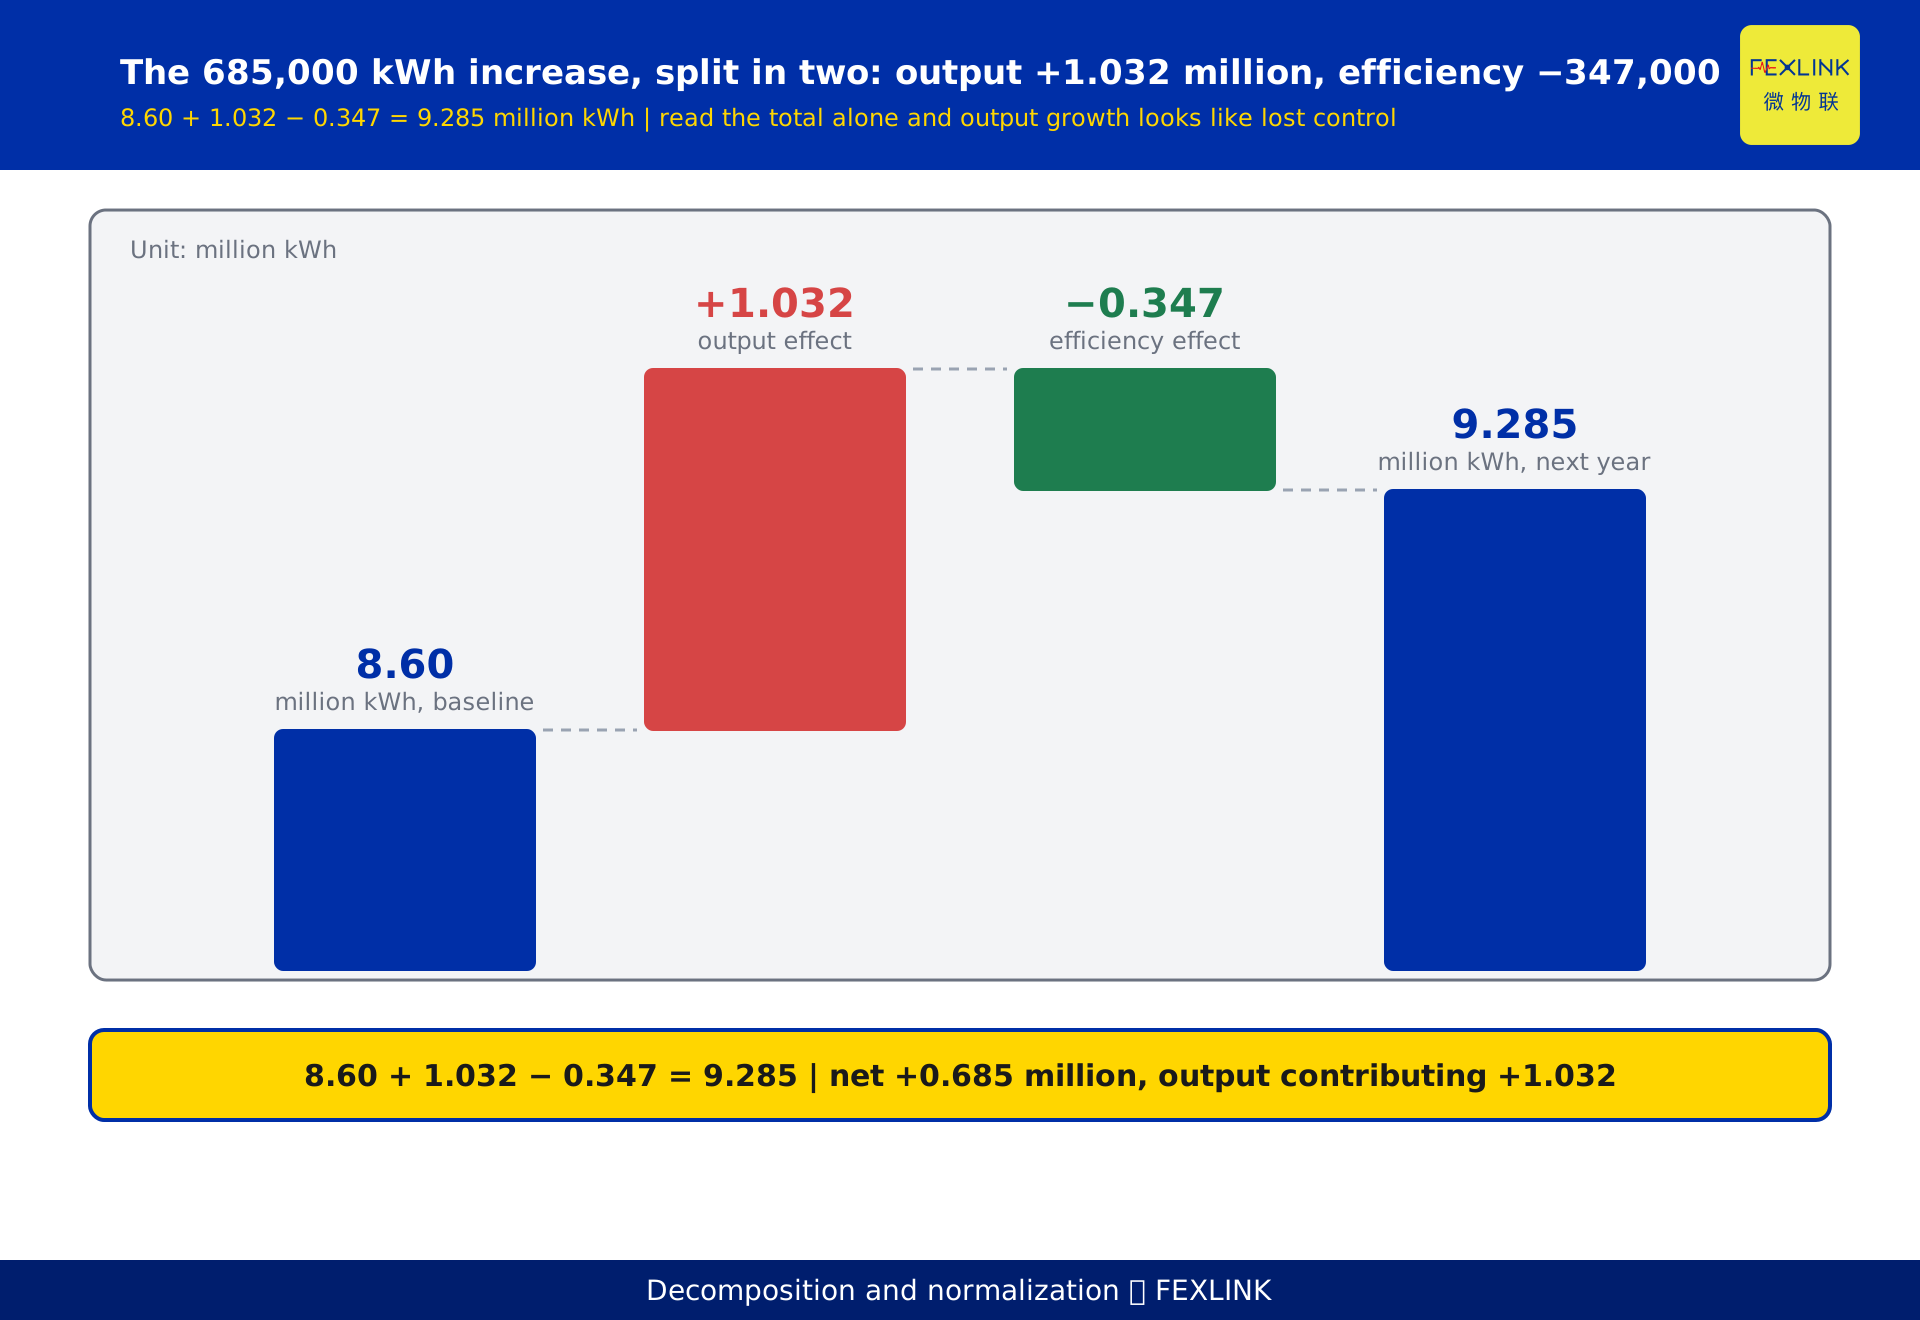
Here is the decomposition of the 685,000 kWh increase.
Baseline: 8.60 million kWh. Output rose from 1.00 million to 1.12 million units; the extra 0.12 million units at the baseline 8.60 kWh per unit account for 1.032 million kWh — the output effect. Specific consumption fell from 8.60 to 8.29; at the following year's 1.12 million units that accounts for 0.31 × 1.12 million, or 347,000 kWh — the efficiency effect. And 8.60 + 1.032 − 0.347 = 9.285 million kWh, which matches the meter.
Of the 685,000 kWh increase, +1.032 million came from output and −347,000 from efficiency. Read only the total and you will interpret output growth as loss of control, then go looking for waste that does not exist.
| Method | Fits | Requires |
|---|---|---|
| Ratio, specific consumption | Single product, stable mix | Consistent numerator and denominator boundary |
| Regression model | Multiple drivers, volatile output | At least 12 months of data, non-collinear variables |
| Degree-day normalization | Heating or cooling dominant | Continuous outdoor weather data |
Boundary changes sit outside what normalization can fix. A new line, an extension, a shift pattern going from two to three: the denominator is no longer the same denominator. That calls for a new energy baseline, not an adjusted coefficient.
7. One indicator is not enough: three tiers
No single EnPI covers a whole site. Split by management level; each tier answers a different question.
| Tier | EnPI | Normalized for | Answers |
|---|---|---|---|
| Production | kWh per unit | Output, product mix | Is this line efficient today |
| Offices and commercial | kWh per m² | Degree-days | Is this building costing more than last year |
| Management | kWh per 10,000 of revenue | Revenue, product mix | Where is company-wide efficiency heading |
Mix the tiers and they contradict each other. When output falls, specific consumption can rise because equipment runs at low load, while energy per unit of revenue falls because high-margin products now dominate the mix. Same company, same quarter, opposite conclusions — and the meeting becomes an argument about whose number is right.
One rule: within a tier, use one set of indicators; across tiers, aggregate only, never compare.
8. EnPI and EnB travel together
The EnPI is the ruler; the EnB is the zero mark on it.
Cover a full production cycle. Twelve months, peak and trough included. Shutdown months are handled separately or carried as a model variable, never quietly dropped.
Same boundary, same normalizing variables. The baseline's numerator and denominator must match the assessment period exactly, or the difference you compute contains a definitional gap.
Rebuild the EnB when the boundary or process changes materially — and also when the indicator itself changes. The second half is the one people skip. Swap plant-wide specific consumption for line-level specific consumption, keep the old baseline, and the first year reports 15% savings. That is not a saving. That is a changed definition.
9. A starting list
More indicators is not better. Start with three to five.
| EnPI | Unit | Normalized for | Data source | Review |
|---|---|---|---|---|
| Specific electricity per unit | kWh/unit | Output, mix | Line meters + production ledger | Monthly |
| Energy per floor area | kWh/m² | Degree-days | Floor or zone meters + weather | Monthly |
| Energy per revenue | kWh per 10,000 | Revenue | Main meter + finance | Quarterly |
| Compressor specific power | kWh/m³ | Air volume, discharge pressure | Compressor room meters + flow meter | Weekly |
| Chiller plant efficiency | kWh/kWh cooling | Cooling load, outdoor conditions | Chiller meters + BTU meter | Daily |
Sensitivity rises as you go down: plant-wide specific consumption often sits near a signal-to-noise of 2, while compressor specific power can double that for the same improvement, because unrelated load has been stripped out. Cost rises too: every indicator needs meters, a denominator source and a named owner, and sets rolled out too wide in year one die quietly in year two.
10. If the indicator cannot be computed, check where the meter sits
Feasibility is a metering question, not an algorithm question. Two common misplacements.
Main meter only. Plant-wide specific consumption is computable; line-level is not. The indicator stays at the coarsest tier, where output moves it.
Sub-meters on the workshop feeder, output counted by work order. The numerator is cut on the meter-reading cycle, the denominator on the work-order cycle. The boundaries disagree, specific consumption swings, and it looks like an equipment problem.
Circuit-level metering with the ESA all-element smart meter — for example ESA-22131-R, 3×400A, 3×220/380V, RS485 Modbus — installed per line and per major load puts numerator and denominator on the same boundary. The series does not include phase or harmonic monitoring; where phase monitoring is needed, the ESB three-phase imbalance monitor applies, and where harmonics are needed, the ESE power quality monitor.
Above the meters, the digital electrical supervision system aggregates consumption by circuit and aligns output by shift and work order, so the EnPI can be computed at a granularity worth assessing. Sites that also manage carbon can run the 4×3×2 energy-carbon autonomy framework on the same definitions, so energy and emissions do not become two sets of books.
FAQ
Q: Can we just use total consumption as the EnPI?
Yes, but it answers "how much was used", not "how well". It suits budget control, not performance assessment. If output varies less than 2% a year and the mix is stable, the two tell the same story. Otherwise, normalize first.
Q: Output swings a lot. Does that rule out specific consumption?
No, but it needs an output band. Beyond roughly 20% away from the baseline range, load-factor changes alone will move specific consumption, and the deviation cannot be credited to improvement. Band the baseline by output and assign each month to its band before comparing.
Q: Are more EnPIs better?
No. Each one needs metering, a normalizing variable and an owner. Past five, with nobody maintaining them, the set degrades into a table nobody reads by the second year. Start with three to five, get the signal-to-noise above the threshold, then split further.
Q: What if the signal-to-noise ratio cannot reach 3?
Three options: a finer indicator, normalization to cut noise, or a longer assessment period. If none works, that tier is not ready for assessment — observe it, do not appraise it, and bring it in once metering catches up. Writing a signal-to-noise of 2 into a scorecard guarantees a year-end argument about numbers.
Q: We changed the EnPI. What happens to the history?
Convert over an overlap period. Compute old and new indicators side by side for six to twelve overlapping months and establish the conversion. If no conversion holds, rebuild the baseline and record the reason and date.
Scope and limitations
- The method here applies to industrial and commercial energy users establishing or operating an energy management system, following the framework of ISO 50001, GB/T 23331 and ISO 50006.
- A signal-to-noise ratio of at least 3 is an engineering rule of thumb proposed in this article. ISO 50006 requires an EnPI to reflect changes in energy performance but sets no threshold; organizations should set one from their own data length and variability, and record it.
- The figures 1.00 million units and 8.60 million kWh rising to 1.12 million units and 9.285 million kWh, with the 1.032 million, 347,000 and 685,000 kWh decomposition, are constructed to illustrate normalization and do not represent any real customer.
- The applicability conditions for the three normalization methods are generalizations; real projects need model checks on data length, collinearity and boundary stability.
- Model numbers and specifications for the ESA all-element smart meter, ESB three-phase imbalance monitor and ESE power quality monitor are subject to the latest product knowledge base. This article is not a procurement recommendation.
- Standard numbers cited are current as of writing; if a standard is revised, the related statements need rechecking.
Frequently Asked Questions
Can we just use total consumption as the EnPI?
Yes, but it answers "how much was used", not "how well". It suits budget control, not performance assessment. If output varies less than 2% a year and the mix is stable, the two tell the same story. Otherwise, normalize first.
Output swings a lot. Does that rule out specific consumption?
No, but it needs an output band. Beyond roughly 20% away from the baseline range, load-factor changes alone will move specific consumption, and the deviation cannot be credited to improvement. Band the baseline by output and assign each month to its band before comparing.
Are more EnPIs better?
No. Each one needs metering, a normalizing variable and an owner. Past five, with nobody maintaining them, the set degrades into a table nobody reads by the second year. Start with three to five, get the signal-to-noise above the threshold, then split further.
What if the signal-to-noise ratio cannot reach 3?
Three options: a finer indicator, normalization to cut noise, or a longer assessment period. If none works, that tier is not ready for assessment — observe it, do not appraise it, and bring it in once metering catches up. Writing a signal-to-noise of 2 into a scorecard guarantees a year-end argument about numbers.
We changed the EnPI. What happens to the history?
Convert over an overlap period. Compute old and new indicators side by side for six to twelve overlapping months and establish the conversion. If no conversion holds, rebuild the baseline and record the reason and date.