 FEXLINK Research Institute
Direct Answer
How is the "adjusted energy consumption" in reports calculated? Adjusted energy consumption is the energy normalized to the reference operating condition (for example, reference production output and reference temperature), equal to converting the actual condition back to the reference condition with the baseline model; the normalization factor is given by the baseline regression equation, not by subjective selection.
A scenario: A factory report shows "adjusted energy consumption" — hard to understand and hard to explain — the supervising department or a customer asks and nobody can explain. The logic is that adjusted energy consumption converts the actual energy back to the reference condition — the baseline model calculates it and the factors come from the regression equation — not a guess but a reproducible basis.
1. The Difference between Adjusted Energy Consumption and Actual Energy Consumption
Actual energy consumption — measured value: the energy actually consumed in the month, following the operating condition; Adjusted energy consumption — converted value: the energy normalized to the reference condition, comparable across periods; The meaning of the difference — comparability: actual energy follows production and temperature, while adjusted energy removes those effects; The usage scenario — assessment and comparison: energy-saving assessment and period comparison use adjusted energy.
In one sentence: actual energy is measured and adjusted energy is converted — one follows the condition and the other removes the condition — use adjusted energy in assessment — distinguish first, then compare.
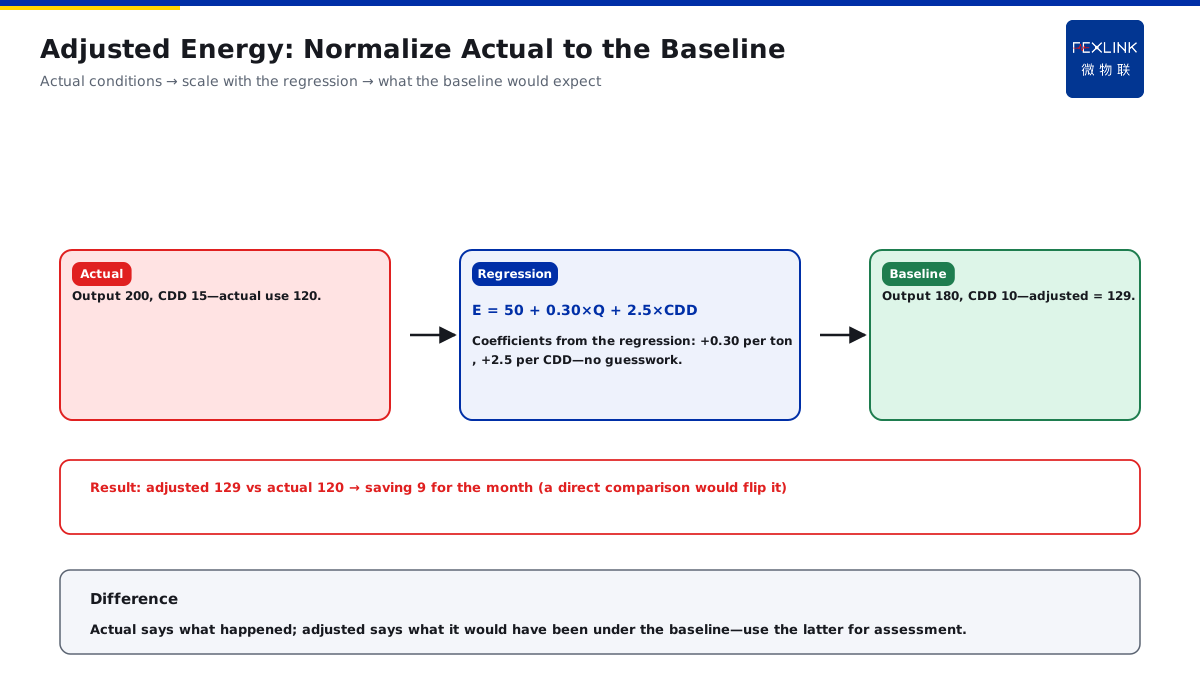
A calculation example of adjusted energy — regression model E = 50 + 0.30 x production + 2.5 x CDD — in one month the actual production is 200 ten-thousand tons and CDD is 15, with actual energy 120 ten-thousand kWh — the reference production is 180 ten-thousand tons and reference CDD is 10 — adjusted energy = 50 + 0.30 x 180 + 2.5 x 10 = 129 ten-thousand kWh — compared with the actual 120, the month saves 9 ten-thousand kWh.
An example: A factory compares two months: January has low production and low energy; February has high production and high energy — a direct energy comparison makes January look "more energy-saving" — after converting by the reference production, the two months are comparable and the conclusion reverses. The logic is that actual energy answers "what happened" and adjusted energy answers "what it would be if the condition were the same" — assessment needs the latter — adjusted energy removes the effects of production and temperature, so the saving result is comparable.
2. How to Set the Reference Operating Condition for Normalization
Reference production — usually a fixed value: design capacity or the three-year average production; Reference temperature — usually a fixed value: the multi-year average temperature or standard degree days; Reference shifts — usually a fixed value: the standard shift structure; The use of the reference — a unified basis: every month is converted to the same reference for comparison.
In one sentence: the reference condition is reference production, reference temperature and reference shifts — every month converts to the same reference — once the scale is set, do not change it casually.
The comparison table of reference elements:
| Reference element | Common value | Description |
|---|---|---|
| Reference production | Design capacity / three-year average | Normalizes the production effect |
| Reference temperature | Multi-year average degree days | Normalizes the heating/cooling load |
| Reference shifts | Standard shift structure | Normalizes the running hours |
An example: A factory sets the reference: reference production takes the three-year average of 180 ten-thousand tons per month, reference temperature takes the multi-year average degree days and reference shifts take the standard two-shift system — every month converts to that reference. The logic is that the reference condition is the "zero point of the ruler" — every month converts to the same reference, so cross-month and cross-year comparison works — take the design capacity or historical average, and keep it stable once set instead of changing it casually.
3. The Normalization Factor Comes from the Regression Model, Not from a Guess
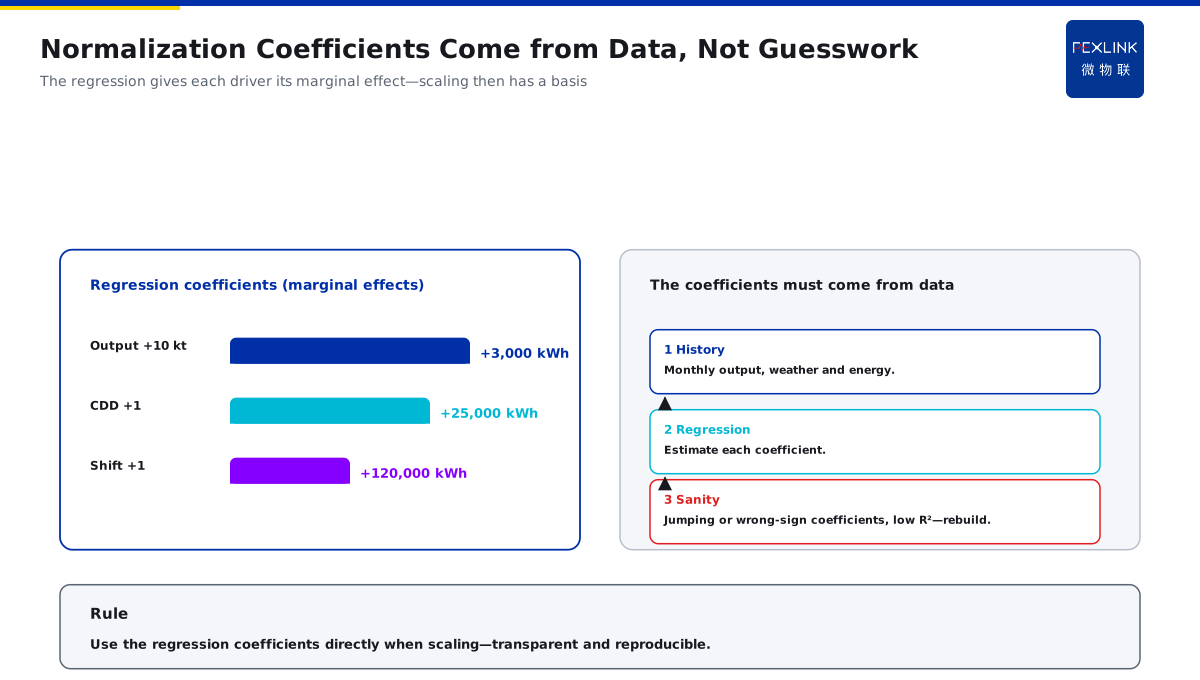
The source of the factor — the regression equation: the normalization factor is the variable coefficient in the regression equation; The meaning of the factor — marginal effect: how much energy each unit of production and each degree day affects; The role of the factor — a conversion tool: how much the actual condition deviates from the reference is converted by the factor; The forbidden practice — subjective selection: the factor cannot be guessed from experience but must be supported by data.
In one sentence: the normalization factor is the variable coefficient of the regression equation — the marginal effect of each unit of production and each degree day — calculated from data, not guessed, with a transparent basis.
The signals of an unreliable factor — a large change in the factor: the factor jumps clearly when the data period changes; an abnormal sign: it should be positively related in theory but is negative; a low R²: the model explains little and the factor is unstable — when any signal appears, go back to the modeling stage.
An example: A factory calculates the factor: the regression gives E = 50 + 0.30 x production + 2.5 x CDD — 0.30 and 2.5 are the normalization factors — however much the actual condition deviates from the reference is converted by the factors, a reproducible basis. The logic is that the factor must come from data — the regression quantifies "how much energy each extra ton of production adds" — the conversion directly uses the equation factors, a transparent and re-checkable basis — guessing factors makes the report unexplainable.
4. Normalization by Unit Consumption and Normalization by Total Volume
Unit-consumption normalization — divided by production: unit product energy is itself normalized by production; Total-volume normalization — condition conversion: the total energy is converted by the reference condition; The use of the two — unit consumption shows efficiency: used for horizontal comparison of equipment efficiency; Total volume shows scale — the adjusted total: used for the overall energy-saving assessment.
In one sentence: unit-consumption normalization divides by production to show efficiency, and total-volume normalization converts the condition for assessment — different uses and different bases — label both clearly.
The selection principles of the two bases — workshop comparison: prefer unit consumption (remove production and look at unit efficiency); overall assessment: use the adjusted total (convert temperature and shifts too); cross-period comparison: fix the same reference and the same model; report presentation: list both bases side by side with definitions.
An example: A factory uses two bases: unit consumption (kWh/ton) for workshop comparison, which removes production to show efficiency; and the adjusted total for the annual energy-saving assessment, which converts temperature and shifts as well. The logic is that unit consumption naturally normalizes production — unit product energy is directly comparable — the total must also convert temperature and shifts — mark both bases in the report and do not mix them.
5. How to Disclose the Assumptions and Factors in the Report
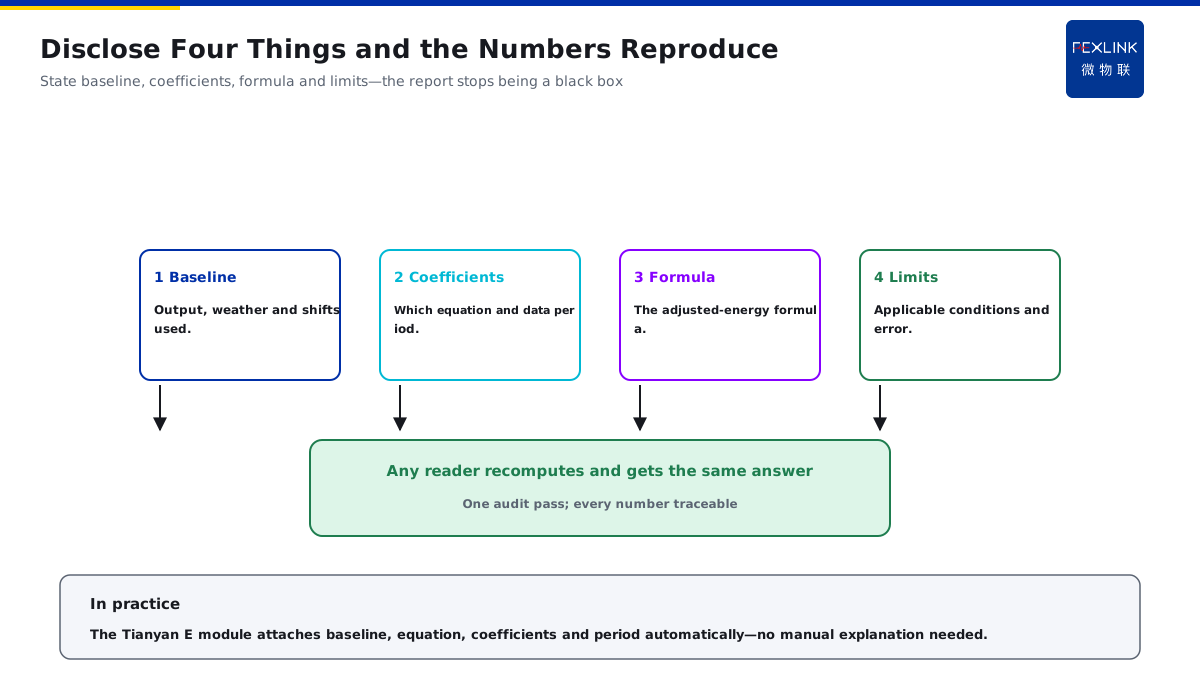
Disclosure one, the reference condition — state the reference: what values the reference production, temperature and shifts take; Disclosure two, the factor source — state the model: which regression equation the factors come from and the data period; Disclosure three, the basis — state the formula: the calculation formula of the adjusted energy; Disclosure four, the limits — state the boundary: the applicable condition range and the error range of the model.
In one sentence: the report discloses the reference condition, the factor source, the calculation basis and the boundary — the numbers are reproducible and the assumptions are visible.
The template structure of the disclosure — a table: the reference-condition table (production/temperature/shift values); a formula paragraph: the adjusted-energy calculation formula; a note: the regression equation, data period and R²; the boundary: the applicable range and error description.
An example: A factory report attaches the reference-condition table, regression equation, factors and data period — the supervising department reviews and passes it in one round. The logic is that the credibility of a report comes from being "reproducible" — the reference condition, factor source and formula are all written clearly — any reader can recalculate — with complete disclosure, adjusted energy is no black box — when the supervising department asks, the formula explains it.
Back to the TIANYAN product match — the TIANYAN engine E module (energy analysis) automatically attaches the reference condition, regression equation, normalization factor and data period in reports — every adjusted-energy number is traceable and reproducible — report compilers do not need to explain the basis themselves.
Adjusted energy consumption is the number that converts the actual energy back to the reference condition — the reference production and temperature set the scale, and the regression equation gives the factors — the factors come from data, not from a guess — the report discloses the reference, factors, formula and boundary — reproducible numbers make the saving result credible.
Scope and Limitations
- The conclusions in this article are intended for LV distribution and electrical-safety sites. Standard numbers (GB/T 13234) refer to their currently effective editions, and product parameters follow the latest FEXLINK selection handbook and product knowledge base.
- Quantitative criteria (protection zone, discharge and residual voltage, earth resistance, thresholds and grading) hold under the preconditions stated in this article. Where the site voltage level, earthing arrangement, environmental category or load profile differs, the figures must be recalculated. Specific configurations involving Tianyan engine, E track (energy analytics) should be verified against actual circuit parameters.
- Specific product models and parameters are subject to the latest selection handbook and product knowledge base; this article does not constitute selection or procurement advice.
- Standard numbers cited here refer to the currently effective editions; when a standard is revised, the related quantitative conclusions must be re-checked.
- Deployment and implementation for specific projects must be carried out by qualified engineers based on site survey and design drawings.
Frequently Asked Questions
How Is the "Adjusted Energy Consumption" in Reports Calculated? What Normalization Factor Should You Use?
Adjusted energy consumption is the energy normalized to the reference operating condition (for example, reference production output and reference temperature), equal to converting the actual condition back to the reference condition with the baseline model; the normalization factor is given by the baseline regression equation, not by subjective selection.