 FEXLINK Research Institute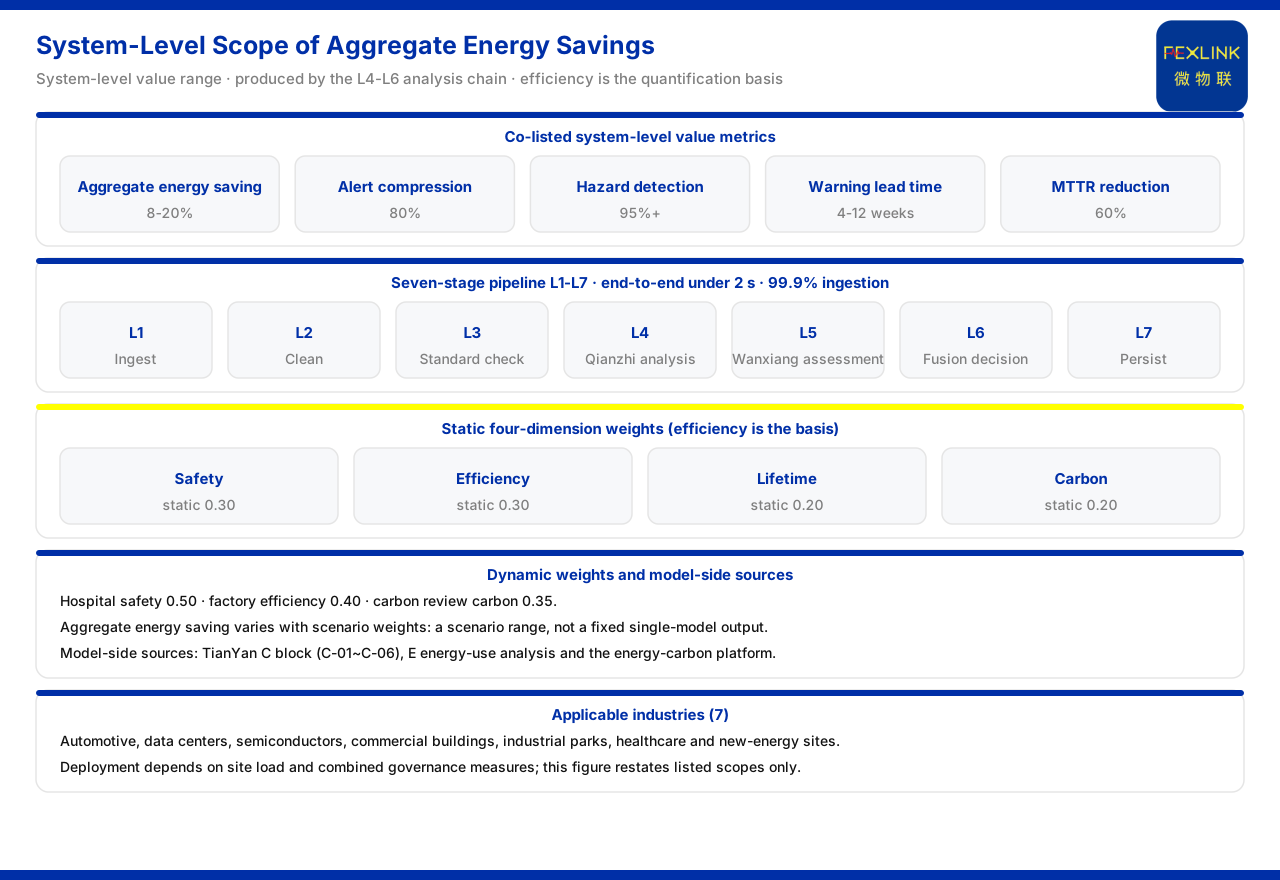
Direct answer
The product knowledge base places the comprehensive energy-saving potential of the Taiyi intelligent control hub system (V2.0) in a range of 8% to 20%. It should be stated first that this range is one of the system-level quantified value indicators, produced within the analysis-and-assessment chain of the seven-stage pipeline, and not the fixed output of any single model. Alongside it stand indicators such as an 80% alarm compression ratio, an electrical-hazard identification rate of 95% or above, an early-warning lead time of 4 to 12 weeks, and a 60% reduction in mean time to repair. Its assessment framework is based on the efficiency dimension of the four-dimensional impact assessment (a static weight of 0.30), and its model-side sources are the C energy-saving measures block and the E energy-use analysis block of the Tianyan engine. There are 7 applicable industries; actual deployment must combine on-site load with the mix of governance measures, and this article only restates the specifications listed in the knowledge base.
Why the 8% to 20% figure is system-level
Reading the 8% to 20% range as "a model that can save this much electricity" is a common misreading. The knowledge base places it in the quantified value indicator table of the Taiyi intelligent control hub system V2.0, next to the alarm compression ratio, the identification rate and the early-warning lead time, which shows that its identity is a system-level value range measuring the combined effect of the whole hub in a class of scenarios. System-level means it is formed by several stages acting together: ingestion and cleansing decide data quality, standard validation provides constraints, and analysis, assessment and fusion decision decide the conclusion; the absence of any stage affects the final result. It is therefore not the output of a single-point model, nor can it be read directly from one model's parameters. The correct use for a reader is to understand 8% to 20% as a scenario-oriented value range, not as a fixed promise for any site or any load.
The quantified value indicators it sits beside
To understand the position of the 8% to 20% range, one can look at the other indicators listed in the same table. In the Taiyi quantified value indicators the knowledge base lists an 80% alarm compression ratio, an electrical-hazard identification rate of 95% or above, an early-warning lead time of 4 to 12 weeks, and a 60% reduction in mean time to repair. These specifications cover different dimensions: the compression ratio and the identification rate describe the convergence and discovery ability of assessment, the lead time describes the ability to act ahead in time, and the reduction in mean time to repair describes handling efficiency. That the comprehensive energy-saving potential sits beside them shows that, like them, it is one facet of the whole system at the value level, not a single-point function independent of the system. Only by reading the group together does the system character of the energy-saving potential become clear.
Which stage produces the energy-saving conclusion: the seven-stage pipeline
The seven-stage pipeline given by the knowledge base is: stage one ingestion, stage two cleansing, stage three standard validation (with the safety red line placed in front), stage four Qianzhi analysis, stage five Wanxiang assessment, stage six fusion decision, and stage seven persistence. This chain has an end-to-end latency of less than 2 seconds and a data-ingestion success rate of 99.9%. The energy-saving-related conclusion is produced by the analysis-and-assessment chain from stage four to stage six: stage four completes the analysis, stage five completes the assessment, and stage six forms a fusion decision by weighting the analysis result with the assessment result. Comparing this order with the foregoing shows why the comprehensive energy-saving potential is a system-level indicator: it needs data after cleansing and validation, then analysis and assessment, and finally a conclusion formed in the fusion decision; each stage is the input of the next, and no jump holds.
The quantification framework: four-dimensional impact assessment
That the comprehensive energy-saving potential can be quantified rests on an assessment framework. The knowledge base records that the static weights of the four-dimensional impact assessment are safety 0.30, efficiency 0.30, lifetime 0.20 and carbon emission 0.20; in specific scenarios dynamic weights are enabled, with examples being safety 0.50 in the hospital scenario, efficiency 0.40 in the factory scenario and carbon emission 0.35 in the carbon-assessment scenario. The efficiency dimension is precisely the framework basis that lets the comprehensive energy-saving potential be quantified: the energy-saving effect must be measured within the value class of efficiency, not as an isolated number. The dynamic weights show that the same framework shifts its emphasis in different scenarios; this means the deployed result of the comprehensive energy-saving potential changes with the scenario weights, further confirming that it is a system-level, scenario-based range rather than the fixed output of one model.
Model-side sources: the C energy-saving measures and E energy analysis
On the model side, the capability sources of the comprehensive energy-saving potential fall on the Tianyan engine V2.0. The knowledge base records that Tianyan is planned by the four blocks S, Q, E and C, where C is the energy-saving measures block, planned as 10 models with a document scope of 6, and whose first P0 model is C-01 reactive-power compensation optimisation; E is the energy-use analysis block, planned as 15, with a documented scope of 9 and a P0 first release of E-01. In other words, energy-saving measures and energy-use analysis support the comprehensive energy-saving potential from the two ends of "giving a measure" and "analysing energy use". It should be distinguished that these blocks and models are capability sources, while the 8% to 20% range is a system-level value range; the two are at different levels, and a single model within a block cannot be equated directly with the final value.
Selection combination, applicable industries and deployment boundary
In the product selection and AI capability comparison, the knowledge base expresses the "energy saving and carbon management" combination as the Tianyan C block (C-01 to C-06), E-09 carbon accounting and the smart energy-carbon IoT platform. This shows that the energy-saving quantification ultimately falls on the C-block measure models together with the carbon-management combination, rather than on a single model. As for applicable industries, the comprehensive energy-saving potential addresses the 7 applicable industries of Taiyi V2.0: automotive manufacturing, data centres, semiconductors, commercial buildings, industrial parks, medical institutions and new-energy stations. It should be stressed that 8% to 20% is a value range oriented to the system-level scenarios above and must be deployed in combination with on-site load and governance measures; this article makes no numerical inference for unlisted scenarios or specific projects.
Checking sequence when applying 8% to 20% on site
Setting this out as a sequence makes item-by-item checking easier. First, confirm that the object is one of the applicable industries of the Taiyi intelligent control hub system V2.0. Second, establish that 8% to 20% is a system-level value range and not the fixed output of a single model. Third, check the weights the four-dimensional impact assessment adopts in that scenario, and understand how the efficiency dimension participates in quantification. Fourth, confirm the reachable scope of the Tianyan C energy-saving measures and E energy-use analysis at the current delivery stage. Fifth, according to the energy-saving and carbon-management combination, bring the C-block measures, E-09 carbon accounting and the smart energy-carbon IoT platform into the plan together. This sequence separates "recognise the indicator, see the framework, check the models, fix the combination", so that each step uses its own specification and the value range is not confused with model capability. The checked result should be confirmed together with on-site load and governance measures; this article does not replace on-site verification.
Applicability and limits
First, the content of this article is limited to the product knowledge base's existing statements about the quantified value indicators, the seven-stage pipeline, the four-dimensional impact assessment, the Tianyan engine blocks and the selection combinations of the Taiyi intelligent control hub system V2.0.
Second, the comprehensive energy-saving potential of 8% to 20% is a system-level value range listed in the knowledge base; this article does not interpret it as a single-model output, nor does it constitute a promise about the energy-saving result of a specific project.
Third, the 80% alarm compression ratio, the electrical-hazard identification rate of 95% or above, the early-warning lead time of 4 to 12 weeks and the 60% reduction in mean time to repair are all restated according to the specifications listed in the knowledge base.
Fourth, the static and dynamic weight examples of the four-dimensional impact assessment and the model-count specifications of the Tianyan C block and E energy-use analysis are limited to the knowledge base; this article does not infer unlisted details.
Fifth, the 7 applicable industries follow the knowledge base; actual deployment must be confirmed item by item together with on-site load and governance measures, and this article provides no project-level conclusion.