 FEXLINK Research Institute
The short answer
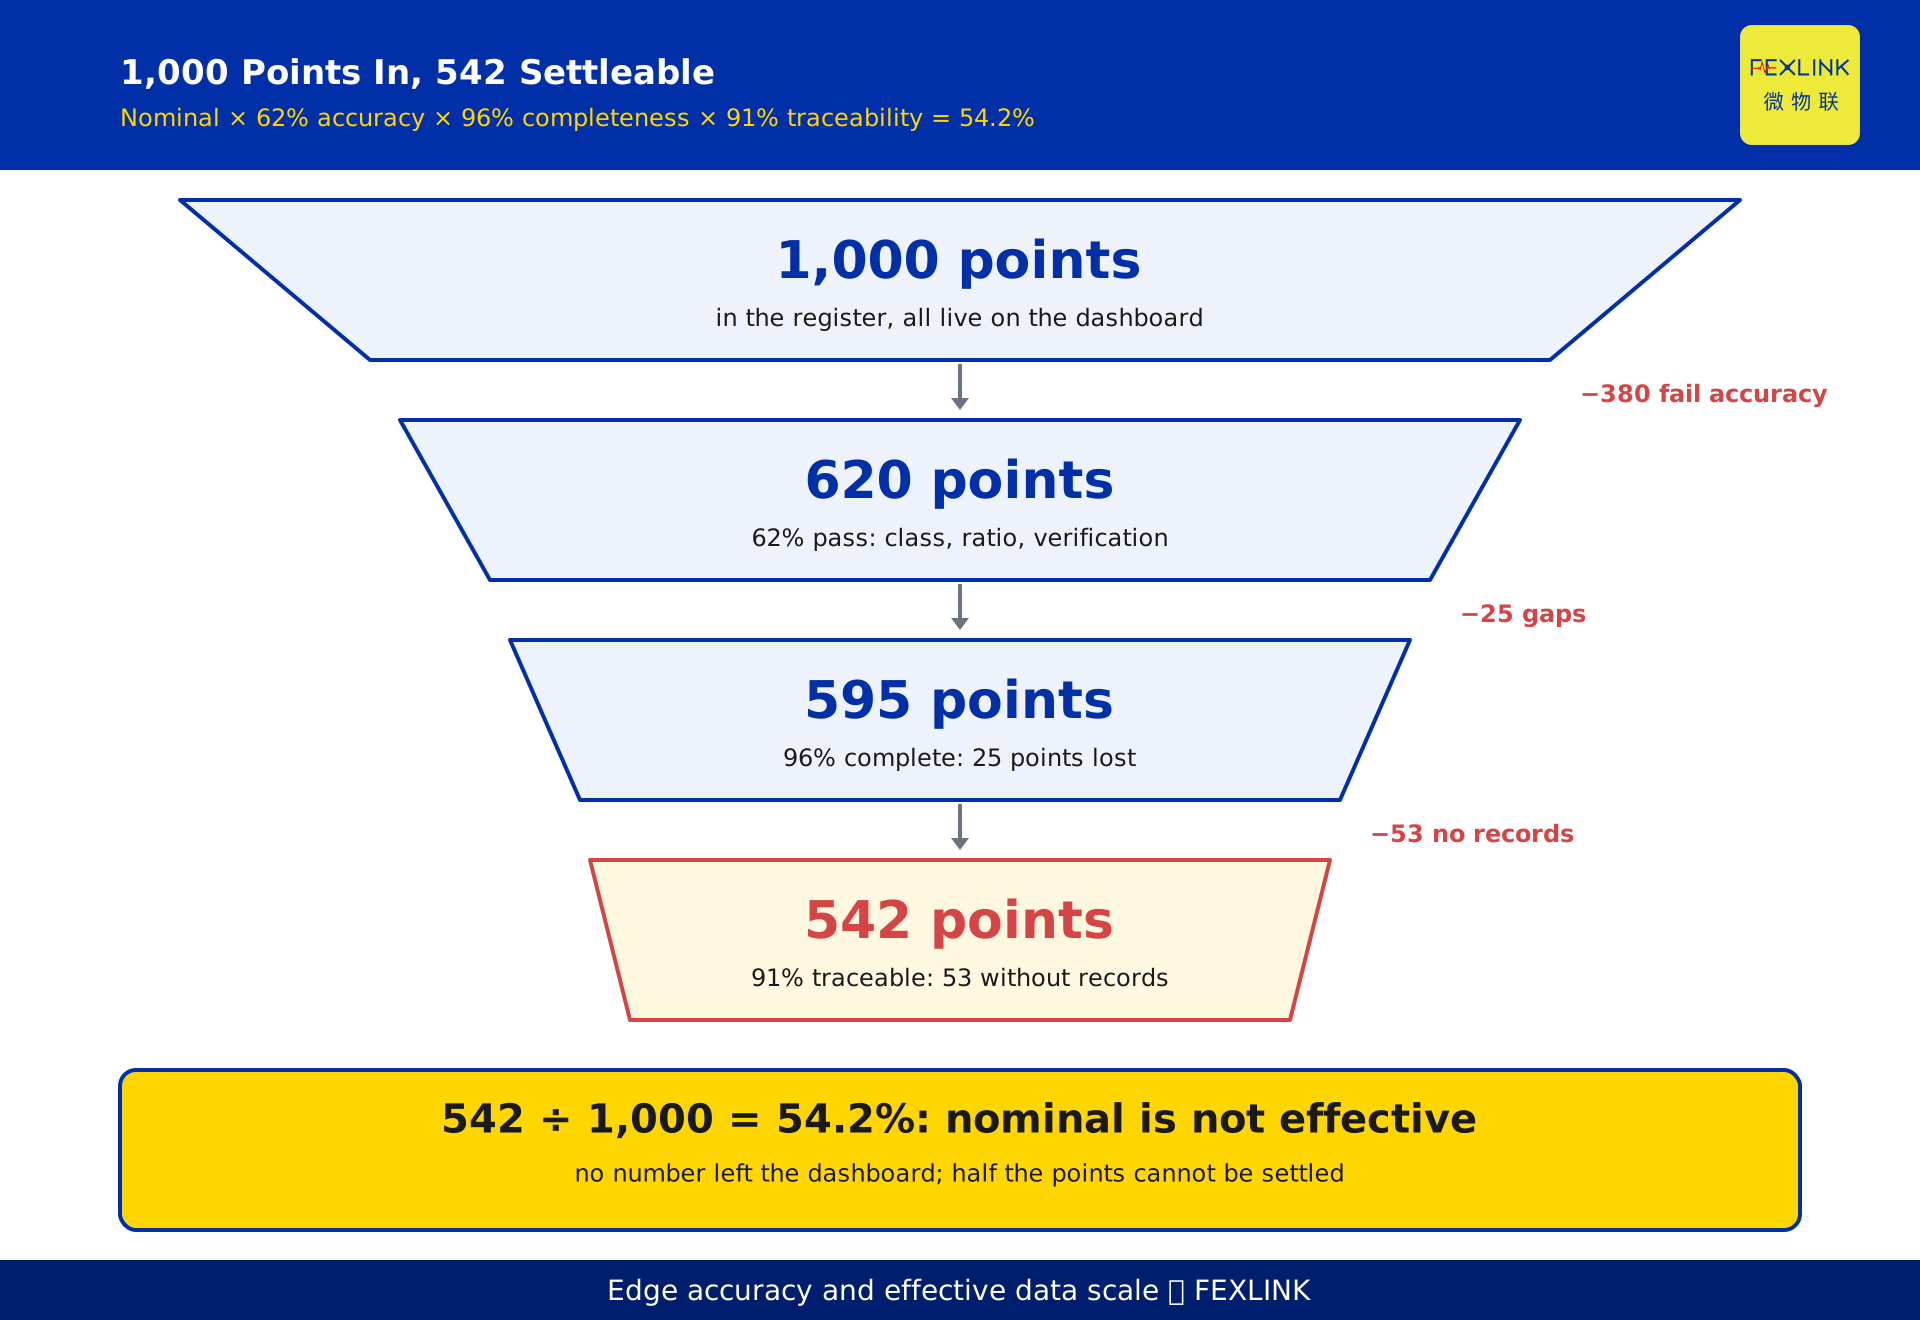
Settlement and carbon verification do not reward data volume. They reward evidentiary quality. If measurement at the edge is not accurate enough, if the series has holes, if the definitions cannot be traced, the data can be looked at but never signed off. Effective data scale equals nominal scale multiplied by edge-level physical accuracy: on one campus with 1,000 metering points, 620 clear the accuracy screen, 96% completeness brings that to 595, and 91% traceability brings it to 542 — 54.2% of nominal. A larger dashboard does not change the multiplication.
1. "It is all on the platform" is not evidence
A sentence like "we have 1,000 metering points and everything is in the cloud" survives a management review and fails an invoice.
The difference is the burden of proof. Reading your own data requires convincing yourself. Settling a performance contract, supporting a carbon verification or answering an energy audit requires convincing a third party who has never seen the site: is the meter accurate, is the series complete, can the number be traced, is it defined the same way as the three reports next to it.
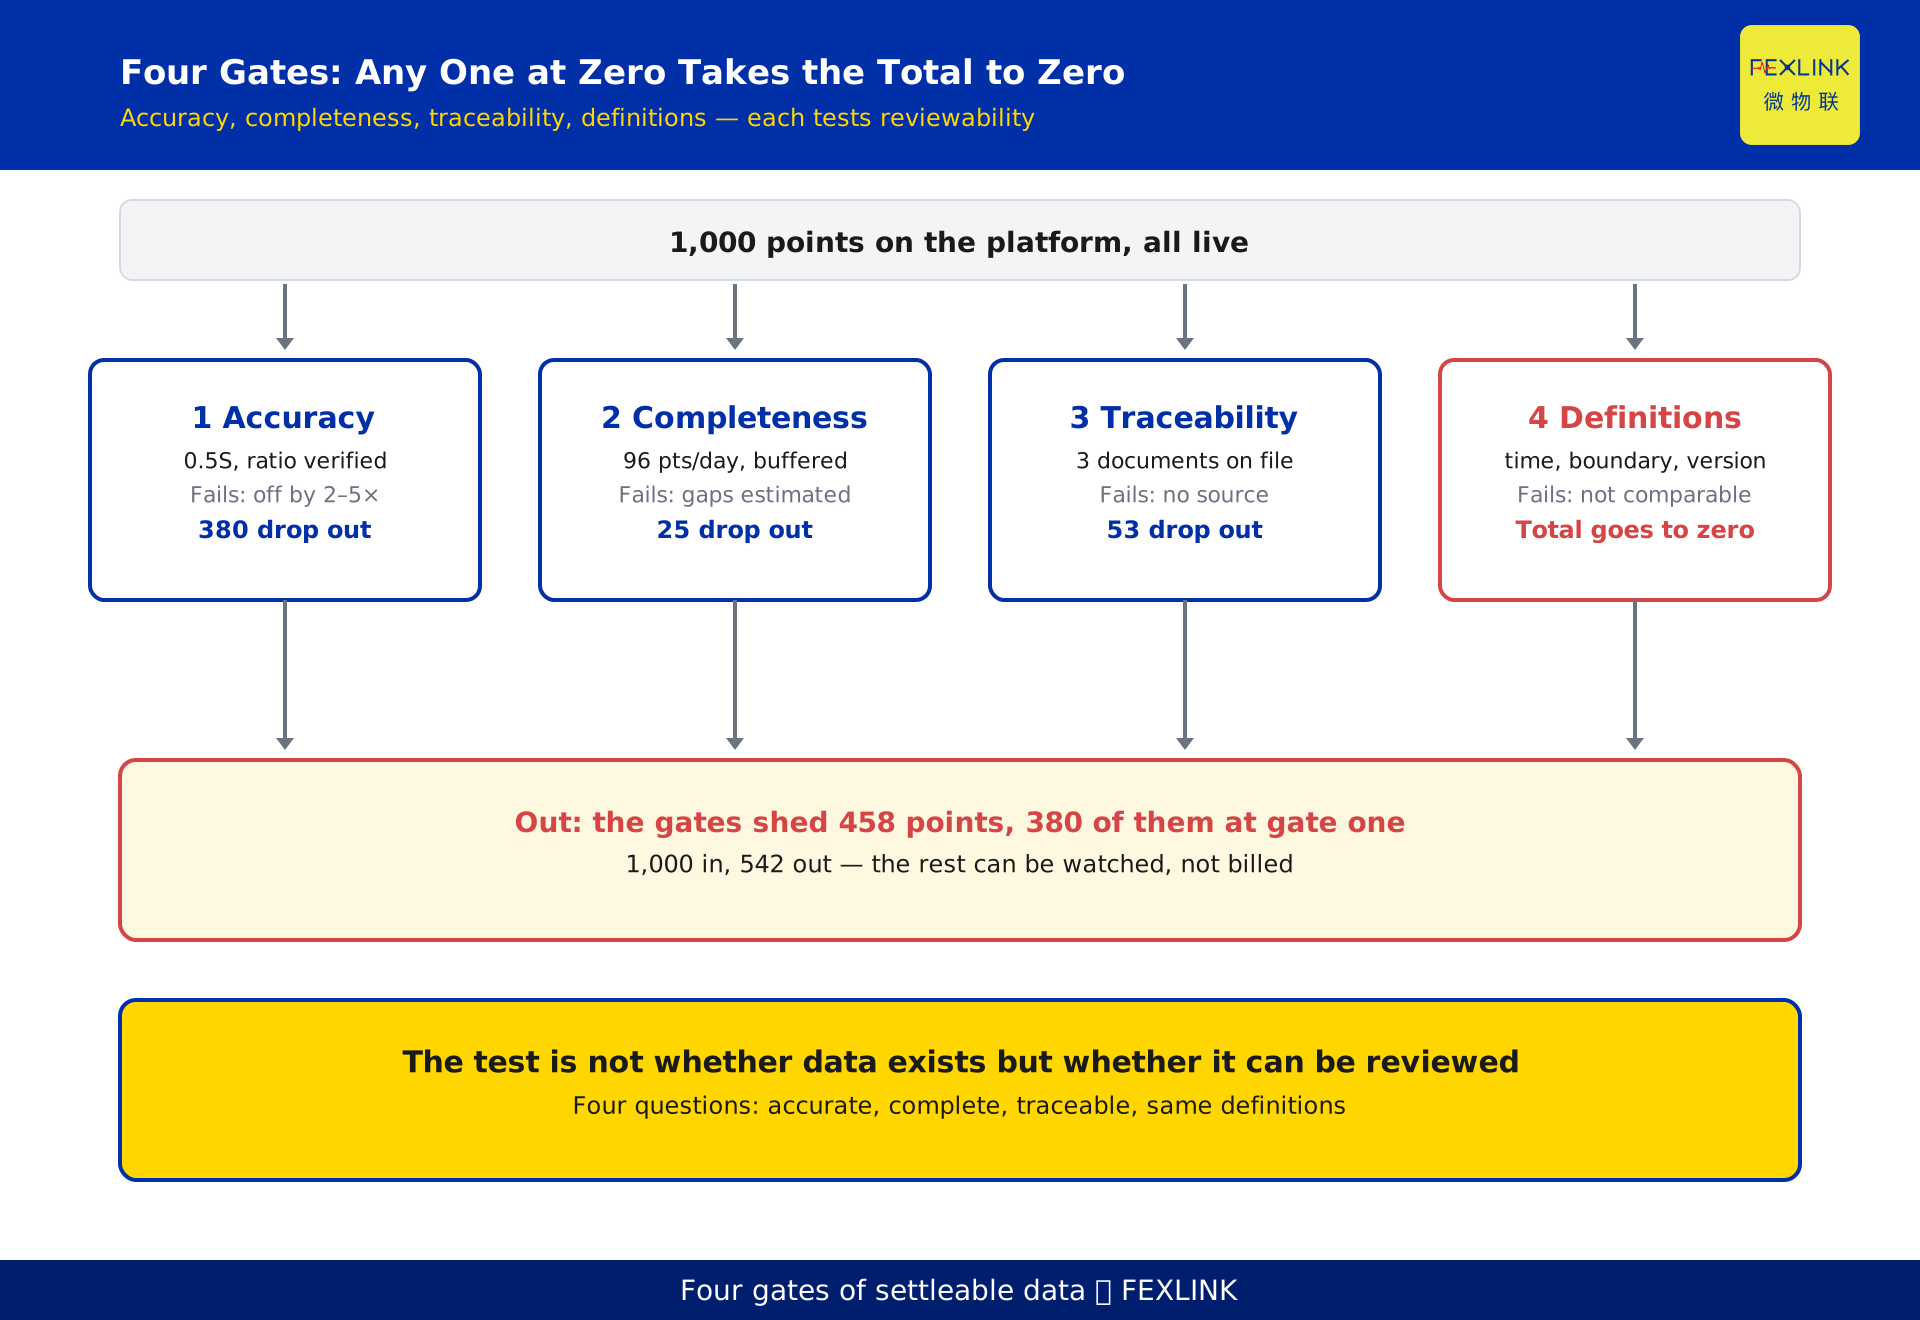
So the threshold is not availability but reviewability. Four gates follow — accuracy, completeness, traceability, definitional consistency. They multiply rather than add: set any one to zero and the result is zero.
2. Gate one: accuracy is a chain, not a meter
Accuracy classes for electrical energy metering come from the GB/T 17215 series; 0.2S, 0.5S, class 1 and class 2 are common. The S suffix targets wide-load applications, where the light-load error limit is tighter than for the non-S equivalent. That matters on a campus: full load by day, lighting by night, load factor swinging between 5% and 100% — where a non-S meter drifts.
The meter is one link. Primary current passes through a current transformer (GB 20840 series) first, and its ratio error adds directly to the reading. Pair a 0.5S meter with a class 1.0 transformer and the chain performs to its weakest link, not to the nameplate.
Ratio configuration fails more often than accuracy class. When the ratio programmed into the meter does not match the site nameplate, every reading is wrong by a factor of 2 or 5 or more — and nothing alarms. Every conclusion downstream inherits the error. Field-verifying ratios is the cheapest high-yield action: ten minutes per point, two weeks for a thousand.
3. Gate two: completeness — a gap is a judgement call
One point every 15 minutes, 96 points per meter per day, 2,880 points in a 30-day month. Lose a stretch and the total has to be reconstructed.
Two ways. Replaying the local buffer in the gateway returns the original value and does not weaken the evidence. Interpolating from the trend on either side produces an estimate, and the moment it enters a settlement definition its status changes. When a verifier asks where a number came from, "we filled it in" downgrades the conclusion.
Land the data at the edge first: a gateway with local storage records through an outage and back-fills by timestamp, narrowing gaps from "we did not capture it" to "the equipment was stopped".
4. Gate three: traceability — every number must name its source
Traceability is not the existence of a database. It is the ability of any number to answer four questions: which circuit is this meter on, what is its ratio, when was it last verified, who changed this record.
Those map to three documents: a point register (meter number against circuit, location, purpose), a ratio record (date and checker), a calibration certificate with a validity date. Miss one and the data is of unknown origin.
GB/T 32150 requires that the data behind a corporate greenhouse gas report be verifiable, and the verifier works upward: which meter produced this activity data, was it within its verification period, how were gaps handled, were changes logged. If the trail stops, even clean data is marked unverifiable.
5. Gate four: definitions — one month, four numbers
Ask four departments for last month's consumption and you get four numbers: finance on the billing month, energy on the calendar month, the platform on the reading cycle, statistics on the reporting month. Each is defensible. Side by side, they contradict.
Time definition: calendar month or reading cycle, midnight on the first or the last meter read. Pick one and write it down.
Boundary definition: main meter reading, or the sum of sub-meters? The two never agree; the difference is line loss plus unmetered load. State it in the notes rather than letting both paths publish.
Conversion definition: the electricity-to-coal coefficient and the emission factor version both need a version number. Which factor to use is another question; which version applies must be fixed before the numbers are issued.
Get definitions wrong and the other three gates stop mattering: you are no longer comparing the same thing.
6. Multiplying the gates: nominal versus effective scale
Nominal scale is the number of points in the register. Effective scale is the number that can enter a settlement definition. The relationship is multiplication:
Effective scale = nominal scale × accuracy pass rate × completeness rate × traceability rate
The conditions are ANDed. A point that meets its accuracy class but is missing half its intervals does not count; a complete series with an unverified ratio does not count either. Any rate at zero takes the product to zero.
That explains why adding meters does not add much settleable data: points that skip ratio verification, never enter the register and never get their communications working only enlarge the nominal figure.
7. How a small error becomes a large one
A single-point error is not the problem; being amplified by share is.
A circuit with a class 1.0 transformer and a class 1.0 meter: combine the errors by root sum square, √(1²+1²) ≈ 1.41, so ±1.4%. On its own, 1.4% is acceptable.
But this circuit carries only 8% of site consumption. Use it to estimate a site-level saving rate and the error divides by that share: 1.4% ÷ 8% ≈ 17.5%. The site number now carries ±17.5% uncertainty.
Typical savings thresholds sit at 5%. A figure of 17.5% is not merely imprecise; it makes the question undecidable: whether the site saved, and by how much, this data cannot answer.
Run the arithmetic backwards. To support a 5% site threshold from a circuit carrying 8% of consumption, its error must stay within 5% × 8% = 0.4%. Both devices move up a class: 1.0 is not enough; 0.4% takes a 0.5S meter with a 0.2S transformer.
8. Worked example: 1,000 points in, 542 usable
The figures below are constructed to demonstrate the arithmetic. They do not represent any real customer.
A campus registers 1,000 metering points. All are connected, all are live on the dashboard.
Screen one, accuracy: 620 points, or 62%, have an adequate meter class, a field-verified ratio and a valid verification date. Of the remaining 380, some are class 1 meters on circuits needing 0.5S, some never had their ratio checked, some are out of verification.
Screen two, completeness: 620 × 0.96 ≈ 595.
Screen three, traceability: 91% of those 595 have a register entry, a ratio record and a verification date. 595 × 0.91 ≈ 542.
542 ÷ 1,000 = 54.2%. Nominal 1,000, effective 542. Not one number disappeared from the dashboard, and half of them cannot be settled.
542 is not the count of bad data but of data that can be defended; the other 458 points remain useful for operations and fault localisation, but cannot be used to bill or verify.
9. Four confidence levels
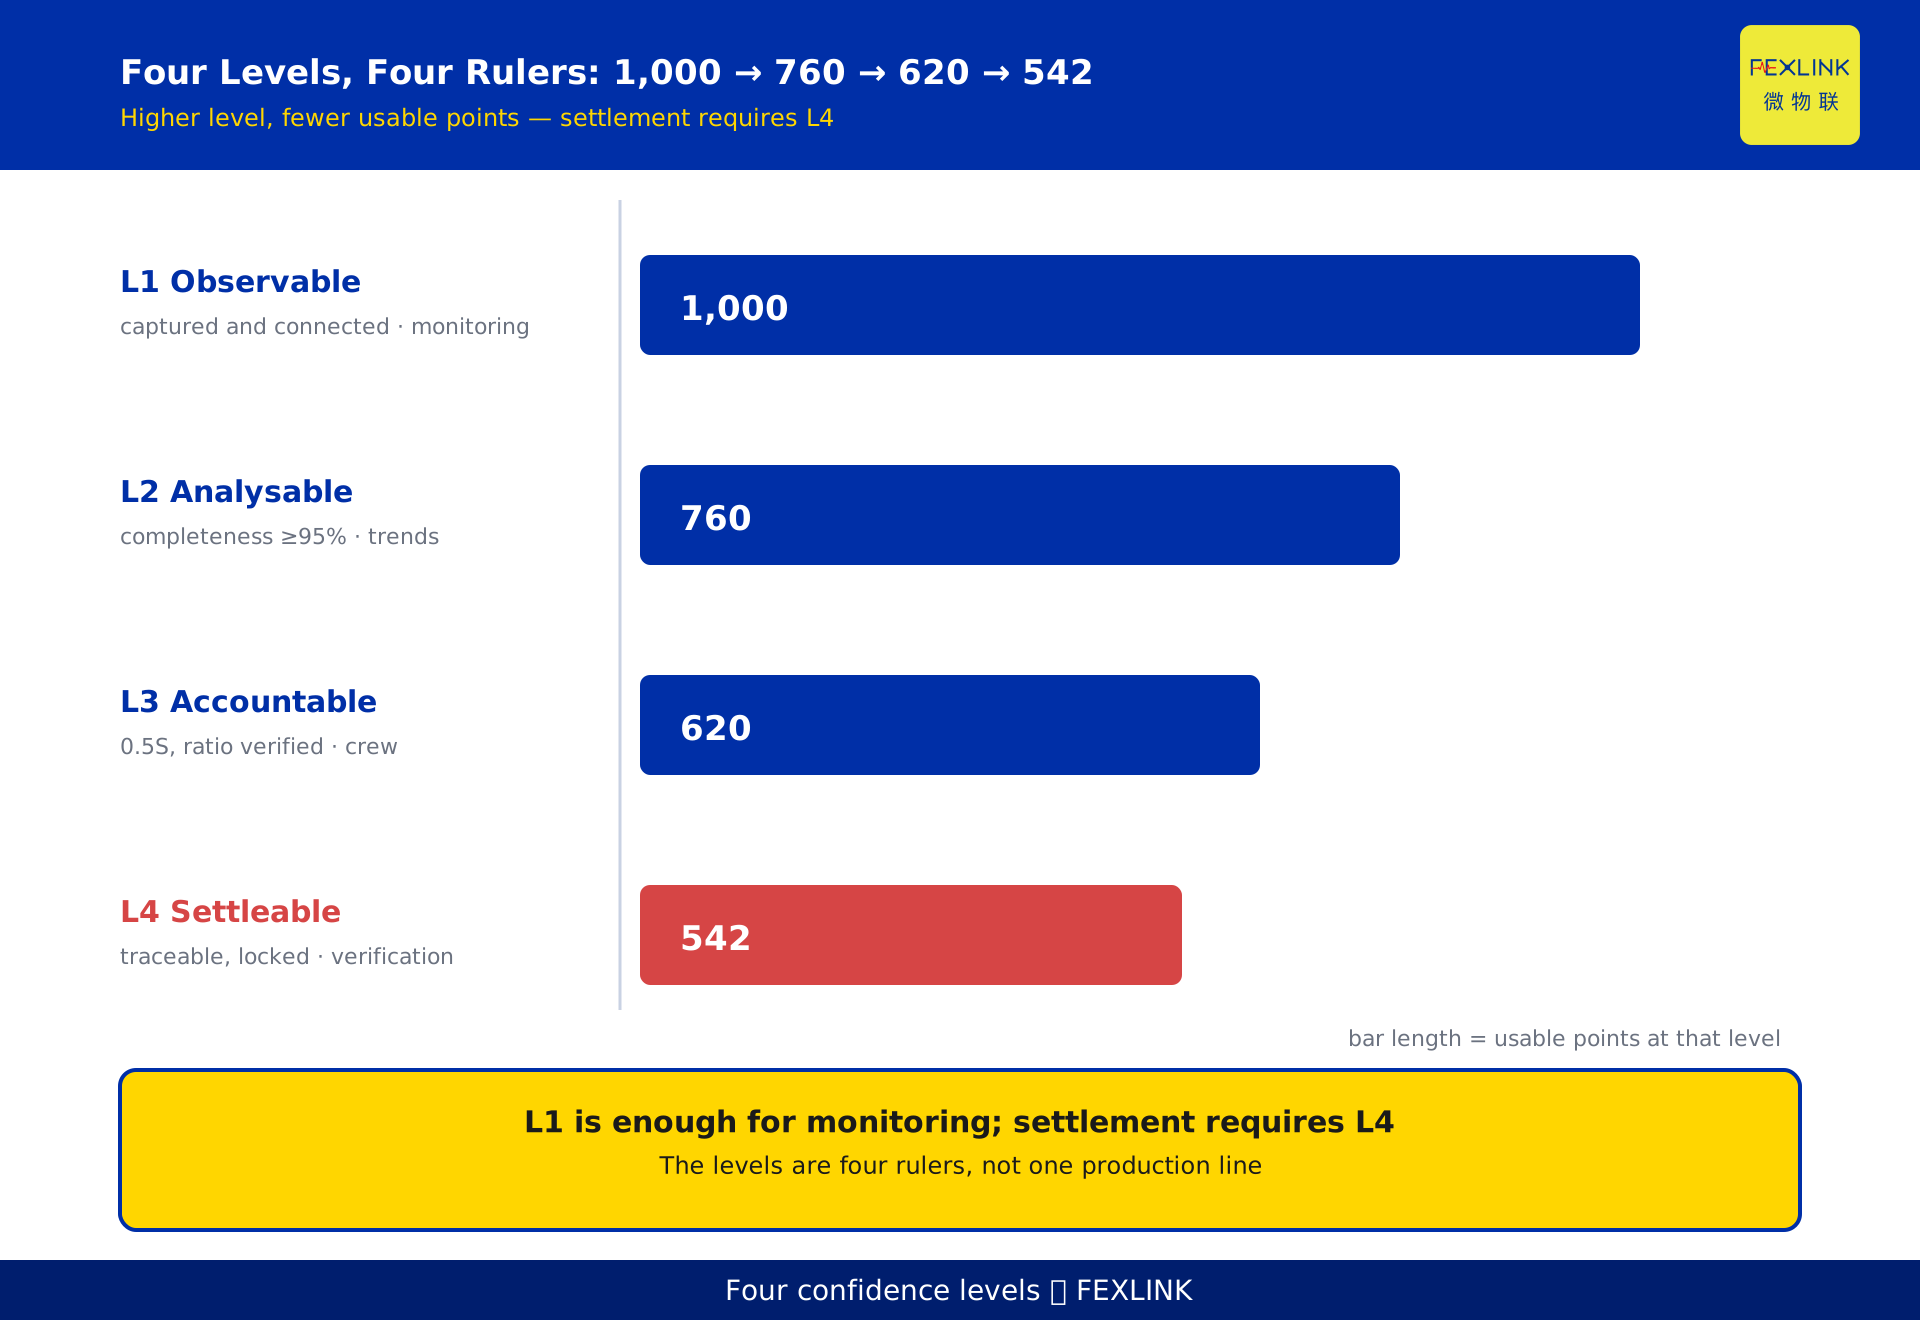
Data from the same campus sits at four capability levels. Different uses need different levels; not every point must reach the top.
L1 observable: captured and connected, 1,000 points. For shift monitoring and fault detection.
L2 analysable: 95% or better individual completeness, 760 points. For trends, benchmarking and load analysis.
L3 accountable: 0.5S accuracy with verified ratios, 620 points. For crew performance and sub-item accounting.
L4 settleable: traceable, definitions locked, third-party reviewed, 542 points. For performance settlement, carbon verification and energy audits.
Note that 760 and 620 are different sets: complete is not accurate, accurate is not continuous; their intersection is around 595 points. The levels are four rulers, not one production line: L1 suffices for monitoring, L4 is the entry requirement for settlement.
10. Five actions, ranked by return on effort
First, verify ratios. Check the transformer nameplate against the meter configuration, point by point, and keep a record. It costs almost nothing and can uncover a large error.
Second, fill the critical circuits. Rank by share of consumption and cover the circuits carrying more than 70% first; no need to blanket the site. GB 17167 sets tiered requirements for metering equipment in energy-using organisations as a basis.
Third, buffer at the edge. Local storage plus store-and-forward removes communications-caused gaps.
Fourth, build the three-document set. Point register, ratio record, verification certificate — all three, or the point is not traceable. The register must support lookup from circuit to meter number, not just a list.
Fifth, lock the definitions. Before each month's numbers are issued, confirm the time definition, the boundary definition and the conversion version, and log any change. It costs nothing and is most often skipped.
How far 542 can be pushed depends on how well the first two are executed, not on platform features.
11. Where the hardware fits
Edge metering sets the accuracy ceiling. The ESA all-element smart meter (for example ESA-22131-R, 3×400A, 3×220/380V, RS485 Modbus) is installed per circuit and takes sub-item energy to circuit level. The series does not include phase or harmonic monitoring: the ESB three-phase imbalance monitor covers phase, the ESE power quality monitor covers harmonics. Selection should follow the circuit's accuracy requirement, not the meter alone.
Completeness comes from the edge. The ESX intelligent edge computing gateway (ESX-0223-GR, DC5V supply, 30 devices or 2000 data points, RS485 downstream, wired and 4G upstream) buffers locally and back-fills by timestamp; most completeness gain comes from this layer.
Traceability comes from records: the meter supplies the reading, the gateway the timestamp, the register the provenance.
Above it, the electricity-carbon coordination framework puts energy and emissions on one set of points and definitions; sites running the 4×3×2 energy-carbon autonomy framework can treat this as its data foundation.
FAQ
Q: The meter is 0.5S, so why is it rejected at verification?
Because verification examines the chain, not the meter. Transformer class, whether the ratio was checked, whether verification is current, how gaps were handled — break any one and a 0.5S meter still cannot carry a settleable conclusion. The meter is necessary, not sufficient.
Q: Once gaps are filled, can the data be used for settlement?
It depends how. Values replayed from the gateway buffer are original and acceptable; interpolated values are not, or only as a declared estimate excluded from the settlement definition. The test: does the number point to a real timestamp on a real meter?
Q: Is more metering always better?
No. Each point adds ratio verification, register maintenance and communications work. Without that support, new points raise the nominal figure and leave the effective figure flat. Get critical circuits to L4 before expanding coverage.
Q: What should be ready for third-party review?
Four items: the point register, ratio verification records, calibration certificates, and a note on gaps and changes. With all four, review is a checking exercise; missing one turns it into reconstruction, at a different order of time and cost.
Q: With only a main meter, can carbon verification be done?
At the total level, yes; at sub-item and savings level, no. A main meter gives site-boundary consumption but cannot support a claim about how much a specific line reduced. For savings or product carbon footprint, sub-metering is required.
Scope and limitations
- This article addresses when electricity-carbon data can be settled or verified, for industrial parks, factories and large buildings with sub-metering in place. Sites with only a main meter can cover total-level accounting only.
- The figures 1,000 / 620 / 595 / 542 points, 62% / 96% / 91% / 54.2%, and the error propagation example at ±1.4% / 8% / 17.5% / 0.4% are constructed to illustrate the arithmetic and do not represent any real customer or project.
- Accuracy classes are cited from the GB/T 17215 series, current transformers from GB 20840, metering equipment requirements from GB 17167, greenhouse gas accounting from GB/T 32150. Specific clauses are subject to the editions in force.
- Emission factor selection is outside scope: this article addresses whether data can be used, not which factor to choose.
- Product models and parameters are subject to the latest selection manual and product knowledge base; the ESA series excludes phase and harmonic monitoring, and such needs call for ESB or ESE. Nothing here is a selection or procurement recommendation.
- Errors are combined by root sum square, assuming independent components; where components are correlated, the treatment and the conclusion may differ.
Frequently Asked Questions
The meter is 0.5S, so why is it rejected at verification?
Because verification examines the chain, not the meter. Transformer class, whether the ratio was checked, whether verification is current, how gaps were handled — break any one and a 0.5S meter still cannot carry a settleable conclusion. The meter is necessary, not sufficient.
Once gaps are filled, can the data be used for settlement?
It depends how. Values replayed from the gateway buffer are original and acceptable; interpolated values are not, or only as a declared estimate excluded from the settlement definition. The test: does the number point to a real timestamp on a real meter?
Is more metering always better?
No. Each point adds ratio verification, register maintenance and communications work. Without that support, new points raise the nominal figure and leave the effective figure flat. Get critical circuits to L4 before expanding coverage.
What should be ready for third-party review?
Four items: the point register, ratio verification records, calibration certificates, and a note on gaps and changes. With all four, review is a checking exercise; missing one turns it into reconstruction, at a different order of time and cost.
With only a main meter, can carbon verification be done?
At the total level, yes; at sub-item and savings level, no. A main meter gives site-boundary consumption but cannot support a claim about how much a specific line reduced. For savings or product carbon footprint, sub-metering is required.