 FEXLINK Research Institute
The short answer
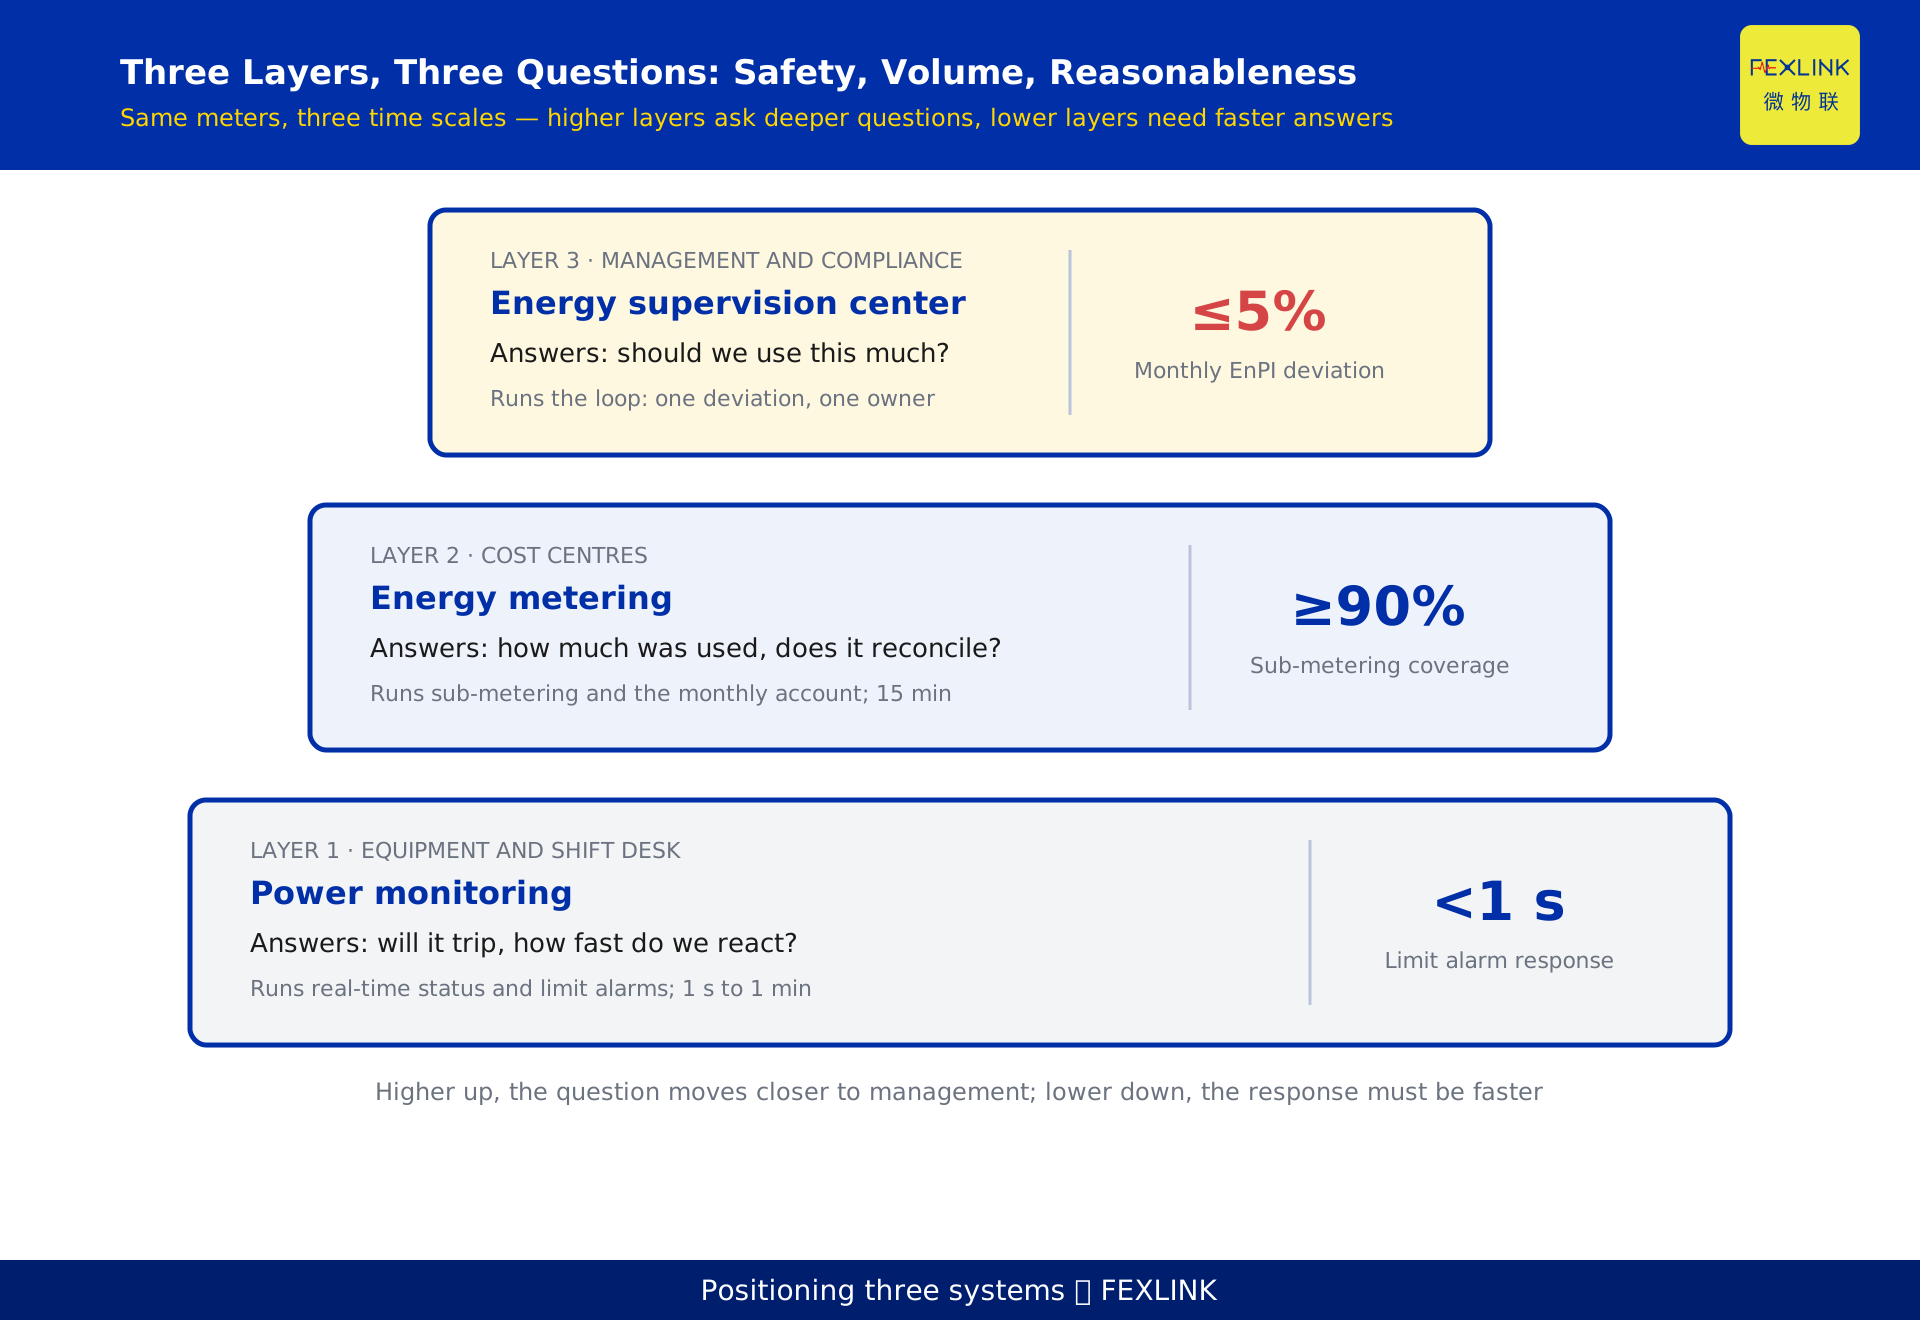
They are three different systems, not three versions of one. Power monitoring watches safe operation and answers "will something trip, and how fast does anyone react when a limit is crossed." Energy metering watches consumption and answers "how much was used, and do the sub-meters add up to the main meter." An energy supervision center governs whether consumption is reasonable and whether it is improving, and answers "should we be using this much, and on what basis do we call it reasonable." The first two produce data; the third is an upper-layer application aimed at management and compliance. They build on each other, and none substitutes for another.
One table, three jobs
Start by separating the questions. The three systems often share the same meters, the same cable and the same platform, yet their objective functions differ: one must prevent incidents, one must produce a defensible account, one must drive change.
| Power monitoring | Energy metering | Energy supervision center | |
|---|---|---|---|
| Question it answers | Will it trip? How fast is the response after a limit is crossed? | How much was used? Do sub-meters reconcile with the main meter? | Should we use this much? What makes it reasonable? |
| Time granularity | 1 s to 1 min | 15 min | Daily and monthly, aligned to the billing cycle |
| Primary user | Shift electricians, maintenance | Energy managers, finance | Company leadership, energy management committee |
| Typical acceptance test | Limit alarm response < 1 s | Sub-metering coverage ≥ 90% | Monthly EnPI deviation ≤ 5% |
| Cost of getting it wrong | The breaker that should have tripped did not, and the incident grows | Numbers without an account; sub-meters never reconcile | Impressive reports, unowned problems |
Note the second row: the granularity differs, which alone stops the three from replacing one another.
Power monitoring: the test is reaction time
Power monitoring samples every 1 s to 1 min and watches breaker status, current, voltage, power factor, limit crossings and alarms. Its acceptance test runs in one direction only: from the moment a limit is crossed to the moment someone knows. A common engineering line is a limit alarm response of < 1 s, meaning the interval from the criterion being met to the alarm leaving the system, excluding human response.
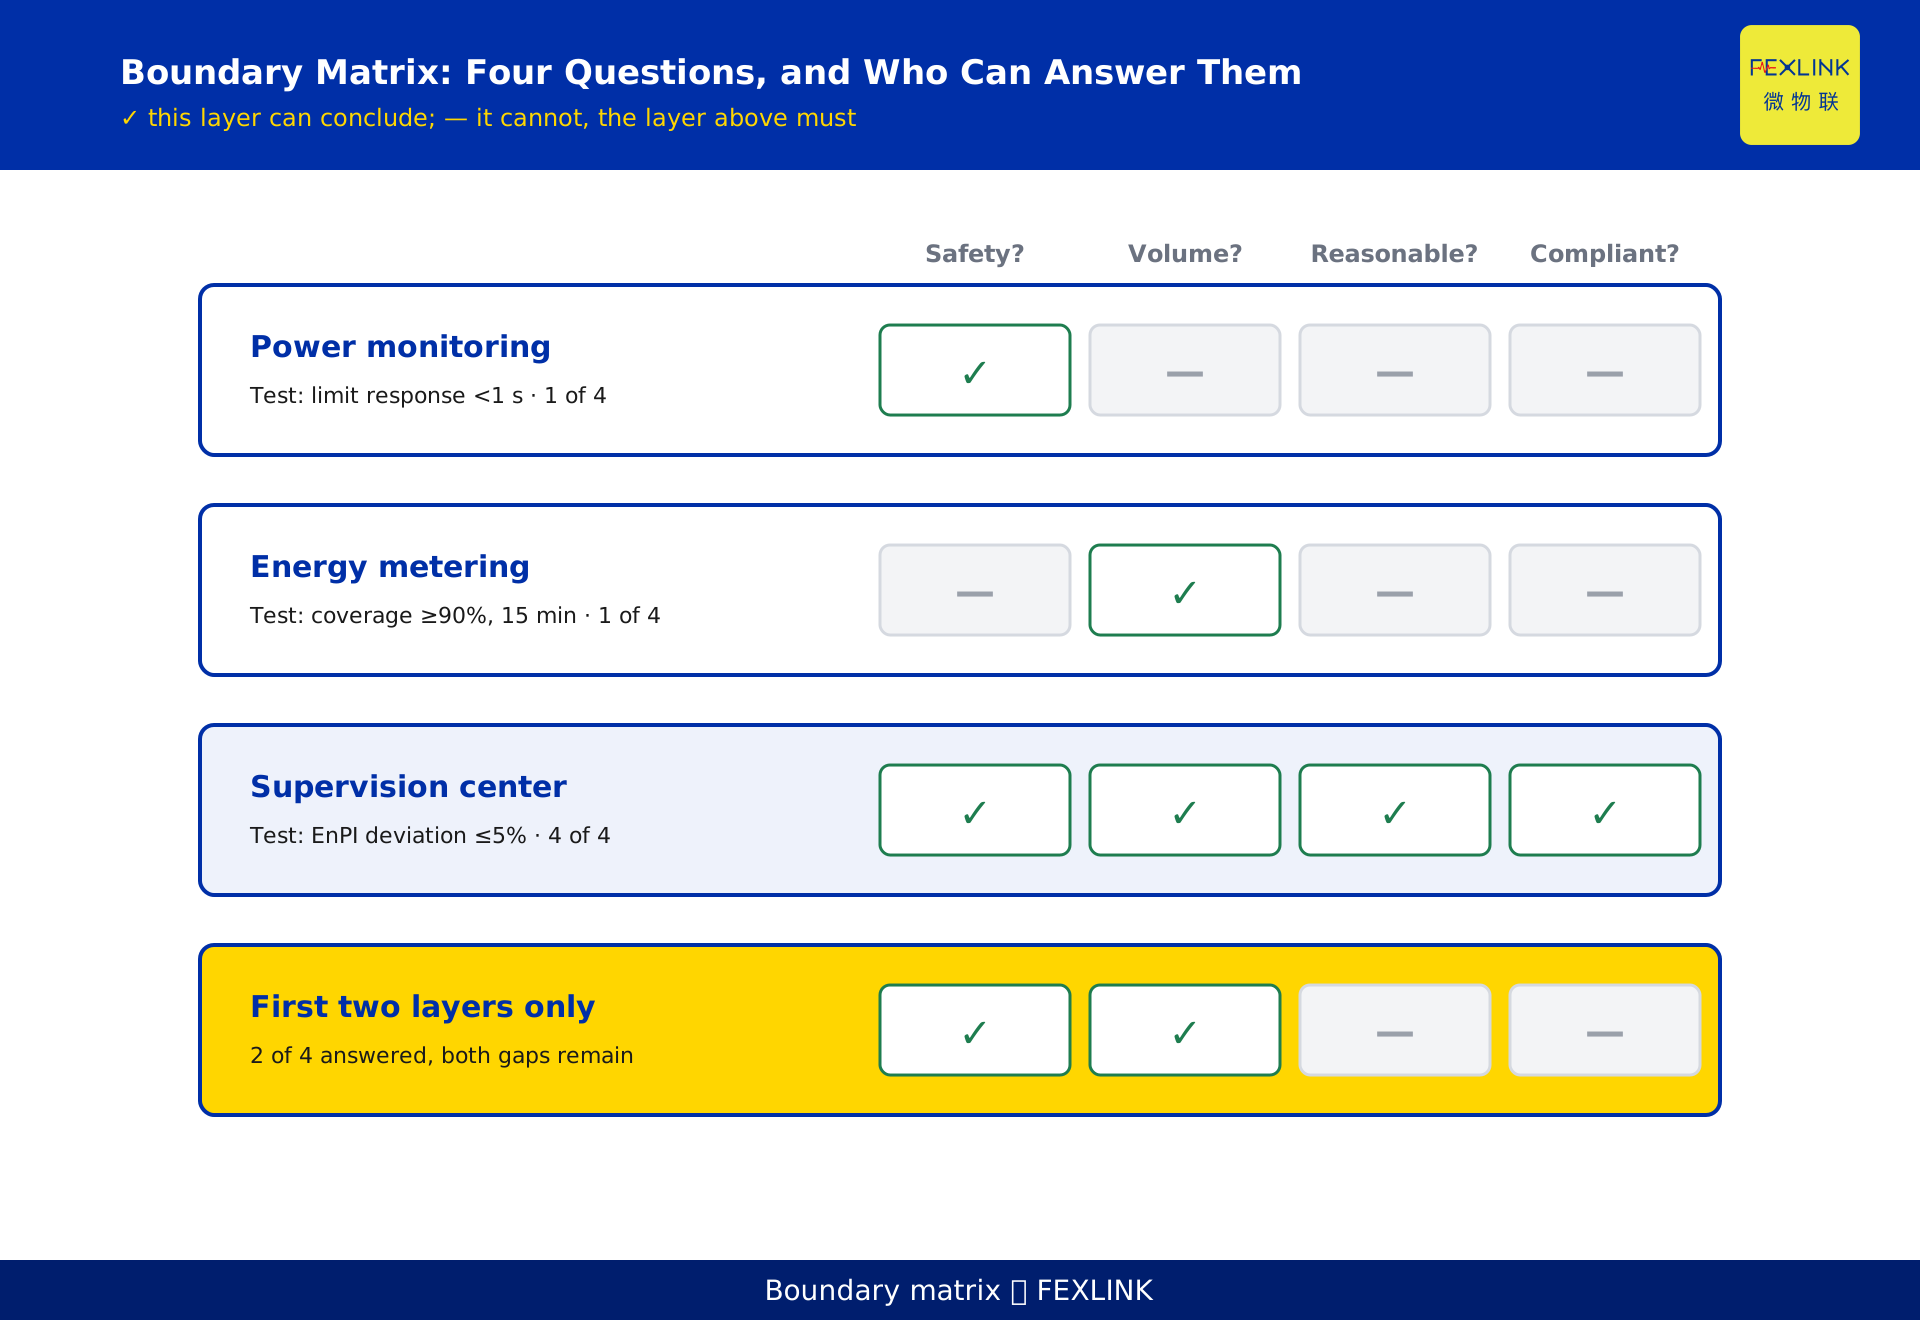
It does not do three things: judge whether a kilowatt-hour should have been consumed, produce a monthly energy account, or conclude whether efficiency targets were met. It answers "is it safe right now," not "was this month reasonable."
A frequent misconception: installing power monitoring delivers energy management. The difference is not hardware. It is whether anyone aggregates by circuit and closes a monthly account.
Energy metering: the test is reconciliation
Energy metering samples every 15 min, aggregates by circuit and by workshop, and issues a sub-metered account at month end. The acceptance test is coverage: metered coverage of the main energy-using circuits at ≥ 90%, with the remaining fraction allowed to be lighting and socket loads, derived by subtracting sub-meters from the main meter.
The 15 min interval is not arbitrary. It has to support time-of-use tariff segments, and it has to keep three years of data inside a maintainable range. Go finer and communication and storage costs rise while management gains nothing.
The boundary is equally clear. Metering states how much was used; it does not state whether that amount was reasonable. Two workshops of the same floor area, one doing precision machining and one warehousing, can differ several-fold in energy per square metre and both be normal. Judging reasonableness needs a comparable baseline, which belongs to the layer above.
The supervision center: the test is whether a deviation has an owner
An energy supervision center does four things: set indicators, compute deviations, assign ownership, keep evidence.
Set indicators. Choose energy performance indicators (EnPI): energy per unit of product for a workshop, per square metre for offices, per unit of output value for leadership. One is never enough, and mixing levels produces contradictory conclusions.
Compute deviations. Compare monthly EnPI against the baseline. A deviation beyond ± 5% must produce a conclusion in that month, not at year end. The ± 5% band is a common management threshold and can be adjusted for process volatility, but it must resolve to one explicit number, otherwise "slightly off" never produces a decision.
Assign ownership. One deviation, one improvement item, with the circuit, the owner and a deadline written down. A deviation without an owner is still there next month.
Keep evidence. Annual savings are calculated per GB/T 28750. Demand overruns are flagged 1 billing cycle ahead, because one cycle of lead time is what allows production scheduling to respond.
To tell whether a supervision center actually supervises, look at one thing: is there a signature on last month's deviation report.
Does it cover safety? Three boundary lines
The question trips people up. The answer: it governs the consequences of safety events, not the actions that prevent them.
First line: not the action, the consequence. Protection settings, interlock logic and trip outputs belong to protection and power monitoring. What the supervision center does is translate limit crossings into money and compliance exposure: three crossings this month, how much extra demand charge each carried, whether a supply-contract assessment clause was triggered.
Second line: not real time, the trend. A second-level mimic diagram serves the shift desk; the supervision center asks which hours, which circuits, what pattern. The first needs fast refresh, the second comparability.
Third line: not the equipment, the evidence. It does not judge whether a transformer is healthy, but it keeps a traceable record: who changed the baseline and when, which deviation raised an improvement item, what the acceptance basis was. Those records are what an audit, a certification or a regulatory submission will ask for.
So "can a supervision center replace power monitoring" is the wrong question. The right one: can the existing monitoring data be retrieved by circuit and time band?
Four dimensions: from visible to auditable
The value is not more numbers on a screen but depth of judgement: four dimensions, each harder than the last.
Measurement: is it visible? Tests: sub-metering coverage ≥ 90%, interval 15 min, availability at the contracted level.
Performance: is it explainable? Tests: monthly EnPI deviation ≤ 5%, traceable to a specific circuit.
Cost: is it priced? Tests: demand, power-factor and time-of-use charges recorded separately, savings convertible into money.
Compliance: is it auditable? Tests: every conclusion has a traceable trail and calculation, reproducible per GB/T 28750.
These four are levels of judgement, not levels of an organisation chart. Company, workshop, line, equipment is a different axis, about how data is aggregated. Both are needed, but mixing them yields a wall display that shows everything and a meeting where nothing can be explained.
Where the data comes from: 13 metering points to 12 million records
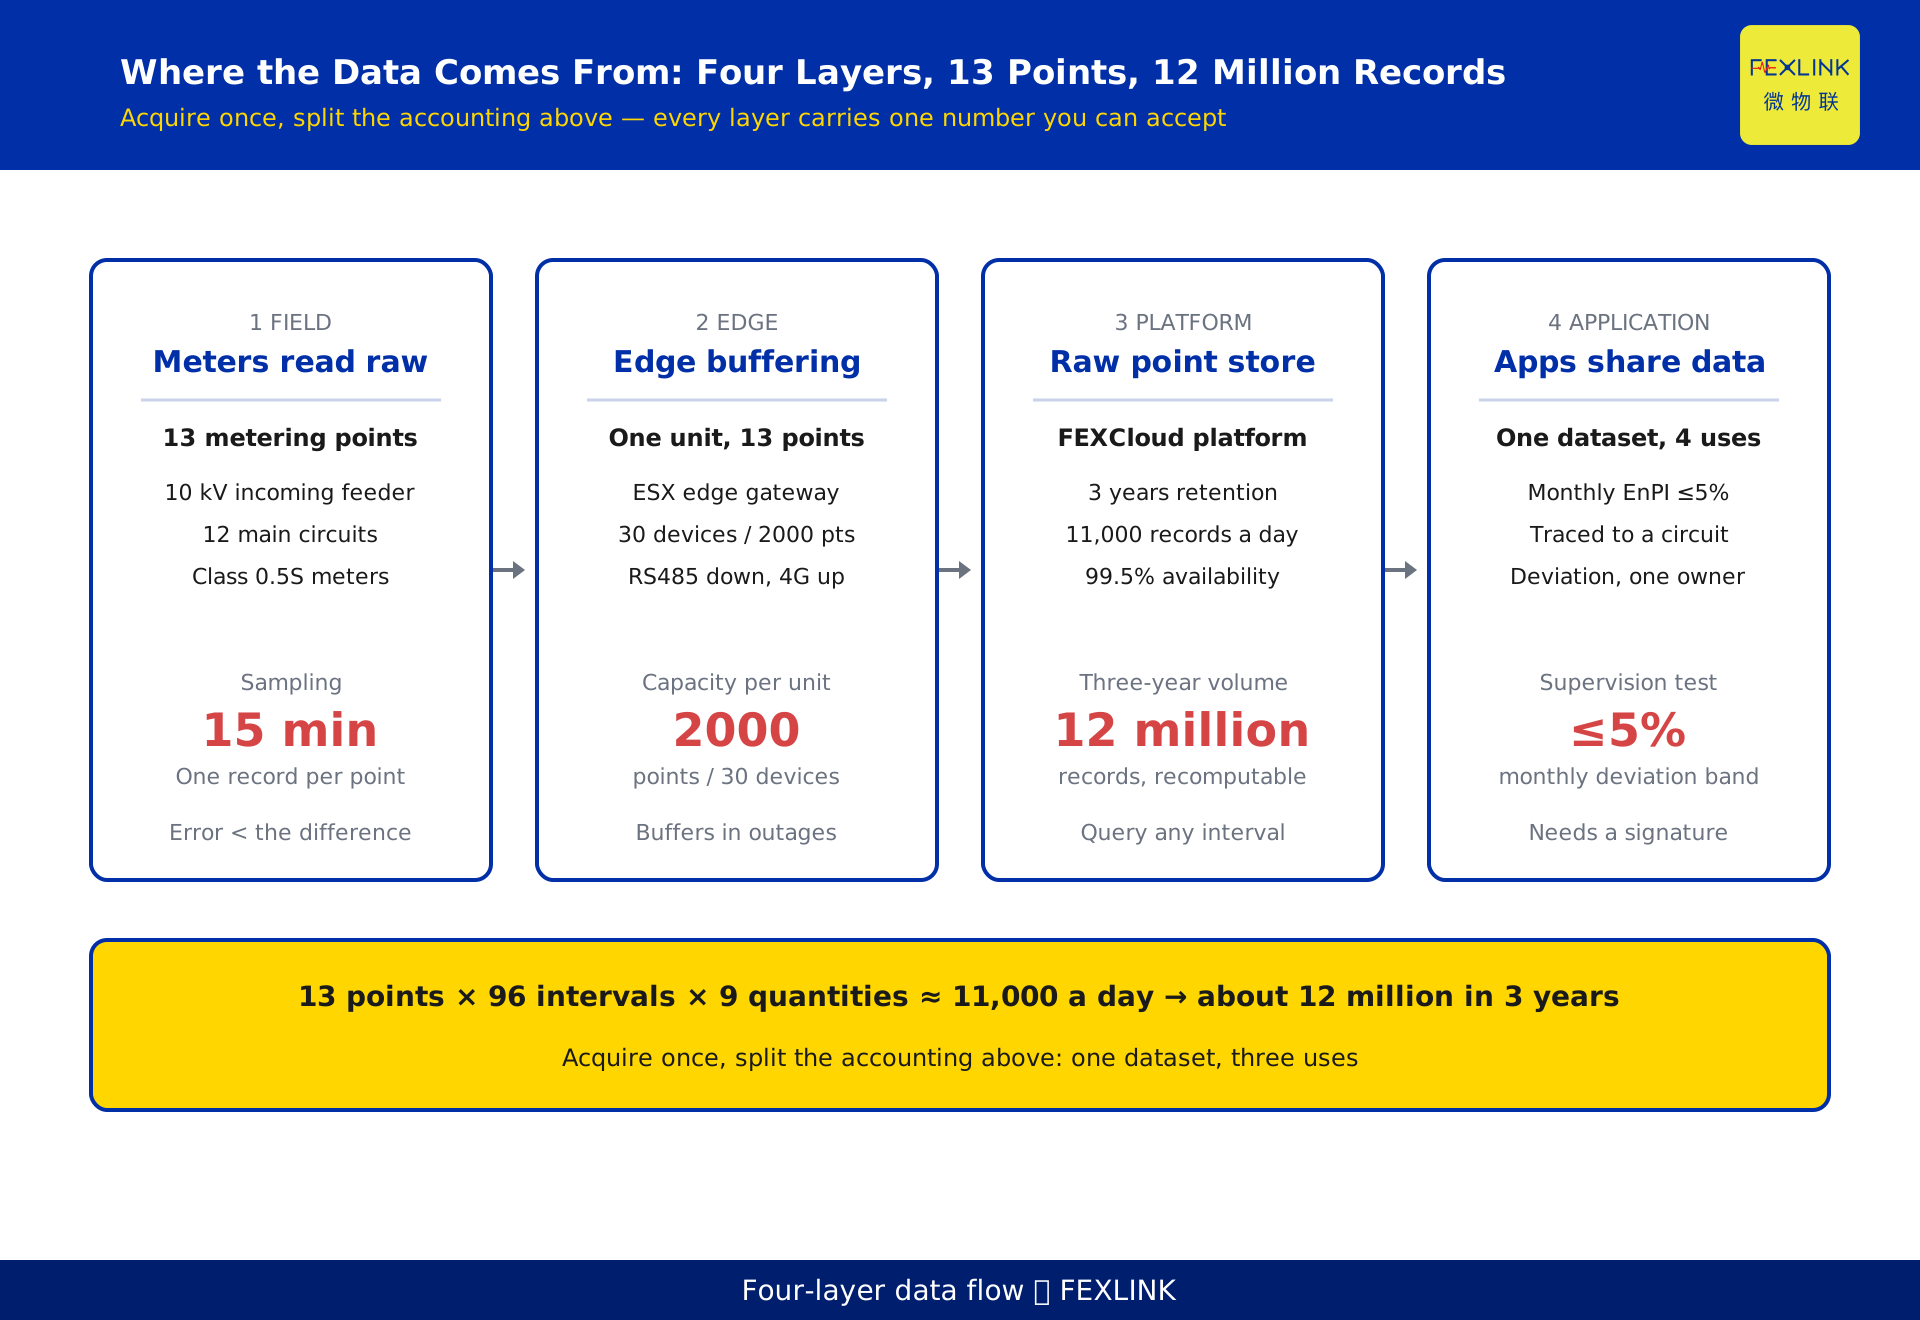
Take a mid-sized plant as an illustration (constructed for this article, not a real customer): one 10 kV incoming feeder plus 12 main circuits, giving 13 metering points.
At the field layer, class 0.5S multifunction meters. The 0.5S class is not cosmetic: annual savings have to be calculated per GB/T 28750, and meter error must be clearly smaller than the difference being measured, or the signal-to-noise ratio fails and the conclusion will not hold.
At the edge layer, an ESX intelligent edge computing gateway (DC 5 V supply, OLED display, 30 devices / 2000 data points per unit, RS485 downstream, wired plus 4G upstream). Thirteen metering points at 9 quantities each fit in one unit with headroom to spare. It also buffers locally during an outage and backfills afterwards, otherwise the monthly account has a hole in it.
At the platform layer, the FEXCloud IoT cloud platform stores raw points in a time-series database, sized for 3 years of retention. Run the arithmetic: 96 intervals per day, 13 metering points, 9 quantities per point, roughly 11,000 records a day; about 12 million over three years. Modest for a time-series store, but a demanding query pattern, since any circuit, any time band and any interval may need recomputation.
The application layer holds supervision, benchmarking, carbon accounting and reporting: four applications on one dataset, which is what keeps their boundaries aligned.
Availability is accepted at 99.5%. That number is a management commitment rather than a technical specification: it allows about 44 hours of outage a year, beyond which someone has to establish whether the cause was communications, power or the platform.
How it relates to EMS and to carbon platforms
The three layers nest; they do not replace each other.
An EMS leans toward control: dispatch, output, automatic regulation, and its output is a command. A supervision center leans toward management: indicators, deviations, ownership, and its output is a conclusion. If a problem can only be solved by issuing a command, it belongs to the EMS; if it needs a conclusion and an owner, it belongs to the supervision center. They can share a real-time database, but one system will not do both jobs well.
A carbon platform is the same data under a different algorithm: consumption multiplied by an emission factor. It shares metering and aggregation with the supervision center and differs in output, one an efficiency conclusion, the other an emissions account.
What must be avoided is three separate acquisition chains. Meters installed once, gateways again, platforms a third time, and three systems report three different numbers for the same month. Acquire once; separate the accounting boundaries above it.
How far to build
Do not decide by budget. Decide by which question you currently cannot answer. Three tests, in order.
First: is sub-metering coverage at 90%? If not, fix metering and energy metering first. A supervision center on an inaccurate ledger is analysis on bad books.
Second: with coverage in place, does anyone conclude on deviations monthly? If three consecutive months pass with no position taken on a ± 5% deviation, the missing piece is not data but an ownership loop.
Third: can a deviation be traced to a circuit? If not, sub-metering is still too coarse, and the answer is to go back a layer.
Only when all three pass does the supervision center come into play. Reverse the order and you buy an attractive wall display.
FAQ
Q: We already have power monitoring. Do we still need separate energy metering?
Yes. Power monitoring organises data by equipment status; energy metering organises it by circuit and cost centre. The same meter reading serves limit detection in one case and a monthly sub-metered account in the other. If the monitoring points already cover the main circuits, reuse the acquisition and add the aggregation and reporting layer.
Q: Is an energy supervision center just energy data on a big screen?
No. A screen is presentation. The core is the chain of indicator, deviation, owner and evidence. The test is simple: is there a signature and a matching improvement item on last month's deviation report? If not, it is a dashboard.
Q: Once the supervision center is live, do we keep the shift monitoring screens?
Keep them. They serve different time scales: the shift desk works in seconds, the supervision center in days and months. The supervision center does not replace protection and interlocks, and it carries no real-time response duty. What can be merged is the data channel and the entry point; what cannot is the response mechanism.
Q: We only have a main meter. Can we go straight to a supervision center?
No, but a first step is possible. Every conclusion has to land on a circuit. With only a main meter you learn the site total, and a deviation cannot be traced. Cover the circuits carrying more than 70% of consumption first, then talk about the upper layer.
Q: Can the supervision center and the EMS be one system?
Technically yes, managerially it must be split. One system can hold both real-time monitoring and monthly analysis, but it must be explicit who owns the action and who owns the conclusion. Blur the two and real-time alarms drown the analysis pages, so neither function gets used.
Scope and limitations
- The three-layer split applies to electricity-dominated industrial and commercial users and parks. For steam- or gas-dominated energy structures the logic holds, but the metering objects and acceptance tests must be redesigned.
- The figures used here (13 metering points, 9 quantities per point, about 11,000 records a day, about 12 million over three years, 99.5% availability or roughly 44 hours a year) are constructed to illustrate orders of magnitude and do not represent any real customer or project.
- The ± 5% monthly deviation band, the ≥ 90% sub-metering coverage and the < 1 s limit alarm response are common engineering conventions, not mandatory standards; specific projects should fix them in contract.
- Protection settings, interlock logic and trip output calibration are outside the scope of this article and must be executed by qualified organisations.
- Parameters of the ESX intelligent edge computing gateway and the FEXCloud IoT cloud platform are subject to the current selection manual and product knowledge base; this article is not a selection or procurement recommendation.
- GB/T 28750, ISO 50001 and GB/T 23331 are cited as currently effective versions; after a standard revision the related criteria must be rechecked.
Frequently Asked Questions
We already have power monitoring. Do we still need separate energy metering?
Yes. Power monitoring organises data by equipment status; energy metering organises it by circuit and cost centre. The same meter reading serves limit detection in one case and a monthly sub-metered account in the other. If the monitoring points already cover the main circuits, reuse the acquisition and add the aggregation and reporting layer.
Is an energy supervision center just energy data on a big screen?
No. A screen is presentation. The core is the chain of indicator, deviation, owner and evidence. The test is simple: is there a signature and a matching improvement item on last month's deviation report? If not, it is a dashboard.
Once the supervision center is live, do we keep the shift monitoring screens?
Keep them. They serve different time scales: the shift desk works in seconds, the supervision center in days and months. The supervision center does not replace protection and interlocks, and it carries no real-time response duty. What can be merged is the data channel and the entry point; what cannot is the response mechanism.
We only have a main meter. Can we go straight to a supervision center?
No, but a first step is possible. Every conclusion has to land on a circuit. With only a main meter you learn the site total, and a deviation cannot be traced. Cover the circuits carrying more than 70% of consumption first, then talk about the upper layer.
Can the supervision center and the EMS be one system?
Technically yes, managerially it must be split. One system can hold both real-time monitoring and monthly analysis, but it must be explicit who owns the action and who owns the conclusion. Blur the two and real-time alarms drown the analysis pages, so neither function gets used.