 FEXLINK Research Institute
Direct Answer
What does an energy audit actually examine? An energy audit is not a casual walk-through — it systematically checks four lines: the power-supply and distribution system, the main energy-consuming systems (fans, pumps, air-conditioning, compressed air, process equipment), lighting and the metering management — first clarifying the energy flow and the loss points, then benchmarking to find the saving potential — each system line has fixed checkpoints and opportunity points — the report ends with quantified opportunities and an implementation priority.
A scenario: A company pays for an audit, the service provider walks around and the report only says "strengthen the management" — the company asks: what was actually examined? The logic is that the core of an audit is not "looking" but "examining" — examining the systems, the flow, the losses and the benchmark — each system line has fixed checkpoints — without systematic examination, there are no saving opportunities.
1. The Scope of an Energy Audit
The definition of an energy audit — a systematic check and analysis of the energy utilization of a plant: clarifying the energy flow, finding the loss points and evaluating the saving potential; The basis of the audit — GB/T 17166, the General Technical Rules of Energy Audit: defining the general procedures and methods; The boundary of the audit — one complete audit covers: the power supply and distribution, the main energy-consuming systems, lighting and the metering management; The output of the audit — a list of saving opportunities + the implementation priority + the expected saving — not "strengthen the management".
In one sentence: the energy audit has a national-standard basis, a system boundary and a quantified output — it examines the systems, the flow and the losses, not a casual tour.
The comparison table of the audit steps:
| Step | What to examine | Output |
|---|---|---|
| Overview | Energy flow, equipment list | Flow-diagram draft |
| System by system | Supply/distribution, fans, pumps, air-con, lighting | Loss-point list |
| Benchmark | Unit consumption vs advanced level | Gap list |
| Output | Opportunity ranking, expected saving | Audit report |
The grades of the audit — grade one: check the ledgers and bills, an overview; grade two: field measurement, system-by-system examination; grade three: continuous monitoring, dynamic benchmarking — the deeper the audit, the more accurate the opportunities. An example: A company audits by GB/T 17166 — phase one clarifies the whole-plant energy flow, phase two examines the system losses one by one and phase three benchmarks to find the opportunities — the report outputs 12 opportunities ranked by the saving — the company implements them and the annual bill drops noticeably. The logic is that the audit is a "examine-benchmark-output" process — examine the system status first, benchmark the industry level next and output the quantified opportunities — with a procedure, nothing is missed.
2. The Examination Path from Supply/Distribution to the Main Systems
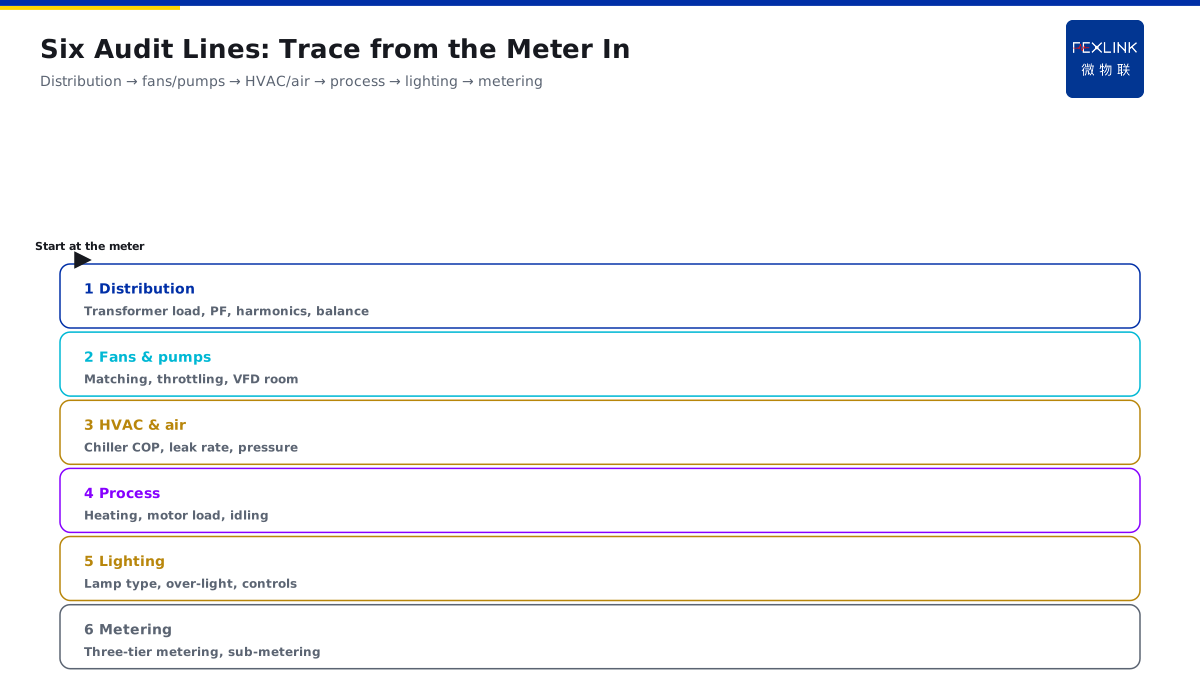
Line one: the supply and distribution system — transformer loading rate, power factor, harmonics and three-phase unbalance: examining the distribution losses and the power quality; Line two: fans and pumps — whether the pump head matches the flow, damper regulation, the VFD space: examining the saving space of the conveying system; Line three: air-conditioning and compressed air — the cooling-source efficiency, the compressed-air leakage rate and the air pressure: examining the losses of cooling and air; Line four: process equipment — the efficiency of electric heating, the motor loading rate and the standby energy: examining the waste of the process; Line five: lighting — the lamp type, whether the illuminance is excessive and the smart control: examining the lighting energy; Line six: metering management — whether the three-level metering is complete and the data is sub-metered: examining the management gap.
In one sentence: the path starts from "where the electricity comes in" — supply/distribution looks at the losses, the main systems look at the matching, lighting looks at the redundancy and metering looks at the management — line by line, without repetition or omission.
An example: A company examines by the path — the supply/distribution finds a 0.82 power factor (large reactive loss); the fans and pumps find damper regulation (VFD can save about 30%); the compressed air finds a 15% leakage (above the recommended value); the air-conditioning finds an oversized cold source — four lines reveal six opportunity points. The logic is that each line is an independent examination channel — the supply/distribution asks "how the electricity is lost" and the consuming systems ask "how the electricity is wasted" — when no channel is missed, no opportunity point is missed.
3. The Energy Flow Diagram and Loss-Point Identification
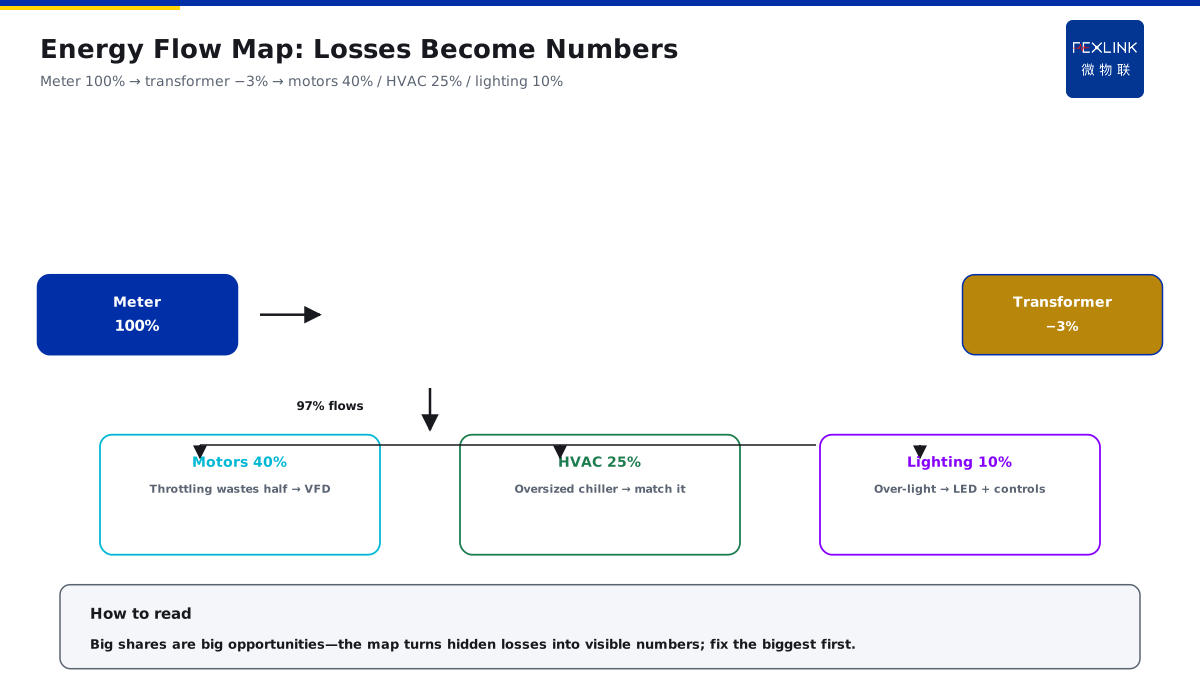
The energy flow diagram — the flow from the power purchase to each consuming system is drawn: what the primary energy becomes and where the loss sits; The value of the diagram — seeing at a glance "where the energy comes from, where it goes and where it is lost": the map for finding the opportunities; The types of the loss points — the distribution losses (transformers/lines), the conveying losses (pipes/ducts), the conversion losses (motors/heating) and the standby losses (idling equipment); The quantification of the losses — each loss point is given a magnitude: how much is lost, how much can be saved and whether it is worth it.
In one sentence: the flow diagram is the map of the audit — the energy flows from the meter to each system and has a loss at each link — mark the loss points and quantify them, and the saving opportunities become visible.
The self-check list of the loss-point identification — is the transformer under-loaded for a long time (large no-load loss)? Do the motors use damper/valve regulation (large throttling loss)? Does the compressor run all the time (leakage above 10%)? Is the cooling source oversized (a big horse pulling a small cart)? Is the lighting on 24 hours (excessive illuminance)? — run through the five questions and the loss points basically surface. An example: A company draws the flow diagram — the meter 100% → the transformer 3% loss → the motor system 40% (half wasted by damper regulation) → the air-conditioning 25% (oversized cold source) → the lighting 10% (excessive illuminance) — once the diagram is out, the opportunities are clear at a glance. The logic is that the diagram turns the "invisible loss" into "visible numbers" — the share of each link is the weight of the opportunity — examine and fix the largest share first.
4. The Common Saving Opportunities: Reactive Power, Air Leakage, Air-Conditioning
Reactive power — low power factor and reactive current occupying the capacity: add compensation and reduce the line losses; Compressed-air leakage — a leakage rate above the standard and the compressor idling: find and seal the leaks, and lower the air pressure; Air-conditioning — oversized cold source and large-flow-small-delta-T water system: VFD regulation and system optimization; Fans and pumps — damper/valve regulation and motors under-loaded for a long time: VFD regulation and load matching.
In one sentence: reactive power, air leakage and air-conditioning are the three high-frequency opportunities — examine the power factor, the leakage rate and the cold-source matching — after the three points, half of the opportunities come out.
The magnitude reference table of the opportunities:
| Opportunity | Typical magnitude | Verification |
|---|---|---|
| Reactive compensation | 0.85→0.95 PF, loss down about 2%-4% | Power-quality monitor |
| Air leakage | 10%-20% sealed to below 5% | Leak detector |
| Fan/pump VFD | Damper to VFD, save 20%-30% | Meter before/after |
| Air-con optimization | Oversized to matched, save 15%-25% | Operating parameters |
| Lighting retrofit | LED + smart control, save 30%-50% | Sub-metering |
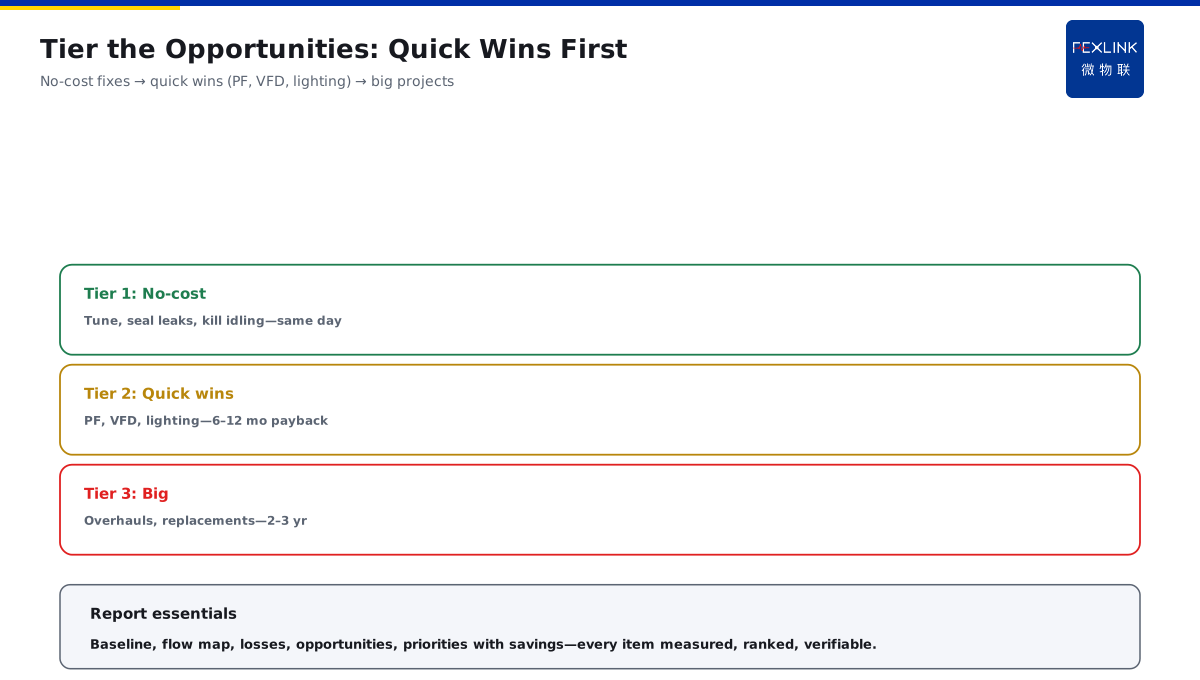
The priority rule of the opportunities — do the zero-investment items first (tuning, leak sealing, standby off); then the quick wins (reactive compensation, VFD, lighting); finally evaluate the big items (system retrofit, equipment replacement) — the investment goes from small to large and the benefit from fast to slow. An example: A company verifies the three points one by one — the power factor rises from 0.82 to 0.95 and the reactive loss drops; the leakage falls from 15% to 5% and one compressor is spared; the air-conditioning goes VFD and the delta-T recovers — the three points together save a visible annual bill. The logic is that the opportunities must be "verified" not "estimated" — the power factor, the leakage rate and the delta-T are measured — with data, the retrofit dares to invest.
5. What the Audit Report Should Output
The structure of the report — the status description, the flow diagram, the loss-point list, the opportunity list, the implementation priority and the expected benefit; The numbers of the report — each opportunity gives: the saveable energy, the investment estimate and the payback period; The ranking of the report — ranked by the payback period from short to long: do the quick wins first, then the big items; The verification of the report — the opportunities are based on measured data: without measurement and without estimation, the report is convincing.
In one sentence: the report = the status + the flow diagram + the loss points + the opportunities + the priority + the expected benefit — each opportunity has data, a ranking and verification.
The check list of the report — is the energy flow diagram drawn? Are the loss points marked and quantified? Are the opportunities listed and ranked? Are the expected saving and the payback period given? Is the report based on measured data rather than estimation? — all five complete, the report is qualified. An example: A company's report has 12 opportunities ranked by the payback — the first three (compensation, leak sealing, VFD) pay back in 6-12 months and the last three (big retrofit) in 2-3 years — the company does the quick wins first and evaluates the big items. The logic is that the point of the report is an "action guide" — with a ranking, the company knows what to do first; with data, it dares to invest — the value of the report is in the executability.
Back to the energy supervision center plan — the quantifying tools of the audit: the ESE power-quality monitor examines the power factor, the harmonics and the three-phase unbalance (the supply/distribution line); the SFE power-quality measuring-controlling device examines the power quality and the demand of the important circuits; the energy supervision center sub-meters by system and generates the energy flow automatically — the audit changes from "a one-time examination" to "continuous online" — after this examination, the platform keeps watching for you.**
Scope and Limitations
- The conclusions in this article are intended for LV distribution and electrical-safety sites. Standard numbers (GB/T 17166) refer to their currently effective editions, and product parameters follow the latest FEXLINK selection handbook and product knowledge base.
- Quantitative criteria (protection zone, discharge and residual voltage, earth resistance, thresholds and grading) hold under the preconditions stated in this article. Where the site voltage level, earthing arrangement, environmental category or load profile differs, the figures must be recalculated. Specific configurations involving ESE power-quality monitor, SFE power-quality controller should be verified against actual circuit parameters.
- Specific product models and parameters are subject to the latest selection handbook and product knowledge base; this article does not constitute selection or procurement advice.
- Standard numbers cited here refer to the currently effective editions; when a standard is revised, the related quantitative conclusions must be re-checked.
- Deployment and implementation for specific projects must be carried out by qualified engineers based on site survey and design drawings.
Frequently Asked Questions
What Does an Energy Audit Actually Examine
An energy audit is not a casual walk-through — it systematically checks four lines: the power-supply and distribution system