 FEXLINK Research Institute
Direct Answer
Production is far from full load — why does the maximum-demand charge stay so high? The maximum demand is determined by the peak of a few periods, not by the average load rate — the common culprits are many large devices starting at the same time (the air compressor, pump and fan groups powering on together) or the starting impact of a large device — use the demand curve to find that peak moment, then stagger the starts.
A scenario: A company's average load rate is not high — it thinks the demand should not be high — but the maximum-demand charge never falls — it searches without finding the culprit that "raises the peak". The logic is that the demand looks at the "peak", not the "average" — a low average load rate only says that most periods use little power — as long as a few windows raise the peak, the whole month is billed by this peak — to find the culprit, look at the demand curve, not the average load rate.
1. Why a Low Average Load Rate Does Not Mean a Low Demand
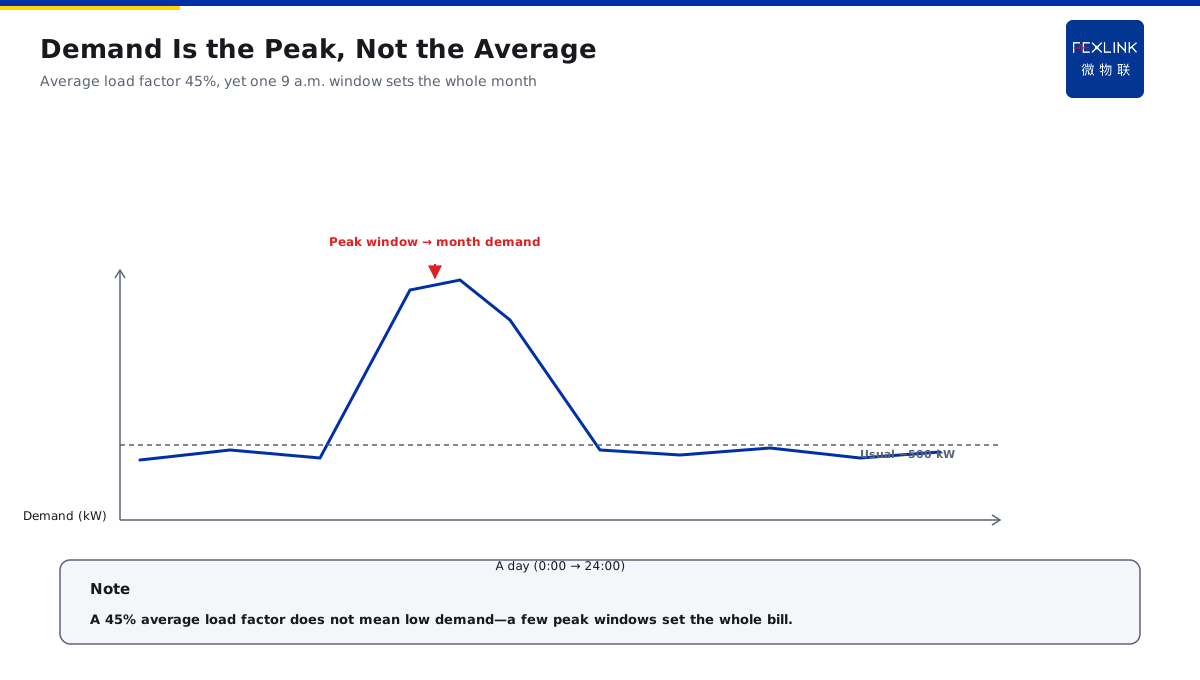
The definition of the demand — the maximum average power within the 15-minute window: it takes the highest window of the whole month; The definition of the average load rate — the monthly energy divided by (the running time times the installed capacity): it reflects the overall utilization; The mismatch of the two — a low average and a high peak: most periods use little power, while a few windows use power in a concentrated way; The billing rule — billed by the maximum demand: the peak of one window decides the monthly basic charge.
In one sentence: the demand takes the peak and the load rate looks at the average — the two indicators are not the same thing — if the peak is high, a low average is useless.
The comparison table of the two indicators:
| Item | Average load rate | Maximum demand |
|---|---|---|
| Reflected | Overall utilization | Peak-window power |
| Affected by | Total energy | A few peaks |
| Decides | Energy charge | Basic charge |
| Check direction | Energy efficiency | Start moment |
An example: A company's average load rate is 45% — but the maximum-demand charge stays high — check the demand curve: a 15-minute window at 9:00 every day hits the peak. The logic is that a low average load rate only says that the overall use is not saturated — the demand charge looks at the peak window — as long as that one window a day is high, the whole month is billed by it — looking at the wrong indicator means the culprit is never found.
2. Many Devices Starting at the Same Time Is the Main Cause
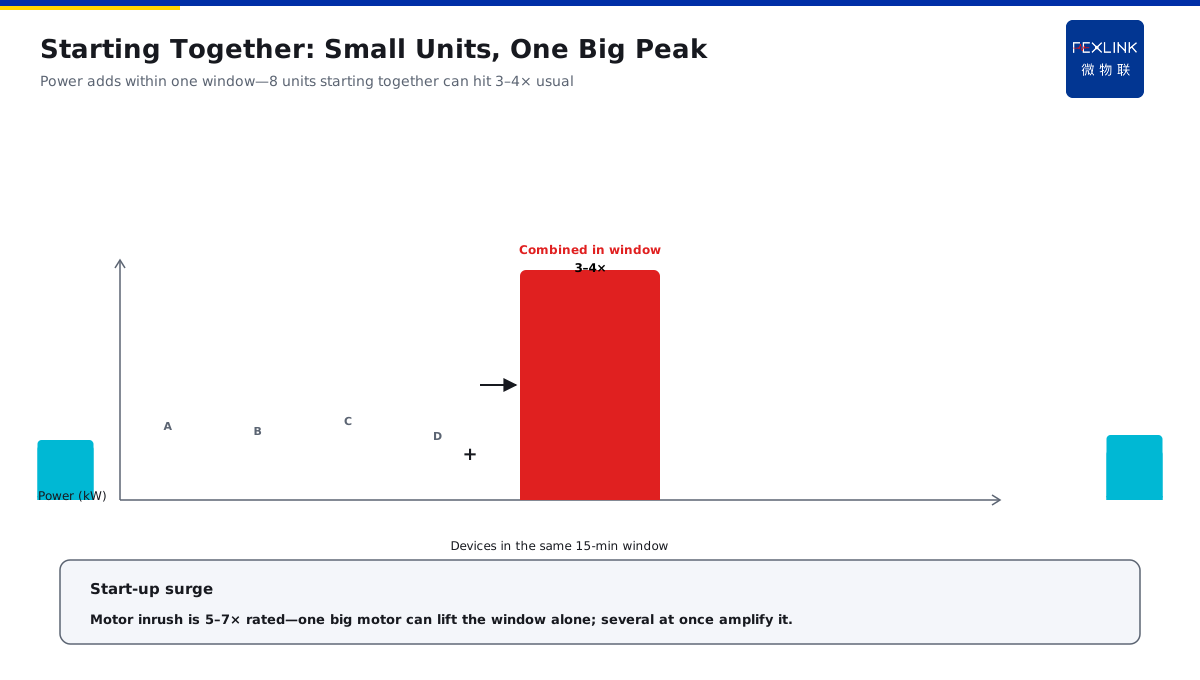
The principle of the addition — many large devices start together: the power adds up in the same window and the peak rises instantly; The common scene — starting together at shift change: the air compressor, pump and fan groups power on in the same minute; The consequence of the addition — the peak far exceeds the usual level: a single device is not large, but starting together "splices" a big peak; The judging method — look at the start moment: whether the peak window coincides with the power-on time.
In one sentence: many devices starting together adds the power in the same window — the peak is "spliced" high — staggering the starts is how to break this peak.
A quantitative reference of the addition — adding in the same window: within the same 15-minute window, the device powers add directly; the peak decides: the added window peak is the candidate of the demand; being several times is normal: with 8 devices starting together, the peak may be 3-4 times the usual level — a quantitative reference, judged by the actual curve.
An example: A company powers on in a concentrated way at 8:00 every morning — 8 devices go on at the same time — the demand curve shows a sharp peak exactly at 8:00 — the average load rate is low, but this sharp peak decides the monthly demand. The logic is that the addition is not simply "the sum of the device powers" — it is the instantaneous power adding in the same window — the more concentrated the power-on time, the stronger the addition — stagger the power-on time and the peak spreads out.
3. The Starting Impact Current Raises the Demand Window
The source of the impact — the motor starting current: the starting moment can reach 5-7 times the rated current; The window effect — the impact falls into the 15-minute window: as long as the impact is in the window, it is counted into the average power; The consequence of the raise — one large motor starting: it alone can raise the demand window; The amplification of the addition — many large motors starting together: the impact currents add up and the peak is amplified.
In one sentence: the starting impact current is 5-7 times the rated current — falling into the window raises the demand — starting together, the impacts add up even harder.
An example: A 200 kW air compressor starts — the starting impact raises the window demand to 900 kW — the usual load is only 500 kW — the peak is nearly twice the usual level. The logic is that the starting impact is an "instant amplification" — one device starting can hold up the whole window — the larger the impact current and the more frequent the starts, the easier the demand is raised — watching the start moment is watching the demand.
4. Use the Demand Curve to Locate the Peak Moment
The value of the curve — draw the demand of the 15-minute windows: the peak moment is clear at a glance; The locating method — find the largest window: see at what time the highest window of the whole month appears; Look back at the scene — compare the production record: what happened at the peak moment and which devices were running; Lock the culprit — restore the addition scene: whether it was a simultaneous power-on or a large-device start.
In one sentence: the demand curve finds the peak moment — look back at the production record and restore the scene — the culprit is locked.
An example: A company draws the demand curve with the ESA meter — the largest window is 9:00-9:15 every day — looking back at the record: it is exactly when the air compressor and the fan group start together — the culprit is locked. The logic is that locating the peak is not a "guess" — the demand curve lays out the windows and the production record restores the scene — comparing the two exposes the culprit — the culprit is not found because the curve is not looked at.
5. The Countermeasures of Staggering the Starts and Batching the Power-On
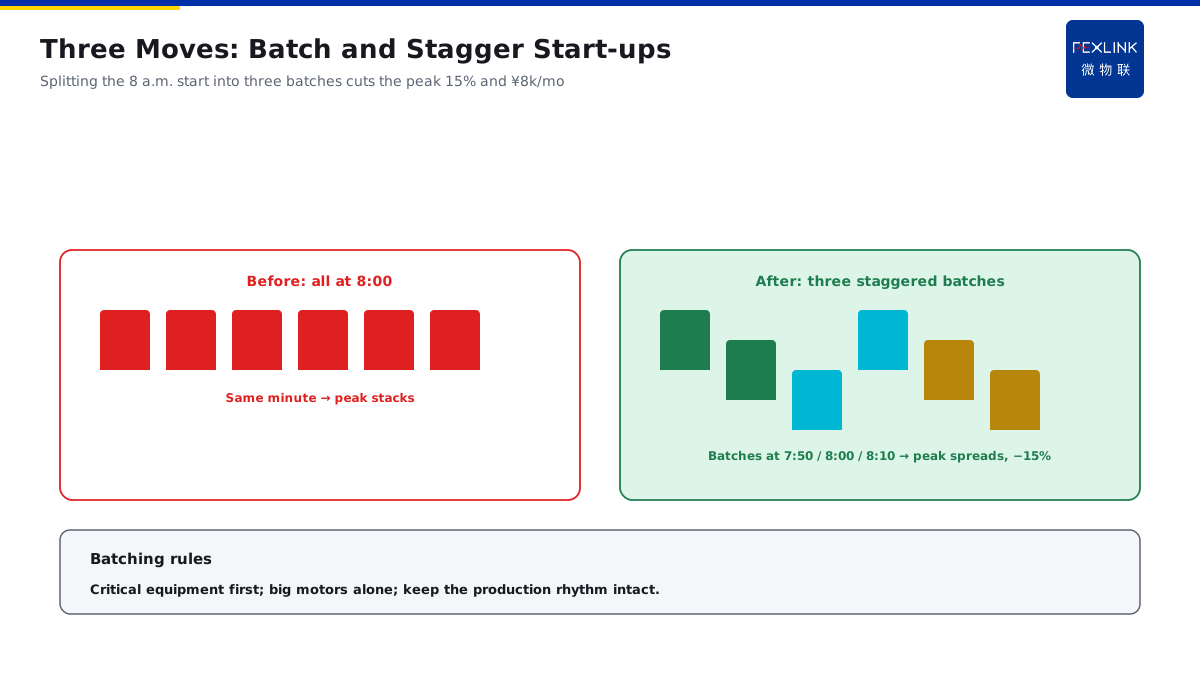
Staggering the starts — split the concentrated power-on: power on the same batch of devices in 2-3 groups, minutes apart; Batching the power-on — batch by priority: start the critical devices first and the auxiliary devices later; Optimizing the start order — avoid the impact addition: start the large motors separately and do not impact together; Platform assistance — the load prediction anticipates: the TIANYAN E-06 predicts the peak window and reminds the staggering in advance.
In one sentence: stagger the starts, batch the power-on and optimize the order — the three tricks break the added peak — with the platform anticipating, the staggering is more proactive.
The batching principles — by the start priority: the critical devices first and the auxiliary devices later; by the start current: the large motors in a separate batch to avoid the impact addition; by the process connection: batch without affecting the production rhythm — the three principles keep the power-on from adding peaks.
An example: A company changes the concentrated 8:00 power-on into three batches at 7:50/8:00/8:10 — the demand peak falls 15% — the monthly basic charge saves 8,000 yuan. The logic is that staggering costs nothing and the effect appears immediately — the same devices and the same output, only the power-on time is spread — the peak spreads and the demand falls — staggering the starts is the cheapest lever of demand management.
Back to the ESA meter and the TIANYAN E-06 match — the ESA meter draws the demand curve by the settlement basis: locating the peak window; the TIANYAN E-06 load prediction anticipates the future peak: reminding the staggering window in advance; the energy supervision center issues the staggering strategy to production: batching the power-on by the prediction — locate the culprit, stagger in advance and verify the effect — if the demand charge stays high, find the peak moment first and break the added peak next — draw the demand curve and the culprit appears.**
The maximum demand is decided by the peak of a few periods, not by the average load rate — a low average with a high peak means a high demand — many large devices starting together adds the power in the same window — the starting impact current is 5-7 times the rated and raises the demand when falling into the window — use the demand curve to locate the peak moment and look back at the production record to lock the culprit — stagger the starts, batch the power-on and optimize the order: the three tricks break the added peak — the ESA meter draws the curve, the TIANYAN E-06 anticipates the peak and the platform issues the staggering strategy — if the demand charge stays high, find the peak moment first and break the added peak next.
Scope and Limitations
- The conclusions in this article are intended for LV distribution and electrical-safety sites. Criteria are compiled from public codes and FEXLINK product documentation, and product parameters follow the latest selection handbook and product knowledge base.
- Quantitative criteria (protection zone, discharge and residual voltage, earth resistance, thresholds and grading) hold under the preconditions stated in this article. Where the site voltage level, earthing arrangement, environmental category or load profile differs, the figures must be recalculated. Specific configurations involving ESA all-element smart meter, Tianyan engine E-06(load forecast) should be verified against actual circuit parameters.
- Specific product models and parameters are subject to the latest selection handbook and product knowledge base; this article does not constitute selection or procurement advice.
- Standard numbers cited here refer to the currently effective editions; when a standard is revised, the related quantitative conclusions must be re-checked.
- Deployment and implementation for specific projects must be carried out by qualified engineers based on site survey and design drawings.
Frequently Asked Questions
Production Is Far from Full Load—Why Does the Maximum-Demand Charge Stay So High?
Production is far from full load — why does the maximum-demand charge stay so high